David Galehouse, Tommy Nguyen, Sameet Sreenivasan, Omar Lizardo, G. Korniss (2019). Impact of Network Connectivity and Agent Commitment on Spread of Opinions In Social Networks. In: Advances in Cross-Cultural Decision Making. AHFE Open Access, vol. 6. https://doi.org/10.54941/ahfe100197
The spread of opinions in social networks underlies other important socio-economical processes such as the spread of innovations, the acceptance of new technologies, or the speed of modernization of infrastructure and industries. Here, we present our results on spread of opinion and the fundamental role played in this spread by two characteristics of the agents, average interconnectivity and level of commitment to the current opinion. Those in turn are dependent on many cultural characteristics of the agent's society, such as trust in others, openness to new views, willingness to discuss certain opinions outside the narrow group of family and close friends, and so on. We also report on our initial investigation how the first factor, average connectivity of social network nodes, varies across cultures based on a study of a real social network. In our Binary Adoption Model (BAM) with committed agents, the spreading of opinions involves two stages. Without sufficient support, the committed minority can advance its cause only by increasing its ranks to the so-called tipping point fraction. After such a fraction is achieved, the opinion spreads rapidly across the society. We discuss how the tipping point fraction is impacted by the two social-based factors mentioned above.
Spread of opinions in social networks (Castellano et al., 2009, Durlauf, 1999, Galam, 2008) underlies other important socio-economical processes such as spread of innovation, acceptance of new technologies, or even the speed of modernization of infrastructure and industries. In this paper, we present our results on spread of opinion and the fundamental role played in this spread by two factors characteristic of community or society in which such spread is going on. One is the average interconnectivity of the opinion holders, while the other is the level of commitment of opinion holders to their opinion. Despite their simplicity, both factors are dependent on many cultural characteristics of the society of which the opinion holders are members, such as trust in others, openness to Cross-Cultural Decision Making (2019) new views, willingness to discuss certain opinions outside the narrow group of family and close friends, and so on. We will also report on our initial investigation how the first factor, average connectivity of social network agents, varies across cultures based on a study of a real social network.
Previous studies on binary opinion dynamics (Xie et al., 2011, Xie et al., 2012, Zhang et al., 2012, Szymanski et al., 2012) have demonstrated how the presence of a critical fraction of committed individuals (Lu et al., 2009), i.e., individuals who steadfastly hold onto one of the two opinions, is sufficient to cause the entire network to quickly converge to the same opinion. Here we study an extension of this binary agreement model to the case where the commitment of an initial set of committed nodes can be eradicated as a result of repeated exposures to the opposite opinion. The rules governing the opinion dynamics are identical to those utilized in (Xie et al., 2011) and based on the Naming Game (NG) (Baronchelli et al., 2006, Dall’Asta et al., 2006), and we refer the reader to those articles for a detailed description of the rules. The spread of opinions from the holders of minority opinion of a society to its majority under the binary agreement model involves two stages. Without sufficient support, the committed minority can advance its cause only by increasing its ranks to the so-called tipping point fraction, denotes as pc. After such a fraction is achieved, the opinion rapidly spreads across the society.
Among a number of potentially relevant details, two important factors strongly impact the actual value of the tipping point fraction in a social network with two committed minorities competing for majority, ranging from 2% to 16.25%. One factor is the average interconnectivity of the network agents. The higher is the average degree of the agents in the network, the higher must be percentage of the minority committed to the opinion to enable its spread. The second factor is the level of commitment of minority members to their opinion. This is measured by the number of consecutive social interactions with holders of the opposing opinion that a member requires to switch the opinion. An uncommitted, or regular, member exposed to the single contrary opinion held by a friend, initially gets into the mixed state in which it will accept the opinion proposed by its next interlocutor, thus switching to the opposing opinion if this interlocutor holds the same. In contrast, an agent committed to an opinion at the commitment level k>1 enters the mixed state only after k subsequent interactions with friends holding the opposing view. Naturally, the higher the level of commitment of minority members, the lower is the critical size of the minority group needed for fast spread of the opinion. We also analyze real social networks of freshmen at a US university and students in US high-schools in order to determine how the two social-network-based factors discussed above depend on different traits of the agents such as personality, religion, social class, gender, and race.
The Binary Agreement Model with committed agents used in this paper allows only for two opinions, A, and B, that agents can chose from and therefore it is a special case of more general Naming Game models (Dall’Asta et.al, 2006) where a single asymmetry is introduced through the random inclusion of a minority fraction of committed agents whose opinion are fixed for all times to be A, say. The key observable is the expected time to consensus of the A opinion and its dependence on the committed fraction and the average agent interconnectivity. In (Zhang et. al., 2011, Xie et. al., 2012), we show that, for a complete graph, when the committed fraction grows beyond a critical value pc ≈ 0.0979, there is a super-exponential decrease in the time taken for the entire network to adopt the A opinion. Specifically, using a straightforward mean field approach, coarse-grained stochastic analysis, and direct simulations of the NG, we show that for p < pc, the mean consensus time Tc is large, Tc ∼ eN, while for p > pc, it is small, Tc ∼ lnN.
In the presence of committed agents of opinion A, the only absorbing state in the associated random walk Markov chain model (Zhang et. al., 2011) is the consensus state of opinion A, while the near-consensus state where all susceptible agents have the B opinion becomes a reflecting state. Similarly, the averaged or mean field system of two coupled nonlinear differential equations (Xie et. al., 2012), undergoes a saddle-node bifurcation when p = pc, in which the saddle point (symmetric in phase plane in the case with no committed agents) merges with a node to form a new equilibrium point of saddle node type (Strogatz, 1994). The Tc ∼ lnN time scale comes from the slow dynamics along the center manifold between the saddle node and the consensus of A opinion, and is the same order as the symmetric case where there are no committed agents. In contrast, for p < pc, the Tc ∼ eN time scale is due to the additional numerous time steps spent along that portion of the center manifold which is between the stable fixed point and the saddle-point where the latter corresponds to a state with a larger fraction of agents of opinion A than the former.
Simulations on a range of sparse random networks with 100 to 10,000 nodes have shown, after extensive and costly numerical experiments, that the above tipping point effect of the NG with a minority fraction of committed agents is a very robust phenomenon with respect to the underlying network topology. Of particular significance is the numerical and empirical observation (Xie et. al., 2012) that as one lowers the average degree of the underlying random network, the tipping fraction pc decreases.
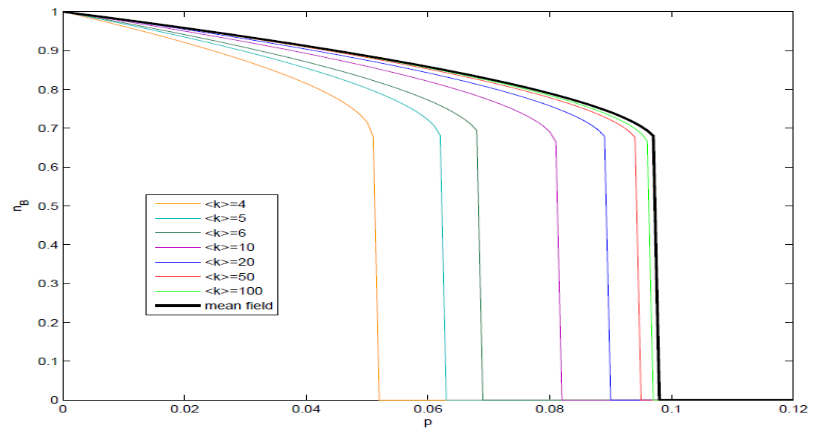
In (Zhang et. al., 2012), we analytically establish the numerical discovery using a refined mean field approach (Strogatz, 1994) and report on precise changes in NG dynamics with respect to the average degree <k> of an uncorrelated underlying network which are beyond the reach of the straightforward mean field model discussed in (Zhang et. al., 2011, Xie et. al., 2012). Specifically, as shown in Figure 1, the critical tipping fraction in the binary agreement model decreases to a minimum of 5 percent when the average degree <k> = 4 from a maximum of nearly 10% for complete graphs. This shows that the new mean field model is in better agreement with the numerical results reported above in (Xie et. al., 2012) and provides a much improved approximation to NG dynamics on large random networks in comparison to the straight forward mean field model in (Xie et. al., 2012).
Figure 1. Dependence of the critical committed fraction pc on agent's connectivity <k>.
COMMITTED INDIVIDUALS WITH WANING COMMITMENT AND TIPPING POINTS IN OPINION DYNAMICS The two-word NG rules (corresponding to the binary opinion dynamics) discussed in the paper can be summarized as follows. At each simulation time step, a randomly chosen speaker voices a random opinion from his list to a randomly chosen neighbor (designated as the listener). If the listener has the spoken opinion in his list, both speaker and listener retain only that opinion, or else the listener adds the spoken opinion to his list.
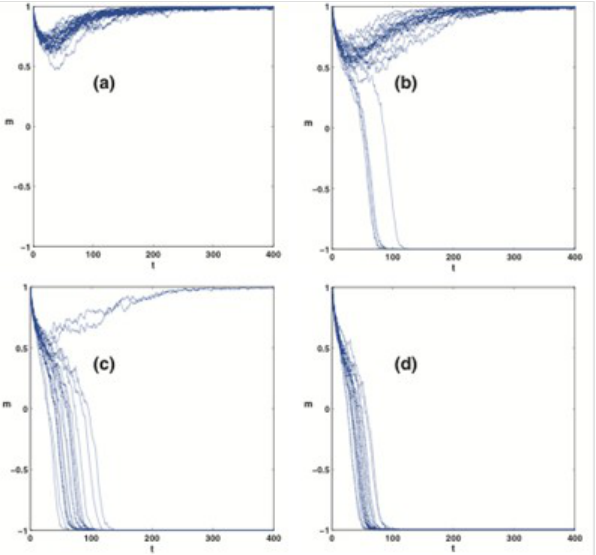
The important distinction in the study presented here is that a committed individual is assumed to become uncommitted after w consecutive pairwise interactions with individuals voicing the opposing opinion. The parameter w thus represents the strength of commitment. Interestingly, as a result of this distinction, any existing stable (attractive) fixed point of the underlying dynamical system is necessarily an absorbing fixed point corresponding to consensus in one of the two opinions. In contrast, when commitment is indefinite (w = ∞, equivalent to model of (Xie et al., 2011), when the committed fraction is below the critical value, one of the stable fixed points corresponds to a mixed state where densities of all opinions are non-zero. We designate the two opinions A and B, and denote their respective densities by nA and nB respectively, and the initial fraction of committed nodes in opinion A is denoted by pA. To quantify the degree of dominance of one of the opinions over the other, we utilize the order parameter m = (nB-nA)/(1-pA). Thus, the case of m = 1 represents the absorbing fixed point where all individuals have arrived at a consensus on opinion B, while the case of m = -1 corresponds to the absorbing fixed point which is equivalent to consensus on opinion A. Shown in Figure 2 are 20 representative evolutions of the order parameter for different initial committed fractions pA, and with commitment strength w = 10, as obtained from simulations. Each simulation begins with all uncommitted nodes holding opinion B; all committed nodes hold opinion A. For pA = 0.10, all committed individuals eventually lose their commitment, and the network comes to consensus on opinion B [Fig. 1(a)]. However, as pA increases, we observe increasing numbers of simulation runs where the initial committed fraction is able to propel the system to consensus on opinion A [see Figures 2(b), (c), and (d)]. This is indicative of the existence, in the asymptotic limit, of a critical fraction pc(w) above which the system reaches the all-A consensus state with probability one, and below which it becomes exponentially unlikely for the system to reach the all-A consensus state, despite the existence of an initial committed fraction proselytizing this opinion. In other words, above pc(w), the all-A consensus is the only attractive fixed point remaining in the system, while below it, both the all-A consensus and all-B consensus fixed points are attracting, but the bias towards opinion B in the initial population ensures that in the asymptotic limit of network size, the system eventually converges on opinion B.
Figure 2. Trajectories of the order parameter m for different values of the committed fraction pA with commitment strength w = 10. The four plots correspond to values of committed fraction (a) pA = 0.10, (b) pA = 0.11, (c) pA = 0.12, and (d) pA = 0.13. The social network is a Barabási-Albert network (Barabási and Albert, 1999) with N =1000 nodes and average degree <k> = 10.
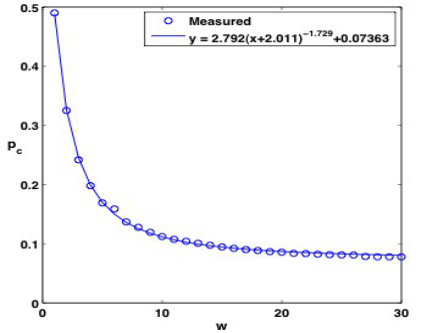
We also study how the critical value pc(w), at which the transition occurs depends on the commitment strength w. Figure 3 shows the variation in pc(w), estimated from simulations, as a function of w. The results suggest an asymptotic scaling form pc(w) ≈ pc(∞)+a/(b+w)d, where d ≈ -1.73.
Figure 3. The critical committed fraction pc(w), as a function of commitment strength w for Barabási- Albert networks of size N = 1000 with average degree <k> = 10.
Next, we consider the case where there are initially two committed groups of individuals within the network, one proselytizing opinion A and the other proselytizing opinion B, with both groups having a commitment strength w. Previous studies (Xie et al., 2012, Szymanski et al., 2012, Verma et al., 2012, Verma et al., 2014) on such competition between committed groups with infinite commitment (w = ∞) have demonstrated the existence of a beak-shaped phase diagram in parameter space (pA, pB), where the boundaries of the beak are lines indicating saddle- node bifurcations – points at which the system undergoes a transition where one of the two stable fixed points disappears. Thus, inside the beak the system has two stable fixed points with transitions between them being exponentially rare, whereas outside the beak the system has a single fixed point favoring the opinion with the larger committed fraction. Importantly, for the case of infinite commitment, the stable points both inside and outside the beak represent mixed states with non-zero densities of both opinions.
When the commitment parameter is finite, we get a qualitatively similar picture as shown in Figure 4(a). However, in this case the region within the beak has two absorbing stable fixed points corresponding to the all-A and all-B
Figure 4. (a) Phase diagram of the system in the presence of competing committed groups holding opinion A and B with initial sizes pA and pB, respectively for Barabási-Albert networks with average degree <k> = 10 (see text for details). (b) The fraction of runs reaching the all-A consensus state along a trajectory pA = 0.2pB in parameter space. (c) The fraction of runs reaching the all-A consensus state along a trajectory pA = 0.8pB in parameter space.
Figure available in the original PDF paper.
consensus states. Outside the beak, for example in the region below the diagonal, only one absorbing point (the all-A consensus state) is attracting, and the system deterministically ends up there. A point on the boundary of the beak can be detected in the following manner. Suppose that initially the system consists of all uncommitted nodes holding opinion B. Then for values of (pA, pB) that place the system within the beak, the system eventually ends up in the all- B consensus state as a result of the initial bias, coupled with the fact that the all-B consensus state is an attracting fixed point. However, if we systematically follow a path in parameter space that takes the system from being inside the beak to outside the beak (and beneath the diagonal), then we expect that once the beak boundary is crossed, the system will end up in the all-A consensus state, since it is the only attractive fixed point that remains. The location of this phase transition provides an estimate of a point on the beak boundary. The entire phase diagram, as shown in Figure 4, can be constructed by systematically exploring paths pA = c*pB in parameter space, for distinct values of c ranging from 0 to 1, and estimating for each path, the point [i.e., (pA, pB) values] at which the transition occurs. Two such transitions encountered along paths with c = 0.2 and c = 0.8 are shown in Figure 4(b) and 4(c) respectively.
A notable feature in the phase diagram, Figure 4(a), is that as the commitment strength w increases, the region where both absorbing points are attractive, i.e. the region within the beak becomes narrower. As w → ∞, the phase diagram converges to that obtained in (Xie at al., 2012).
EVIDENCE OF IMPACT OF AGENT SOCIO-DEMOGRAPHIC CHARACTERISTICS ON ACTIVITY AND ASSORTATIVE MIXING In this section we first summarize the findings concerning socio-demographic differences in both activity (Simmel and Hughes, 1949) and assortative mixing (Newman, 2003). The analysis is based on a social network of freshmen at an US university. The network contains 186 vertices (agents) and 647 undirected edges formed between August and December of 2011. The network is constructed by placing an edge between two vertices if we observed at least one two-way communication (text, or voice call) between the two agents in the given time period. We restrict our analysis to within study dyad because we have complete socio-demographic and attitudinal information on this subset of agents.
Sociability effects refer to the higher likelihood of members of certain categories to form more connections to other persons regardless of the socio-demographic traits of those persons. Studying assortative mixing in the context of modelling opinion spread is important for the following reasons. It is well know that opinions, beliefs, and other cultural commitments tend to be different for members of different socio-demographic groups. This means that when persons interact with those who are similar to them, their current beliefs and values are likely to be reinforced. Opinion change in real social networks is more likely to happen for those individuals who are more likely to venture outside of their own group for sociable intereactions (Aral, 2009, Robins, 2007, Granovetter 1973). A social system characterized by high levels of assortative mixing is also one that is likely to exhibit opinion polarization rather than homogeneity.
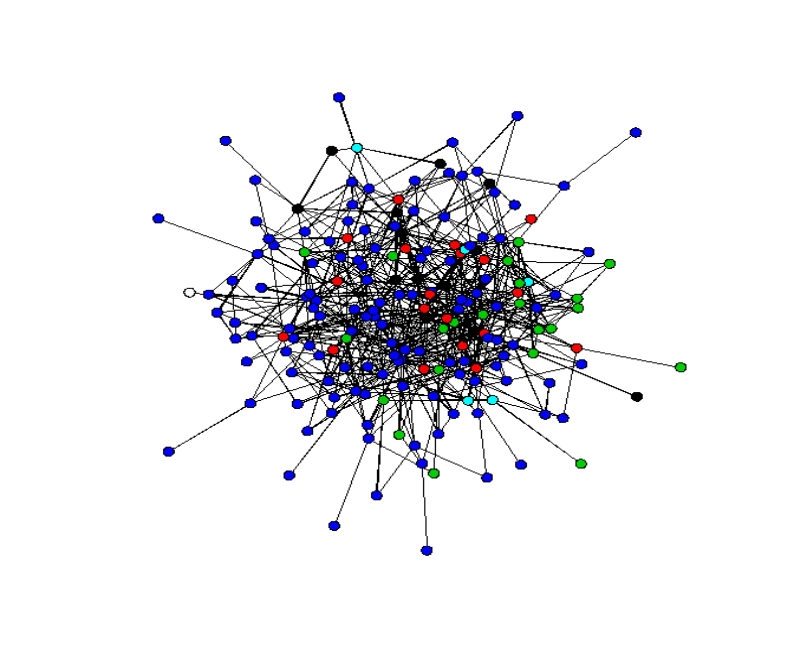
Figure 5. NetSense within-study network. Vertex color indicates race, Blue = White, Red = African
American, Green = Latino, Black = Asian, Teal = Other.
We identify both sociability and assortative mixing effects using exponential random graph models [ERGMs] fitted to the network (Hunter, 2008). These models allow us to ascertain statistical dependences on the network while adjusting for lower order network properties, such as the overall tendency to form edges (density) and the tendency for agents who share neighbors to also be connected to one another. The purpose of ERGMs is to provide a summary description of the local relationship formation mechanisms that generate the global structure of the network. For instance, the NetSense network (depicted in Figure 5), may be considered similar to the response or outcome variable in a regression or classification model. Here the predictors of whether we observed an edge (or not) are such things as “the propensity of individuals of the same gender/race/religion/class background to form connections” or “the propensity of individuals who share friends to be connected to one another.” In Figure 5 for instance, it is clear that individuals who share the same racial/ethnic status tend to cluster together. The ERGM can help us quantify the strength of this assortative mixing effect, while holding constant other confounding relationship formation mechanisms.
Interpreting ERGM parameters The exponential random graph model specifies the conditional log-odds of an edge existing between two nodes vs. not existing, conditional on values of covariates and a network configuration:
θT δij(x)+θa(yi+ yj )+θb yi yj
Pr (Xij=1∨Y=y , Xij=xij) Pr (Xij=0∨Y=y , Xij=xij)=e Where refer to [Equation or mathematical symbol available in the original paper PDF] a as the (additive) activity parameter, and [Equation or mathematical symbol available in the original paper PDF] b is the (multiplicative) assortative mixing parameter; yi, yj are the values of each vertex on a given socio-demographic trait of interest (in this example gender, which is a categorical trait with two values: male, female). The other term is for the configuration (endogenous) part of the model. In our case, this involves a parameter for the overall number of edges in the graph (density) and a parameter that counts the number of shared neighbors for each node in the graph (transitivity). For the purpose of interpreting the activity and mixing parameter, we can ignore that part of the model because when taking odds ratios it drops out (assuming that the configuration model is the same for all edges).
What we can compute from this model is the conditional odds ratio. The reference category for these odds is yi = yj = 0, i.e. the (0,0) cell in the n x m table cross classifying edges by whether they have or do not have the trait Y = y, which in our case is a 2 x 2 table cross-classifying edges by the gender mix of the vertices attached to them. Thus, for the example used here Y is gender and Y = 1 indicates that the node is female.
The conditional odds ratio for an edge having one node with Y = 1 versus having both vertices with Y = 0 (e.g., odds ratio of male-female tie versus male-male tie) is e[Equation or mathematical symbol available in the original paper PDF]a
, the activity parameter. Its value defines the odds that, conditional on one node being male, the other will be female. If the activity parameter is 0, then the odds ratio is 1, making the odds of male-female tie the same as the odds of male-male tie. This means the counts of male-male and male-female ties should be the same. If the activity parameter is greater than 0, then male-female ties are more prevalent than male-male ties, if less than 0, male-male ties are more prevalent than male-female ties. The activity parameter reflects difference in the degree of male versus female, because the only way male-female ties can be more prevalent than male-male ties (assuming random matching, i.e. no homophily) is if females have more ties than males.
If there is no homophily (i.e., random matching), then the odds of a female-female tie versus a male-male tie is e2[Equation or mathematical symbol available in the original paper PDF]a. That is we expect more female-female ties solely because there are females having more edges (i.e. are more likely to be at the end of a random edge), so that the odds of a female being at both ends of an edge is the exponential of 2 times the activity parameter. If there is homophily (positive [Equation or mathematical symbol available in the original paper PDF] b parameter) then the odds of a female-female tie versus a male-male tie is e2[Equation or mathematical symbol available in the original paper PDF]a+[Equation or mathematical symbol available in the original paper PDF]b. The 2[Equation or mathematical symbol available in the original paper PDF] a captures the greater odds of a female-female tie due to the higher activity of females, while the [Equation or mathematical symbol available in the original paper PDF] b term adds in increased odds of female-female ties resulting from assortative mixing. Note that the odds of the female-female tie versus a male-female tie is now e[Equation or mathematical symbol available in the original paper PDF]a+[Equation or mathematical symbol available in the original paper PDF]b. Relative to the male-female edge, the female-female edge gets a boost over the male-female edge because females have higher activity and because of activity differences female-female ties are more prevalent.
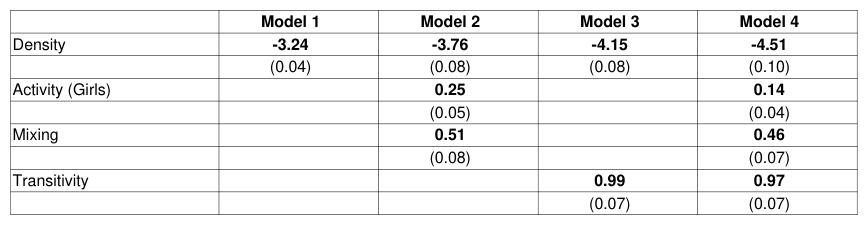
For instance, from our estimates (Table 1, Model 4) we can see that [Equation or mathematical symbol available in the original paper PDF] a = 0.14 and [Equation or mathematical symbol available in the original paper PDF] b = 0.46. We coded female as 1 so the reference like above is male-male ties. The odds of a male-female versus a male-male ties is e0.14 - 1 = 15%, i.e., the former are 15% more likely than the later, reflecting the higher activity of women. Without the homophily effect this would imply that female-female ties would be about 32% more prevalent than male-male ties (e.g. e2*0.14 - 1). But taking into account the assortative mixing effect and the odds of a female-female vs a male-male tie is e2*(0.14 + 0.46) = 2.09, implying that female-female ties are more than twice as likely (209% more likely) than male-male ties. Finally, contrasting female-female versus male-female ties, we see that female-female ties are e(0.14 + .46) = 1.82 times more likely that male-female ties.
In our estimates (Table 1) female-female ties are more prevalent, than male-female ties, which are more prevalent then male-male ties. This is indicative of strong female assortative effect coupled with females having high degree, which implies a tendency for males to not associate with other males because they randomly associate with other people who happen to be more likely to be females because of their higher activity.
Additional Parameters Density - All of the ERGMs models that we estimate hold two structural parameters constant. The first one is the density parameter. This is equivalent to the single Bernoulli probability of observing an edge in the Erdos-Renyi model. A model including only this parameter would be in fact equivalent to the E-R model for random networks. This parameter holds constant the propensity to form edges in the network independently of vertex level activity and assortativity effects.
Transitivity - There are various ways to model transitivity (the tendency of friends of friends to be friends) in the ERGM framework. Here we opt for specification described in (Hunter, 2008) which accounts for transitivity in the network by fitting the geometrically weighted edgewise shared partners (GWESP) statistic. This parameter is essentially equivalent to a penalized count of the number of shared neighbors for each edge in the network and therefore essentially is the number of edges that serve as a common base for i distinct triangles. Cross-Cultural Decision Making (2019)
Table 1: Gender-Based Activity and Assortative Mixing Model 1 Model 2 Model 3 Model 4 Density -3.24 -3.76 -4.15 -4.51 (0.04) (0.08) (0.08) (0.10) Activity (Girls) 0.25 0.14 (0.05) (0.04) Mixing 0.51 0.46 (0.08) (0.07) Transitivity 0.99 0.97 (0.07) (0.07)
Race
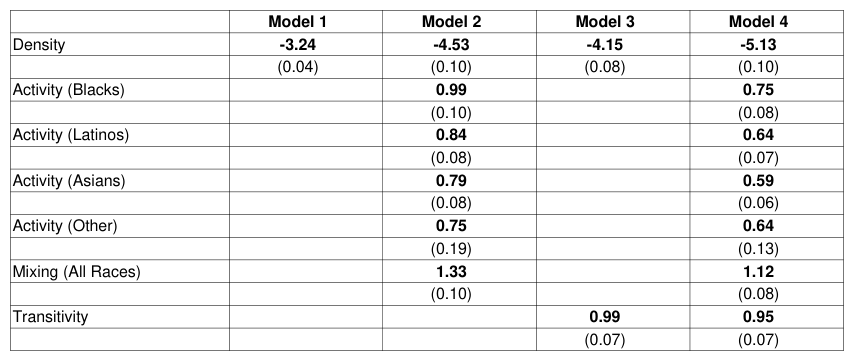
Table 2 shows the result of fitting and ERGM model with separate activity parameters for each racial and ethnic group and a common assortative mixing parameter for all race groups. We find that, in terms of activity, minority groups are more active than Whites in their first semester on campus. Recall that the activity coefficients compare the odds of observing an edge featuring a non-white respondent versus the odds of observing an edge containing two white respondents. Across all racial groups (as indicated by the positive activity effects) we find that mixed race edges are more prevalent than the all White edges.
Table 2: Race-Based Activity and Assortative Socializing Model 1 Model 2 Model 3 Model 4 Density -3.24 -4.53 -4.15 -5.13 (0.04) (0.10) (0.08) (0.10) Activity (Blacks) 0.99 0.75 (0.10) (0.08) Activity (Latinos) 0.84 0.64 (0.08) (0.07) Activity (Asians) 0.79 0.59 (0.08) (0.06) Activity (Other) 0.75 0.64 (0.19) (0.13) Mixing (All Races) 1.33 1.12 (0.10) (0.08) Transitivity 0.99 0.95 (0.07) (0.07)
In addition, we find that same race dyads are statistically more prevalent than mixed-race dyads ([Equation or mathematical symbol available in the original paper PDF] b = 1.33), even after adjusting for the propensity of friends of friends to also be connected to one another ([Equation or mathematical symbol available in the original paper PDF] = 0.95). Thus, even though Whites are less active than non-whites, when they do form ties, they are disproportionately likely to be directed at other Whites. Non-whites on the other hand, have similar same-race preferences, but due to their higher activity, end up forming more mixed-race connections than we would expect by chance.
Religion We find that (Table 3, Model 3) students that claim no religion are less socially active than students who report being Catholic. We find (Table 3, Model 2) that edges are more likely to form between agents that share the same religious status (e.g. Catholic, Protestant, or No Religion); [Equation or mathematical symbol available in the original paper PDF] b = 0.45. However, the strength of the assortative mixing effect is not the same across the different religion categories. Instead, the assortative mixing effect is very strong among agents with no religion ([Equation or mathematical symbol available in the original paper PDF] b = 1.62), it is fairly strong among Protestants ([Equation or mathematical symbol available in the original paper PDF] b = 0.80) and is non-existent among Catholics ([Equation or mathematical symbol available in the original paper PDF] b = -0.23).
Table 3: Religion-Based Activity and Assortative Socializing Model 1 Model 2 Model 3
Table available in the original PDF paper.
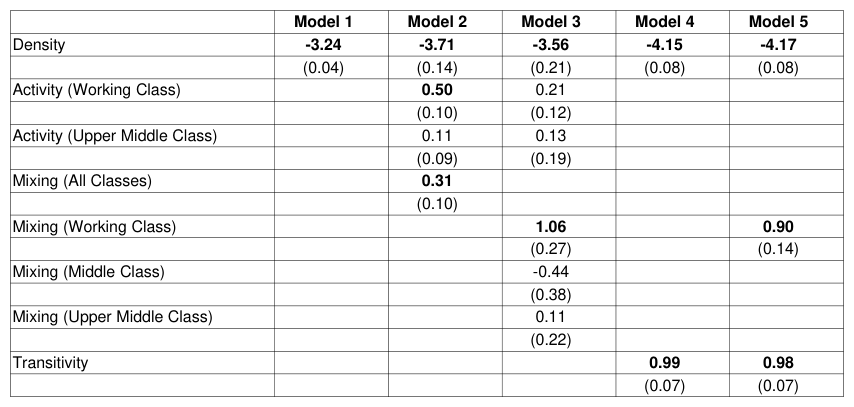
Class Background We find that (Table 4, Model 3) there are no activity differences based on class background, once we adjust for the statistical propensity to find class-matched edges over class mismatched ones. In our data, we coded class background as follows: first generation college students were coded as working class, students with only one parent who had completed college were coded as middle class, and students with both parents having completed college were coded as upper middle class.
Looking at the assortative mixing effects, we find that the statistical propensity to match class is restricted to individuals who share a common background as working class ([Equation or mathematical symbol available in the original paper PDF] b = 1.06). Neither middle class nor upper class students display any tendency to form ties disproportionately with members of the same class group. Note that the working class affinity effects persist even after adjusting for the tendency towards transitivity.
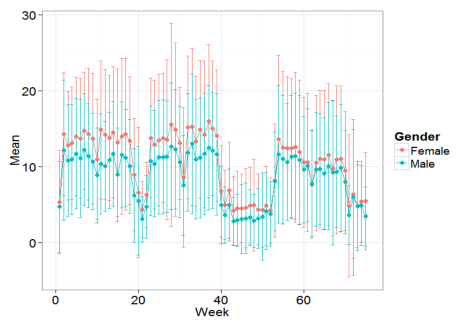
Also of interest is time evolution of network activities for difference classes of agents, classified according to their personality, gender and race. The resulting diagrams, shown in Figure 6, provide also range of differences between the respective classes of agents as well as trends in time. The strong personality, race, and gender effects on active network size of students after joining the university evolve differently. As shown in Figure 6, race effects persist through the observation period but gender effects decline.
Figure 6. Race, and gender effects on active network size.
High-School Social Networks We also used a set of social networks (high-school friendship networks), which were provided by the National Longitudinal Study of Adolescent Health (Add Health)1. The high-school friendship networks investigated here were constructed from a paper-and-pencil questionnaire in the AddHealth project (Moody, 2001). Here, nodes represent students and edges represent mutual relations or friendships. Two students are considered to be friends and have an edge between them when one nominates the other as her/his friend and both of them participated in some activities, e.g., talked over the phone, spent the weekend together, etc., in the last seven days. We selected ten largest high school networks consisting of 20,020 students in total from the available data set.
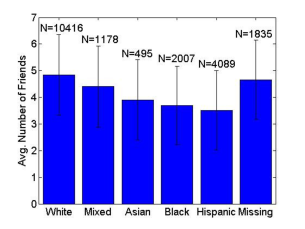
Figure 7. Race effects on active network size and asymmetric friendship in high-school networks. The effects are strong for large asymmetry (4 edge weight units) but small from small imbalance (3 or less units).
Figure 7 presents the results. We observed (see left panel of Figure 7) similar race effects on active network size for high-school networks as reported above for the US university student network. In addition, we used strength of interactions between friends that were self-reported by each student at the level from 1 to 6 to denote their weighted friendship edges. We define friendship as asymmetric with difference x when a student assigns the strength of the 1 This research uses the network-structure data sets from Add Health, a program project designed by J. Richard Udry, Peter S. Bearman, and Kathleen Mullan Harris, and funded by a grant P01-HD31921 from the National Institute of Child Health and Human Development, with cooperative funding from 17 other agencies. For data files contact Add Health, Carolina Population Center, 123 W. Franklin Street, Chapel Hill, NC 27516-2524, (addhealth@unc.edu, http://www.cpc.unc.edu/projects/addhealth/. Cross-Cultural Decision Making (2019) friendship to his friend by x levels higher that that friend assigns to this student. The center panel in Figure 7 shows that race has strong effect on asymmetric friendships with difference 4 but this effect disappears when the level of asymmetry decreases (the right panel of Figure 7 shows asymmetry with difference 3). Since asymmetric friendship shows commitment to a friend against opinions of others, we believe that this is a good indicator of willingness of a person to commit to an opinion, and the results presented indicate that such willingness could also vary across the cultures.
CONCLUSIONS
In this paper, we first presented a theoretical model of spread of opinion in social networks. In this model, we demonstrated that in the presence of committed agents, the committed minority of society members can rapidly spread their opinion to the entire society if the number of such committed minority members is large enough. There is a critical fraction of the committed minority which enables such a rapid spread and below it, the spread is extremely unlikely. We then identified properties of network agents that impact the value of the tipping point fraction. First, we showed that the tipping point fraction decreases as the average connectivity of an agent decreases from the highest level (fully connected graph) to lower values, when each agent is connected to only a few other nodes. Then, we investigated how changing commitment of the agents to their opinion influences the tipping point fraction. We used the binary agreement model tipping fraction as the baseline for comparison, since the commitment in this case is infinite, meaning that no finite number of interactions with agents holding the opposite opinion will convince a committed agent to abandon the opinion to which it is committed. We then showed that as a result of waning commitment, the critical fraction is increased over the baseline value, and that this increment grows as the number of interactions required to erode commitment decreases. These theoretical results raise the question of whether the differences in the interconnectivity and commitment are culturally or socio-demographically dependent. To answer this question, we first studied a real-time network of freshmen in a US university and observed and quantified the evolution of students' activity network and their level of assortative mixing over their first semester at university. We observed the large differences both in activity and assortative mixing between groups classified by personal, gender and race criteria. Then we analyzed highs-school social networks for average number of friends and the willingness to maintain asymmetric friendship. We found that both of these metrics are race dependent. The later one increases as the imbalance of friendship increases. We believe that maintaining strongly imbalance friendship against opinions of others is indicative of willingness to commit to an opinion. Thus, the immediate conclusion is that the different groups of students analyzed in our paper will likely respond differently to new opinions and ideas, and they might be differently receptive to innovation and new products.
In the future works, we plan to extend our study of real social networks in two directions. First, we want to study the level of asymmetric interactions that demonstrate commitment to weak ties against the objective evidence. Next, we want to extend the geographical scope of the network to include students from different countries and cultures including those not nested within the US. Finally, we plan to extend the study of these networks by tracking spread of opinions among them.
ACKNOWLEDGEMENT
This work was supported in part by the Army Research Laboratory under Cooperative Agreement Number W911NF-09-2-0053, by the Office of Naval Research Grant Number N00014-09-1-0607, and by the Army Research Office Grant Number W911NF-12-1-0546. The views and conclusions contained in this document are those of the authors and should not be interpreted as representing the official policies, either expressed or implied, of the Army Research Laboratory or the U.S. Government.
REFERENCES
Aral, S., Muchnik, L., & Sundararajan, A. (2009), "Distinguishing influence-based contagion from homophily-driven diffusion in dynamic networks", Proceedings of the National Academy of Sciences, 106(51), 21544-21549. Barabási, A.-L., & Albert, R. (1999), “Emergence of scaling in random networks”, Science 286, 509–512. Baronchelli, A., Loreto, V., & Steels, L. (2006), “Sharp transition towards shared vocabularies in multi-agent
systems”, J. Stat. Mech. P06014. Castellano, C., Fortunato, S. & Loreto, V. (2009). “Statistical physics of social dynamics”. Rev. Mod. Phys. 81, 591-646. Dall’Asta, L., Baronchelli, A., Barrat, A., & Loreto, V. (2006), “Nonequilibrium dynamics of language games on complex networks”, Phys. Rev. E 74, 036105. Durlauf, S.N. (1999). “How can statistical mechanics contribute to social science?”, Proc. Natl. Acad. Sci. USA 96, 10582-
10584. Galam, S. (2008), “Sociophysics: A Review of Galam Models”. Int. J. Mod. Phys. C 19, 409-440. Granovetter, M. (1973), "The strength of weak ties", American journal of sociology, 78(6), 1360-1380. Hachen, D., & Lizardo, O. (2013), “The effects of individual traits on the formation of social networks among first-year college students”, International School and Conference on Network Science (NetSci), Copenhagen, Denmark. Hunter, D. R., Handcock, M. S., Butts, C. T., Goodreau, S. M., & Morris, M. (2008), "ergm: A package to fit, simulate and
diagnose exponential-family models for networks", Journal of Statistical Software, 24(3), nihpa54860. Lu, Q., Korniss, G., & Szymanski, B.K., (2009), “The Naming Game in social networks: community formation and consensus engineering”, J. Econ. Interact. Coord. 4, 221. McPherson, M., Smith-Lovin, L., & Cook, J. M. (2001), "Birds of a feather: Homophily in social networks", Annual review of
sociology, 415-444. Moody J (2001), "Race, school integration and friendship segregation in America", American Journal of Sociology 107:679–716 Newman, M. E. (2003), "Mixing patterns in networks", Physical Review E, 67(2), 026126. Robins, G., Pattison, P., Kalish, Y., & Lusher, D. (2007), "An introduction to exponential random graph p* models for social networks", Social networks, 29(2), 173-191. Simmel, G., & Hughes, E. C. (1949), "The sociology of sociability", American Journal of Sociology, 254-261. Strogatz, S.G. (1994), Nonlinear Dynamics and Chaos: with Applications to Physics, Biology, Chemistry, and Engineering. Da
Capo Press. Szymanski, B.K., Sreenivasan, S., Xie, J., Zhang, W., Emenheiser, J., Kirby, M., Lim, C., & Korniss, G. (2012), “On influence of committed minorities on social consensus”, Proceedings of the NATO RTO HFM-201 Specialists Meeting, Tallinn, Estonia, April 16-18, 2012, pp. 32-1 – 32-15. Verma, G., Swami, A., & Chan, K., (2012), “Effect of zealotry in the naming game model of opinion dynamics”,
MILCOM 2012, pp.1-6, IEEE Computer Science Press. Verma, G., Swami, A., & Chan, K. (2014), “The impact of competing zealots on opinion dynamics”, Physica A 395, 310-331. Xie, J., Sreenivasan, S., Korniss, G., Zhang, W., Lim, C., & Szymanski B.K. (2011), “Social consensus through the influence of committed minorities”, Phys. Rev. E 84, 011130. Xie, J., Emenheiser, J., Kirby, M., Sreenivasan, S., Szymanski, B.K., & Korniss, G. (2012), “Evolution of opinions in
social networks in the presence of competing committed groups”, PLoS ONE 7(3):e33215. Zhang, W., Lim, C., Sreenivasan, S., Xie, J., Szymanski, B.K., & Korniss, G. (2011), "Social influencing and associated random walk models: Asymptotic consensus times on the complete graph", Chaos 21(2):025115. Zhang, W., Lim, C., & Szymanski, B.K. (2012), “Analytic treatment of tipping points for social consensus in large random
networks”, Phys. Rev. E 86, 061134.
LISTED IN THE AHFE DIGITAL BOOKSTORE CATALOGUE
Explore the complete digital volume
Advances in Cross-Cultural Decision Making
Read this individual research paper free through the original publisher, or explore the full digital proceedings book.
ISBN 978-1-4951-2095-4
Explore this ISBN in the AHFE Bookstore ↗Listed in the July 2026 bookstore catalogue; search by ISBN to confirm current availability · Digital book purchase optional