Benedict Wohlers, Jan Strüwer, Felix Schreckenberg, Felix Barczewicz, Stefan Dziwok (2022). A Domain-independent Model for KPI-based Process Management. In: Production Management and Process Control. AHFE Open Access, vol. 36, pp. 70–81. https://doi.org/10.54941/ahfe1001621
Monitoring, assessing, and improving company processes is one of the most important and challenging tasks of management. Key Performance Indicators (KPIs) are a well-established means of assessing and managing company processes and performance. In previous publications, we transferred the concept of KPIs to mechatronic products. Here KPIs are calculated based on data generated within the production process. Thus, the KPIs provide information about the current condition of the production process and produced products and enable efficient product and process control. The basis of this approach is a KPI model, which enables the specification of company-specific products, product-specific KPIs, and limits. By structuring the KPIs as a hierarchical system, company goals can be expressed at different levels of abstraction through the KPIs and their limits. Thus, goals are assessable for stakeholders at all management levels, which eases communication and reporting. Furthermore, the hierarchical approach allows for a high degree of transparency regarding the monitored processes and potential bottlenecks. Underperforming KPIs can be explained in more detail by diving into subordinated KPIs, utilizing the provided hierarchy. In this paper, we present a revised, domain-independent version of our KPI model. The revised model allows the definition of company-specific processes, products, and data sources that can be linked to the KPIs. In addition, mechanisms have been implemented to add additional parallel or hierarchical company-related levels, such as teams or company sites. To illustrate this, we show the application of the model in two different domains: Supply chain management and software development. For supply chain management, we consider the supply of parts in the material procurement of a manufacturing company. To ensure smooth production, it is essential that the right components are available and, thus, the so-called Seven-Rights of logistics are guaranteed. At the same time, high availability with other target variables is tangential to high logistical efficiency in a company's procurement and production. In this paper, the component availability is considered as top-level KPI, which consists of subordinated KPIs such as the delivery quantity reliability or the delivery time announced by the supplier. Thus, increased component availability can be achieved and further information, such as supplier quality, can be derived and utilized.For software development, we utilize the KPI model to assess and guide a company's DevOps transformation. DevOps was inspired by agile approaches to manage and improve production processes, such as Lean or the Toyota Way. The DevOps transformation is difficult for most companies, as each company may have different reasons and goals associated with it. Some companies aim to increase their software deployment rate, while others focus on software stability and quality. To support companies with this complex task of changing their development process, as well as parts of their organization's culture, a flexible and unique model is needed. In our example, a DevOps maturity index, based on performance, quality, and organizational KPIs is introduced using our KPI model. Based on this index, the status of the DevOps transformation is monitored and the next steps for the transformation can be derived.
Monitoring, assessing, and improving company processes (including their performance) is one of the most important and challenging tasks of mana- gement. One well-established means for these tasks are Key Performance Indicators (KPIs). However, until now, in many domains, KPI models had to be defined from scratch for each company resp. use case. This can be time- consuming and error-prone. In this paper, we present a domain-independent hierarchical model for KPI-based process management. It is based on our previous publications (Wohlers et al., 2017 and 2020), which introduced the concept of KPI-based condition monitoring for production processes. In our model, the KPIs are structured in a hierarchical system and aligned with orga- nizational levels of the company to express company goals at different levels of abstraction. Thus, the goals are assessable for stakeholders at all levels of management. Furthermore, the hierarchical approach allows for a high degree of transparency regarding the monitored processes and the identifi- cation of potential bottlenecks. To illustrate the domain-independence and adaptability of our approach, we show the application of the model in two different domains: supply chain management and software development.
FOUNDATIONS AND RELATED WORK Process-oriented thinking is nowadays widespread in both industry and rese- arch. It is associated with management in many fields of application. Some
A Domain-independent Model for KPI-based Process Management 71
examples of process-oriented thinking include Business Process Management (BPM), Total Quality Management (TQM), Lean, Six Sigma, Operations Management, and Supply Chain Management (SCM). A widely used appro- ach in these fields is the Plan-Do-Check-Act cycle (PDCA) (Deming, 1986, Defeo and Juran, 2010). In the “Plan” phase, control subjects are identi- fied, and goals are defined. Next, in the “Do” phase, the process is executed and monitored. Subsequently, the process or its results are assessed in the “Check” phase. In the final “Act” phase, the process or actuator is adjusted, and corrective actions are taken.
KPIs are the means of choice to express corporate goals and make them assessable and actionable. For example, (Wannes and Ghannouchi, 2019) present a KPI-based business process improvement approach. They propose the extension of the BPMN meta model (OMG, 2010) with a hierarchic set of KPIs that mirrors the process structure. Using a prototype, they validated their approach at a software development company to improve its SCRUM process. However, they pointed out that their approach is still not generalized enough to improve business performance processes. At present, it is unclear whether this approach is applicable across domains.
Another example of KPI utilization in managerial use cases is ISO 22400, which defines thirty-four KPIs for manufacturing operations management (MOM). The norm introduces a KPI data model and depicts an example of a hierarchical KPI network structure. However, the model is defined for MOM with its predefined KPIs. Thus, it is not directly applicable to other domains. Contrary to us, the model lacks the linkage of KPIs with issues, causes, and solutions. Furthermore, it does not enable to define environmental influe- nces that can affect KPI ranges. Additionally, the norm defines relations and dependencies within a second model for its specific KPI instances, while we only use one model to improve traceability and understandability.
Another related work is the Supply Chain Operations Reference (SCOR) model (APICS, 2017). Among others, it defines a hierarchical process model for SCM and provides metrics for the description and evaluation of supply chain performance. The metrics cover five different performance attribu- tes and are hierarchically linked across three levels. Performance attributes define different strategic directions. The SCOR model defines metrics for each performance attribute to evaluate all SCM process stages. Furthermore, it equates Level-1 metrics with KPIs. According to the SCOR model, Level-1 metrics diagnose the general health of the supply chain with respect to the assigned performance attribute. Subordinate metrics diagnose the health of the respective higher-level metrics and assist in root cause analysis. Thus, the hierarchical approach of the SCOR model is very similar to ours. However, it is limited to the domain of SCM. Furthermore, we believe that not every metric is a KPI, but that every KPI incorporates at least one metric. More precisely, a KPI combines a calculated value with a limit, whereas a metric calculates a value without further context. Accordingly, while the SCOR model defines calculation rules, it does not specify how the metrics should be incorporated into the evaluation of supply chain performance. Further- more, our approach provides a predefined data model that, among others, links limits with issues, causes, and solutions to enable automated process
control. Nevertheless, the metrics defined within the SCOR model, are a very valuable input for the definition of our domain-specific KPI system for supply chain management in one of our case studies.
KPI-BASED PROCESS MANAGEMENT In previous publications, we introduced KPIs for mechatronic systems and a KPI-based approach for condition monitoring of production processes (Woh- lers et al., 2017, 2018, and 2020). Since then, we have revised the KPI-based approach to make it domain-independent. Thus, this section presents the new concept of KPI-based process management. First, we introduce the general concept and highlight the differences to the definition of KPI-based condition monitoring. Secondly, we present the fundamental data model.
General Concept When implementing KPI-based condition monitoring for production proces- ses, the definition of three elements stands out: the system, its functionalities, and the KPIs, which assess the functionalities. Systems and KPIs are hie- rarchically defined and, thus, provide a high degree of transparency of the monitored systems resp. process. Reasons for an underperforming KPI can be identified by examining the subordinate KPIs. Note that the process itself is not part of the underlying data model. Thus, superordinated KPIs combine system-specific KPIs, to allow the assessment of the production process.
The core idea of KPI-based process management is the representation of activities in a company as interrelated processes, as proposed in the ISO 9000 series. When we first applied our approach to another domain, we found that the absence of the process within the data model severely limited its expres- siveness. Additionally, we realized that the model element functionality often led to confusion. Furthermore, we observed that in addition to system and process, there are other levels of abstraction that need to be considered in the assessment. This includes, among others, teams, departments, or com- pany sites. Therefore, we suggest a new KPI definition for KPI-based process management that combines data from the process or from specific parts of the process with expert and domain knowledge. In this way, a statement about the status of the process or a specific part of the process can be made based on the KPI and its reference value. Each KPI assesses different aspects of a process and can provide recommendations for improvement if the KPI devi- ates from its reference value or exceeds its limits. Note that a KPI can assess any level of abstraction within a company, from process to company site, to department, to product.
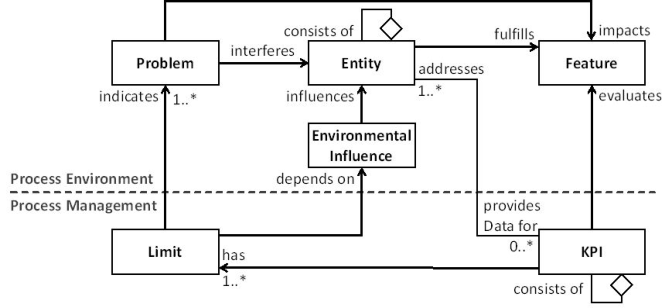
Data Model KPI-based process management has two fundamental elements: The data model and the procedure for identification and specification of KPIs. A domain-specific version of the procedure was presented in a previous publi- cation (Wohlers et al. 2020). In this paper, however, the focus is on the data model and its domain-specific adaptability. Figure 1 illustrates the core parts of our data model for KPI-based process management in a simplified UML
A Domain-independent Model for KPI-based Process Management 73
Figure 1: Hierarchical data model for the KPI-based Process Assessment class diagram (we provide the entire model on GitHub (Fraunhofer IEM, 2022)). Within the model, we focus on two different aspects of the company: (1) The Process Environment represents the company as processes and pro- cess participants, (2) The Process Management represents company goals, which combine assessment criteria with tolerance areas for the managed processes.
In the Process Environment, we define a hierarchical arrangement of Entities. Entities replace the systems from the previous model. An Entity represents any organizational or physical part of the company, such as, but not limited to, company, site, process, department, product, or data sou- rce. Company-specific hierarchy levels can contain Entities of different kinds, where leaf entities usually represent data sources. Note that we do not impose a strict tree structure for the Entity hierarchy: An Entity may have multiple parent Entities. Furthermore, we compile additional information on Entities useful for automated process assessment: Environmental Influences influe- nce the behavior of an associated Entity. Note that the behavior of Entities, however, is not modeled directly, but an Entity may provide Features that rea- lize its behavior. Features replace the functionalities from the previous model. A Problem can interfere with an Entity of any hierarchical level and, thus, may impact an associated Feature of the Entity. Each Problem is composed of three elements: An Issue, a Cause, and a Solution. These elements did not change compared to our previous model.
In the Process Management, we define a hierarchical arrangement of KPIs, analogous to the Entity hierarchy described above. A KPI represents an Entity-specific company goal. Therefore, the KPI hierarchy mirrors the entity hierarchy, with KPIs relating to the Entity assigned to the company goal. A KPI aggregates data provided by Entities (mostly data sources) and/or subor- dinate KPIs and may assess individual Features of an associated Entity. Note that the hierarchical design of our data model allows KPIs of the same type to be aggregated across multiple levels. A KPI assesses its respective company goal using Limits. Limits represent acceptable value ranges for the underlying company goal. They consist of an Expected Value, at least one Bound, and a Category such as WARN or ERROR. A violated Bound of a Limit indicates
a Problem, that interferes with the behavior of the Entity. Remember that Environmental Influences change the expected behavior of the associated Entity and, thus, the acceptable value range of the company goal. Therefore, a KPI can be associated with multiple Limits that depend on Environmental Influences.
CASE STUDIES In this section, we present two case studies where we have successfully applied our approach of KPI-based process management. The two case studies are from completely different domains. First, we demonstrate the application of our KPI-based approach to support the SCM. Second, we illustrate the potential of the KPI-based approach in the domain of software development.
A KPI System for Supply Chain Management This case study focuses on an exemplary manufacturing company with a sup- ply chain with external suppliers as well as globally distributed production sites.
Background and Definitions The basic task of SCM is to plan and control the flow of materials, informa- tion, or money along the supply chain from the component’s point of origin to the final point of demand. Additionally, SCM also considers the relations between the actors along this chain (Werner, 2017). One goal of SCM is to shorten order lead times, which improves customer satisfaction. This may be achieved with harmonized production and capacity control. Another goal is cost reduction through the reduction of inventories and associated storage costs, while avoiding out-of-stock situations (Koch, 2015). This kind of situ- ations occur when materials are needed, or finished products are ordered but are not available. Ideally, continuous material availability eliminates produ- ction downtime due to out-of-stock-situations. Material availability not only affects the process stage in which the materials are required (i.e., production), but also has an impact on other process steps along the supply chain. Among others, there is an impact on material sourcing, and supplier management. In addition, the strong volatility of market or demand must be considered since the required demand quantity is originated by it.
We introduce the top-level KPI Supply Chain Health (SCH), to enable the company to monitor the status of its supply chain. SCH combines multi- ple subordinate KPIs that assess individual sections of the supply chain, e.g.: Supply Performance (SP), Production Performance, Distribution Performa- nce, and Planning Performance. Each KPI can be determined either globally or site-specifically. In the remainder of this section, we focus on SP and some subordinate KPIs (we provide the entire KPI system on GitHub (Fraunhofer IEM, 2022)). SP assesses the material flow as well as the material availability at the production sites.
In our case study, we assume a supply chain network which has a main pro- duction site in Germany and other supplying production sites owned by the company but distributed globally. All production sites are supplied by various
A Domain-independent Model for KPI-based Process Management 75
national and international external suppliers. However, due to different and cascading production steps, it may also be the case that the production site abroad is supplied by the main production site. In this case, after some value- adding production steps, the components are delivered back to the main production site. This loop-like flow of materials between production sites is known as the problem of parts tourism. It becomes a practical challenge when parts required at one site are currently stored at another site or must be delivered to other warehouses or sites. As a result, the material availability depends significantly on the performance of material flows between the sites, as well as on the performance of external suppliers. Note that the company’s production efficiency is significantly influenced by material availability.
KPI System for Material Supply Management In the following, we present the application of our KPI-based approach to address the problem of parts tourism with SP. SP assesses the performance of suppliers and supply processes within the supply chain network. Consi- dering the issue of parts tourism, poor supplier performances can jeopardize regulating processes within and between production sites. As a result, out-of- stock situations can occur that lead to irregularities in internal traffic and can, thus, permanently delay downstream processes. To calculate SP, we analyze the supply chain regarding all incoming deliveries at the production sites. Most of the relevant data can be provided by an ERP system. This data is used to calculate KPIs that are subordinate to SP. Below, we highlight some of those subordinate KPIs that are partly inspired by the SCOR:
Perfect Order Fulfillment (POF) is a level-1 metric of the SCOR model. However, unlike the SCOR model, we use POF to describe how many orders resp. deliveries are fulfilled by the supplier without defects. Internal and external deliveries can be considered separately for the calculation of POF. We subdivide the calculation of POF further into subordinate KPIs, like Errors-in-Orders (rate of returned products due to defects) and On- Time-Delivery (rate of deliveries that arrived on time). POF can also be equated with supplier reliability, a term commonly used in the literature (Muchna et al., 2020).
Delivery Flexibility (DF) indicates the extent to which a supplier can pro- cess unplanned orders or deliver already placed orders earlier to respond to possible demand peaks or low-quality materials. The order cycle length, which indicates the time span between order entry and goods receipt (compare source cycle time in SCOR model), is one of the inputs for the calculation of DF. Another input is average excess capacity, which descri- bes the likelihood that the supplier will be able to meet our short-termed demand.
Sourcing Costs (SC) includes all costs incurred in the sourcing of materials. This does not include the actual costs of these sourcing goods (purch- ase prices). But it considers costs, like, costs to receive delivery, costs to manage suppliers, and costs to transfer received goods. This KPI helps us to monitor the sources of process costs in the supply (compare cost to source in SCOR model).
Due to our hierarchical approach, we can assess external and internal sup- plies individually using two instances of SP: External Supply Performance and Internal Supply Performance. These KPIs can be combined in a higher- level instance of SP, the KPI Overall Supply Performance, which itself can be part of SCH. Furthermore, other aggregations of SP are possible depending on the use case.
Controlling the Material Supply Using the KPI System Using our hierarchical KPI system, we have the potential to prevent or detect material flow problems, such as parts tourism, before they can cause major process inefficiencies. The high-level KPIs provide a good overview of the current condition of the supply chain. If the condition of one of these KPIs is not as expected, its subordinate KPIs can be analyzed to narrow down the concern more precisely. This makes it easier to perform the PDCA cycle. The KPI system makes it possible to identify problematic areas, e.g., if the overall condition of the supply chain steadily deteriorates. For example, the company can be enabled to identify bad shipments that are not noticed in normal day-to-day operations. This can address the inefficiencies of parts tourism by triggering continuous improvement. If causes and solutions are defined and linked to an issue within the KPI system, it is even possible to derive automated measures to solve the according problem.
Evaluation We developed the presented KPI system as part of the research project it’s owl MOVE and presented it to a company as part of the process. The pro- cess owners in the company’s controlling and supplier management agreed that many of the suggested KPIs are either used in the current ERP system or have been evaluated in a somewhat comparable way in the past, e.g., for sup- plier evaluation and selection. However, the alignment with the established business processes as well as the hierarchical connection of the KPIs within the KPI system offers significant additional value. In this way, the company’s responsibilities can easily identify relationships, dependencies, or difficulties. On the one hand, a previously unavailable transparency of the processes and process participants is created. In this context, a graphical representation of the data in the form of a dashboard would be appropriate to provide a quick and clear overview of the current state of the supply chain. On the other hand, there is a lack of data necessary to calculate every suggested KPIs. Instead, the individual employees make many decisions based on their experience. As the research project progresses, we will assess ways to collect the necessary data that has not yet been collected, as well as how to integrate the data into the KPI system and how useful it is. Nevertheless, our KPI system already offers the possibility of good scalability. It includes KPIs and metrics from the SCM domain, e.g., from the SCOR model, but allows use case-specific adaptations of the KPI system.
A KPI System for DevOps Maturity in Software Development Within this section, we explain how our KPI-based process management supports software developing companies in their DevOps transformation.
A Domain-independent Model for KPI-based Process Management 77
Background and Definitions DevOps is a development culture inspired by agile approaches to manage and improve production processes (Womack et al., 1990, Toyota Motor Coo- peration, 1998). The transformation towards DevOps is difficult, as each company may have varying reasons and goals associated with it. For exam- ple, some companies aim to accelerate their software deployment rate, while others focus on software stability and quality. Furthermore, a crucial aspect of DevOps is the continuous improvement of all processes involved in a product’s development. Therefore, the process of adopting DevOps is never ending and companies need to continuously monitor the process to verify whether the changes increase or decrease their performance. To support com- panies with this complex task of continuously changing their DevOps process as well as parts of their organization’s culture, a unique flexible model is needed.
We use the concept of KPI-based process management to calculate a DevOps Maturity Index (DOMI). DOMI forms the top-level KPI of our KPI system and is a single value indicating the current state of DevOps in a company. It aggregates multiple subordinate KPIs from multiple areas, e.g., performance or quality. Based on DOMI, a company can monitor the status of the DevOps transformation and verify whether the ongoing changes lead to improvements, following the PDCA cycle.
In the following, we focus on one high-level KPI and some of its subordi- nate KPIs (we provide the entire system on GitHub (Fraunhofer IEM, 2022)). The focused high-level KPI is Technical Debt (TD), which is a subordinate KPI of DOMI. It is based on performance and quality related KPIs. The meta- phor technical debt has been introduced even before the concept of DevOps was developed (Cunningham, 1992). It describes the practice of prioriti- zing short-term benefits (often an earlier release date of new features) over doing things right from the start. These short-term decisions result in an ever- growing backlog of maintenance tasks that the team cannot handle. Increased technical debt makes it more difficult to make changes to the product or to add new features. Thus, development times are reduced, sometimes up to the point where software is redone, because changing or even running it becomes infeasible.
KPI System for the Assessment of Devops Maturity In the following, we present an excerpt of our KPI system. As previously mentioned, the focus is on TD and some of its subordinate KPIs. Technical debt occurs in many different areas of software development, for example on an architectural level or in actual code, as described in (Kruchten et al., 2012). Additionally, there can be problems in underlying company processes or company culture, which can lead to an increase in technical debt. Some causes and effects of technical debt are easy to see, like decrease in develo- pment speed or increase in bugs. Other aspects are more subtle and harder to detect, such as the amount of unplanned work developers face during the development of a feature.
We utilize the hierarchical structure of our KPI system to reflect the multi- layered aspects of technical debt. We measure data from different systems
involved in the development and operations process and observe how the people inside the organization interact with them. The insights generated from these measurements are combined with insights taken from the code base itself to calculate an overall score for TD. To calculate TD, we analyze a products lifecycle. We take data from different areas of development into account as subordinate KPIs, e.g.:
Development Focus (DF) is an organizational KPI, which reflects how many context switches developers have during feature development, and how much time they spend on different ticket types e.g., bugs and fea- tures. DF is based on Developer Spread and Developer Focus, which are calculated independently.
Pull Request Complexity (PRC) is a technical KPI, which is based on the size of the request as well as the number of unique files changed.
Coupling of Components (CC) is a technical KPI, which supports the identification of application parts that are tightly coupled. Highly coupled code is harder to change.
Time Idea to Market (TIM) is a performance KPI that is calculated based on information about tickets and their tags. It combines different time stamps: creation date, start date, merge date, and release date.
Release Cycle (RC) is a performance KPI, which takes the release dates and relates them to the commit frequency, to measure how regularly releases occur.
Combined, these KPIs form TD according to their calculation rules. The main advantage of this process is that it provides the users with a maximum of transparency regarding the reasons for an underperforming KPI. If the TD exceeds the defined KPI limit, users can further investigate by diving into the subordinate KPIs to precisely isolate the problem in the development process.
Guiding the Devops Transformation Using the KPI System The hierarchical KPI system excels most when trying to understand the cur- rent state of DevOps in a company and providing recommendations on how to improve it. At the top level, DOMI provides a single indicator for the company’s overarching state. By observing its trend, one can easily determine whether the company is improving.
Traditional maturity models for DevOps (Zarour et al., 2018) also provide a single rating of the current state. However, our approach has the advantage of providing complete transparency regarding the reasons for the rating. By traversing the hierarchy of KPIs, users can determine the exact reasons of an underperforming KPI. This is where our approach particularly benefits from the various levels of abstraction. Our KPIs, such as TD, can be calculated at different abstraction levels, e.g., repository, project, or enterprise. There- fore, the KPIs enable the assessment and comparison of different or identical internal DevOps processes as well as their resulting products In theory, following the ideals of DevOps should lead to reduced technical debt. Therefore, we monitor the trend of TD over time as an indicator of the company’s improvement in their DevOps transformation. If the processes
A Domain-independent Model for KPI-based Process Management 79
improve, the decrease of TD should be observable. The hierarchical setup further enables companies to better understand the changes they make to their DevOps process, since they can traverse the hierarchy and easily identify the KPIs influenced by the changes.
Evaluation We evaluated the idea of applying KPI-based process management to the domain of DevOps in interviews with multiple domain experts from different software developing companies. Additionally, we presented our approach at the DevOps World 2021 to receive feedback from both industry and research (Strüwer, 2021). The overall feedback has been positive and has motivated our further efforts.
Additionally, we started a prototypical implementation of a KPI-based DevOps management tool. We plan to use the prototype for first evaluations. The prototype will analyze open-source projects to exemplarily evaluate the KPIs we presented above. Therefore, it queries data from GitHub and uses it for KPI calculations. GitHub serves as a version control system, a ticket system, a build server, and a deployment platform all in one. This makes GitHub a good base for evaluation.
CONCLUSION AND FUTURE WORK Our concept of a KPI-based process management allows companies to express their goals in the form of a hierarchical KPI system that ensures clear comprehensibility regarding the company’s goals at various levels within the company. In addition, the hierarchical linkage of KPIs allows for maximum transparency and explainability in the event of a KPI not meeting expectati- ons. Using two case studies, we have shown the modeling and management capabilities of our approach. Furthermore, the two case studies covering very different domains underline the domain-independence of our approach. In the area of SCM, the KPI-based approach offers the possibility of an easy control of processes and a quick identification and explanation of problems. In the area of software development, our concept enables to assess and con- trol DevOps processes based on the data generated by the development tools already in use.
A weakness of the KPI-based approach is the dependence on expert kno- wledge during modeling. In addition, defining issues, causes, and solutions linked to KPIs to automatically propose solutions has proven to be challen- ging so far. Therefore, we plan to explore the use of AI and data analytics approaches in future work to address these challenges. We are currently in talks with different companies to apply analytics approaches on their data to learn issues, causes, and solutions. Subsequently, the insights gained will be abstracted and incorporated into our KPI system. As mentioned before, KPI- based process management is based on two key elements: the data model and the procedure for identification and specification of KPIs. Currently, this procedure is domain-specific. However, we intend to make this proce- dure domain-independent. An important first step in this direction will be the definition of a domain-independent KPI catalog. This catalog will offer
companies an easy entry into KPI-based process management. For this pur- pose, we plan to analyze KPIs of different domains for similarities to identify and abstract domain-independent KPIs. The definition of expected values and limits for the KPI catalog will also be a major challenge. However, the introduction of a domain-independent KPI catalog should aid here as well. Companies that adopt KPI-based process management will have the oppor- tunity to define their own KPI system based on the catalog and to adjust predefined expected values and limits of the catalog.
ACKNOWLEDGMENT
Parts of this research were funded by the Ministry of Economic Affairs, Inno- vation, Digitalization and Energy of the State of North Rhine-Westphalia (MWIDE) in the context of the Leading-Edge Cluster it‘s OWL and supervi- sed by Project Management Jülich (PtJ). Further parts of this research were funded by the BMBF Software Campus Program.
Available from: http://www.apics.org/docs/default-source/scor-training/scor-v12- 0-framework-introduction.pdf?sfvrsn=2 [accessed 14 February 2022]. Cunningham, W. (1992). The WyCash portfolio management system. ACM SIG- PLAN OOPS Messenger, 4(2), 29–30. Deming, W. E. (1986). Out of the Crisis. MIT Center for Advanced Engineering
Study. Cambridge, MA. Defeo, J. A., Juran, J. M. (2010). Juran’s Quality Handbook: The Complete Guide to Performance Excellence 6/e. McGraw Hill Professional. Fraunhofer IEM (2022). Data Model for KPI-based Process Management [online].
Available from: https://github.com/fraunhofer-iem/kpi-data-model [accessed 14 February 2022]. Fraunhofer IEM (2022). KPI System for KPI-based DevOps Transformation [online].
Available from: https://github.com/fraunhofer-iem/dodo-kpi-system [accessed 14 February 2022]. Fraunhofer IEM (2022). KPI System for KPI-based Supply Chain Management [online]. Available from: https://github.com/fraunhofer-iem/move-kpi-system [accessed 14 February 2022]. Koch, S. (2015). Einführung in das Management von Geschäftsprozessen: Six Sigma,
Kaizen und TQM. Berlin, Heidelberg: Springer Vieweg. Kruchten, P., Nord, R. L., Ozkaya, I. (2012). Technical debt: From metaphor to theory and practice. Ieee software, 29(6), 18–21. Muchna, C., Brandenburg, H., Fottner, J., Gutermuth, J. (2018). Grundlagen der
Logistik. Wiesbaden: Springer Gabler. OMG (2010). Business Process Model and Notation – BPMN [online] Available from: https://www.omg.org/spec/BPMN/2.0/About-BPMN/ [accessed 14 Febru- ary 2022]. Strüwer, J.-N (2021). Doing Optimal DevOps - Evidence-based Guidance to Your
DevOps Journey [video online]. Available from: https://www.cloudbees.com/ videos/evidence-based-guidance-to-your-devops-journey [accessed 14 February 2022].
A Domain-independent Model for KPI-based Process Management 81
Toyota Motor Corporation (1998). The Toyota Production System – Leaner manufacturing for a greener planet. Tokyo: TMC, Public Affairs Division. Wannes, A., Ghannouchi, S. A. (2019). KPI-Based Approach for Business Process
Improvement. Procedia Computer Science, 164, 265–270. Werner, H. (2017). Supply Chain Management: Grundlagen. Strategien, Instrumente und Controlling, Wiesbaden: Springer Gabler. Wohlers, B., Dziwok, S., Bremer, C., Schmelter, D., Lorenz, W. (2017). Improving
the product control of mechatronic systems using key performance indicators. DEStech Transactions on Engineering and Technology Research, (icpr). Wohlers, B., Dziwok, S., Pasic, F., Lipsmeier, A., Becker, M. (2020). Monitoring and control of production processes based on key performance indicators for mechatronic systems. International Journal of Production Economics, 220, 107452. Wohlers, B., Dziwok, S., Schmelter, D., Lorenz, W. (2018). Improving Qua-
lity Control of Mechatronic Systems Using KPI-Based Statistical Process Con- trol. International Conference on Applied Human Factors and Ergonomics, pp. 398–410. Womack, J. P., Jones, D. T., Roos, D. (2007). The machine that changed the world: The story of lean production. New York: Simon and Schuster. Zarour, M., Alhammad, N., Alenezi, M., Alsarayrah, K. (2019). A research on
DevOps maturity models. Int. J. Recent Technol. Eng, 8(3), 4854–4862.
LISTED IN THE AHFE DIGITAL BOOKSTORE CATALOGUE
Explore the complete digital volume
Production Management and Process Control
Read this individual research paper free through the original publisher, or explore the full digital proceedings book.
ISBN 978-1-958651-12-4
Explore this ISBN in the AHFE Bookstore ↗Listed in the July 2026 bookstore catalogue; search by ISBN to confirm current availability · Digital book purchase optional