Qiaochu Liu, Wen Gao, Ziyu Huang, Weixin Huang (2022). 3D modeling Logs Based Design Process Mining Method and Its Application for Design Education. In: Training, Education, and Learning Sciences. AHFE Open Access, vol. 59, pp. 56–64. https://doi.org/10.54941/ahfe1002384
Computer aided 3D Modeling design software has an important role in today's design industries from wide range of areas on various project stages. In previous design studies on architectural design process, the conclusions were always draw upon data from like textual records, pictorial representations, interviews, and semantic coding, which inevitability own shortcomings of subjectivity, laboratory-based data, and not fully controlled environment variables. In response to the above problems, we turn to another kind of data possibility: the event logs generated from 3D modeling software platform during computer aided design process. Since each step of design operations is recorded in the event logs, the design behavioral sequences can be fully tracked. A method for design process study is hence developed based on event logs mining. With quantitative, objective and tractable characteristics, the method can help studying the problem-solving process of designers in CAD environment and summarizing design cognition conclusions. In this paper, we attempted to apply this method to a real college course in the School of Architecture at Tsinghua University. More than 100 junior students major in architecture participated in the course. Rhinoceros 3D(Rhino) was chosen as the CAD tool in this study for its popularity and wide-use in architecture and design educations. By building up a data recording plug-in in Rhino, our proposed method realizes digital supervision and data collection for the entire designer modeling design process, allowing students as researches to extract information including operational command name, command time, 3D object generation information, designer annotative and retrospective records and etc.. The method and this developed plug-in tool can automatically record and filter the large amount of data generated in 3D modeling process, which simplifies the data collection process, improves the quality of the data, and provides a new kind of data source and research method for the study of design process in CAD environment. Our course-based case study lead to some interesting conclusion and provides window for students to understand and perceive the design process through data mining based on event logs.
Computer aided 3D Modeling design software has an important role in today’s architectural industry. Besides hand-drawing, the use of modeling tools to develop the design is now more and more common. In a review of exi- sting research in the field of design cognition (Laura et al., 2020), the design cognitive data is primarily obtained from empirical protocol studies, such as the collection of verbal, video and/or sketch-based protocol data. These data sources inevitably have limitations of being difficult to repeat, controlled in specific conditions, and susceptible to accidental errors. Although some new data analysis tools (e.g., artificial intelligence algorithms) have been incre- asingly used in this field of research recently (Ashrafganjouei, M. & Gero, J.S., 2021), the sources of raw data are still mainly from the traditional ones mostly with dozens of samples. As many design processes are nowadays per- formed by humans through the operation of computers, their design behavior can be retained in the computer as syslog data, which becomes a new data source possibility. In the mining of syslog data, existing studies (Zhang, L. & Ashuri, B., 2018.) mainly focus on BIM systems. Data mining for the early design stage of conceptual design has not yet received extensive attention.
To address these issues, we extract the event log data from the Rhinoceros 3D modeling software to study designers’ inferential thinking process at early
3D Modeling Logs Based Design Process Mining Method 57
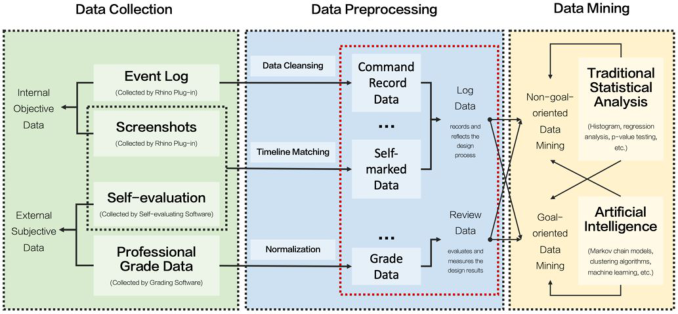
Figure 1: Procedure of the newly developed approach.
design stage, and form an approach to find the correlation between the design behavior and design results.
This study aims to construct and propose a new possible data type and a new research method for studying design behavior, which has the advantages of reproducibility, large sample size, cross-validation, and the ability to pro- duce repeatable, accumulable, and extrapolatable knowledge, thus providing a valid and reliable reference for design study.
Due to the obvious human-computer interaction nature of this research method, the results of this study are expected to provide a research basis for the development of theories and procedures in the field of intelligent design. This approach also offers a new pedagogical possibility for archi- tectural design. And an attempt to study the relationship between students’ design process and their design scores through this approach will be presented later.
THE EVENT LOG DATA MINING METHOD This new research approach for design study is divided into three main parts: data collection, data preprocessing and data mining.
Data Collection Out of the reasons of the openness of the platform, the wide range of users and the common modeling software available on the market for architectural design, this study chose Rhinoceros 3D modeling software (hereinafter refer- red to as Rhino), developed by Robert McNeel & Assoc, as the platform for design modeling data collection, which is lightweight, compact and easy to use. The official open-source SDK tool from Rhino reveals much of the inner workings of this modeling software in detail, making it possible to extract the essential raw event log data for this study.
Accordingly, after choosing Rhino as the main platform for our study, we relied on the architecture teaching sessions and organized an open design competition to collect relevant design behavioral data from students.
Data collection through design competition ensures that research data is collected in a usual and sufficiently realistic and credible design scenario for students to ensure the quality of the data collected. The participants (students) were asked to read the assignment and complete an architectu- ral design in Rhino in a single person within 6 hours. The design time and task volume are similar to a common architectural conceptual design pro- ject. In this study, the design specification of the competition 2021 SMDC, hosted by the Key Laboratory of Eco Planning & Green Building, was used. Under the design theme of “Imagination of the future green building space: the ideal reading space.”, the participants were required to design a building with a total area of 1000~2000 square meters, reading space area of at least 70%, green landscape of at least 300 square meters, artistic natural light, high-performance wall and large-span light-structure.
When a participant starts the competition, a Rhino plug-in developed spe- cifically for this study is run simultaneously to collect the data produced during the participant’s design modeling process (i.e., event log data in Rhino) and the automatic screenshots of the modeling process. The raw data recor- ded includes detailed information on each step of the designer’s actions during the design modeling process, which could be converted into a standard for- mat for subsequent analysis after the data preprocessing steps. This part of the data is the internal objective data from the computer program.
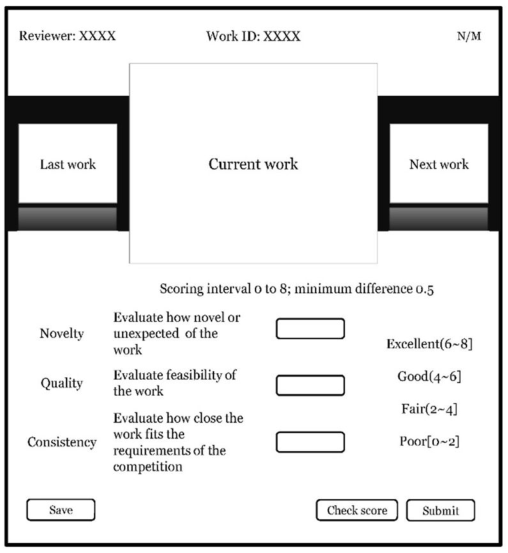
The other part of the data source in this study method is external subje- ctive data, recorded by non-computer systems. This part of data is entered subjectively by humans and can include things such as review scores, tex- tual annotations, participant’s self-evaluation, etc., depending on what topics the researchers want to study. For example, in the actual study case talked about later in this paper, data were collected specifically on the designer’s self-evaluation of the degree of design certainty and on the scoring of design creativity from students, teachers, and architects (collected through the software developed for this study; see Figure.2 for a general interface).
All of the above data were collected based on the requirement that the participant sign an informed consent form.
Data Preprocessing The internal objective data recorded by the Rhino plug-in and the external objective data entered by humans need to be converted by means of prepro- cessing into the kind of data ready for subsequent analysis. There are three main types of data preprocessing method: data cleansing, timeline matching, and score normalization.
Data cleansing is mainly for event log data, aiming at removing redun- dancy and errors and organizing them according to standards to form an easy-to-analyze data structure, which contains ID (participant number), Command Name (name of the operation command used), Start Time (time when the command started), Time Span (duration of the command), and In Command History (detailed operations and settings within the command).
Timeline matching is a cross-organization of automatic screenshot data and self-evaluation data: automatic screenshot data is a stream of screensh- ots of the entire design modeling process at 20s intervals, and the participant’s
3D Modeling Logs Based Design Process Mining Method 59
Figure 2: The judging program.Figure 3: An example of the command record data (after cleansing).
self-evaluation data is obtained by reviewing the photo stream and labe- ling his or her design intent at each stage. The content of the markups was determined according to the needs of the study, for instance, the self- evaluation data taken in our specific experiment was the degree of certainty of the students’ design intent at the current design stage (Mark1=certain, Mark2=partially certain, Mark3=uncertain) and their textual explanation.
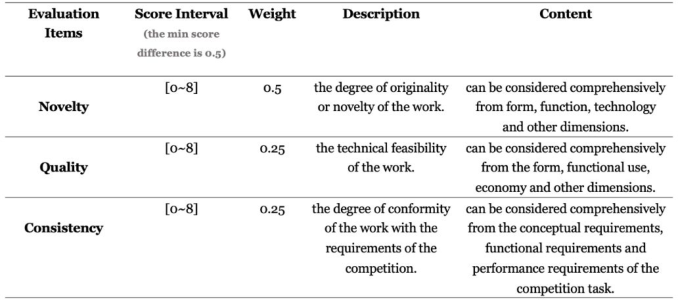
Score normalization is a preprocessing method for scoring data, which aims to transform the scoring data into a suitable quantitative form, and the specific strategy should be chosen according to the researcher’s objectives. Take the design creativity scoring data from this paper as an example: after the judges finish scoring according to the scoring requirements (see Figure 5), the corresponding total design creativity score Stotal is calculated according to the following formula Eq. (1) : Stotal = 0.5 · Snovelty + 0.25 · Squality + 0.25 · Sconsistency (1)
Figure 4: An example of the self-marked data (after timeline matching).Figure 5: The 3 evaluation items of design creativity score.
The raw data will be unified into CSV tables (see Figure 3,4) after the above data preprocessing steps. The preprocessed data can be categorized into two types: log data and review data; the former includes data to record and reflect the design process, such as event log data, while the latter includes data to evaluate and measure the design results, such as design creativity scores.
Data Mining There are 2 main strategies of data mining in this research approach: non- goal-oriented and goal-oriented. The former is to study the possible patterns in the design process by mining the mathematical correlations between dif- ferent types of data, while the latter is to first propose a specific research hypothesis or theoretical model, and then test whether the target hypothesis or model holds with the log data and review data.
Regardless of which strategy researchers choose, the data mining tech- niques used in this research method are common, which mainly include traditional statistical analysis and artificial intelligence-based data mining. The traditional statistical analysis uses basic statistical methods such as histo- gram, regression analysis, and p-value test to analyze data at all levels. This method can find potential connections and correlations between data and further provide the data support for existed empirical design theories and knowledge. Artificial intelligence-based data mining is a data mining pro- cess with the help of algorithms, such as Markov chain models, clustering algorithms, machine learning, etc.
3D Modeling Logs Based Design Process Mining Method 61
Effects on Education Architectural design and other artistic creation are often viewed as a black box, and how to design is therefore generally considered difficult to be tau- ght. Although design is a complex human consciousness activity, based on some existing research (Gao, W. et al., 2021), we have found that the data obtained from event logs can explain human design behavior to some extent, i.e., we can use this method to help designers to view and understand design from a new perspective. Especially for advanced students who have basic design skills, this research approach will hopefully help them better under- stand their design learning process and master new technologies in the field of architectural design.
THE CASE STUDY AT SCHOOL OF ARCHITECTURE, TSINGHUA UNIVERSITY The School of Architecture at Tsinghua University has set up two CAAD (Computer Assisted Architectural Design) courses for students since 2013 (one theoretical course and one practical course, each with 16 lessons), and the main data in this paper was collected from the CAAD practical course and the 2021 SMDC design competition. 2021 SMDC Design Competition officially took place from September 6 to 19, 2021, and participants would start their 6-hour modeling design competition on the competition day of their choice. Participants would receive the plug-in (RhinoRecorder.rhp) and activation key for this study via email at 8:00 on their chosen day. Once the plug-in was activated, the participant would be able to read the design speci- fications in Rhino, and the 6-hour timer would begin. When the participant finished the design, the plug-in would check whether the model objects have been placed into the corresponding layers as required, and then the plug-in would terminate and automatically export the data file as .data format. The participant would then import the previous .data file into RhinoRecorde- rEva.exe, another software provided by this research method, to remark their own design process and generate a new .data file for the final data submission.
The data used in the case study section of this paper only used data from students who participated in the CAAD practical course at Tsinghua Univer- sity during the summer semester of their 3rd year, instead of all participants in the 2021 SMDC competition. Because these students have high similarity in age, software use, and design background, and they all completed the design competition in the same classroom located in the School of Architecture at Tsinghua University. A total of 58 valid samples were eventually obtained.
15 participating students (divided into seven groups) further received full instruction on the event-log-based data mining method, and completed their own data mining work with the assistance of researchers’ guide. The results of two of these groups are briefly described below.
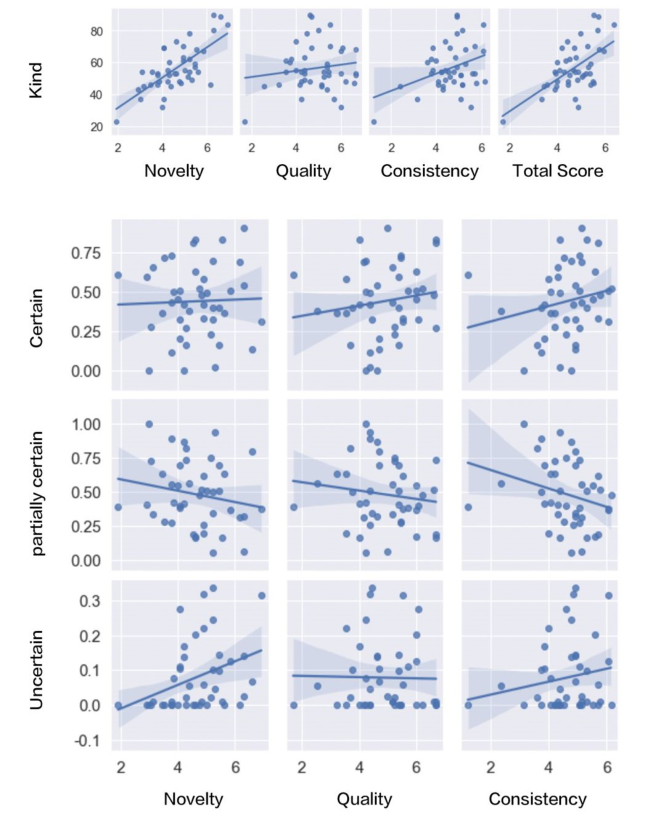
Case 1: Data Mining with Traditional Statistical Analysis In this case, students conducted a global statistical analysis between log data and review data (score data), from which they searched for correlations betw- een modeling commands used in the design process and the final design
Figure 6: Correlation analysis results (outcomes from CAAD course students).
creativity score. It was found that an increase in the number of operation types was significantly and positively correlated with the novelty and con- sistency scores, while the correlation between the degree of certainty of the design and the creativity score was weak.
After further searching the use of over 300 commands, students found that around 10 commands were significantly correlated with the participants’ scores. For example, if commands such as “Circle”, “Hide” and “SubD” were not used, the participants’ design creativity scores were not at the top. And this finding can be interpreted in the context of design experie- nce. The “Circle” command is necessary for curve modeling while “SubD” is a collection of commands related to curved surface modeling, which may
3D Modeling Logs Based Design Process Mining Method 63
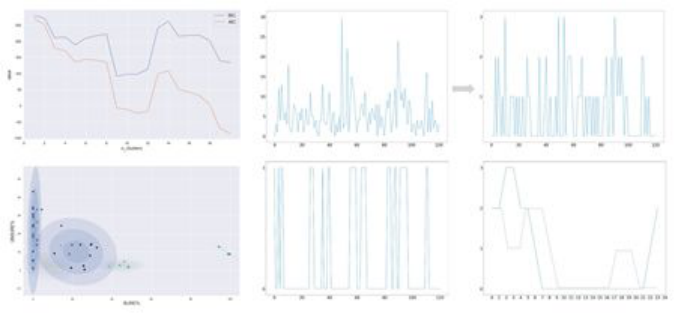
Figure 7: Clustering and decoding analysis results (outcomes from CAAD course students).
suggest that the ability to handle curved forms is an important factor lea- ding to high creativity scores. The “Hide” command is often used for more delicate models, and the absence of “Hide” may reflect the fact that the desi- gner’s design and model is quite simple and can be processed without hidden complex components.
Case 2: Data Mining Through Artificial Intelligence In this case, students performed a Gaussian Mixture Model (GMM) clu- stering analysis for the participants based on the self-labeled data of the participants’ design certainty. The participants were classified into 5 types based on Akaike Information Criterion (AIC) and Bayesian Information Cri- terion (BIC). Then an attempt was made to decode the mental states of the different types of participants from their design operations by using Hidden Markov Model (HMM). After establishing the parametric model, the Viterbi algorithm can be used to output the maximum possible sequence of mental states by inputting the sequence of operation commands during the design process of any of the participants. It is found that this model based on Hid- den Markov Chains can recognize, to certain degree, the mental states of different types of participants in their design process based on event log data (see Figure 7).
To sum up, we can see that the new research approach proposed in this paper is practical and effective, offering a new workable way to study design process in the field of architectural design, and benefiting students as well.
CONCLUSION
This paper proposes an approach for studying design Process and behavi- ors based on event log, which offers a set of tools and specific experimental methods for data collection and analysis. The feasibility of this approach was verified by applying this method to a teaching session of a course in the School of Architecture of Tsinghua University. And it is also initially confirmed that
the event log data correlates with human ideation, which indicate that this data can reflect the design process of designers. In the future, we hope that this approach could be applied to more research on design studies and ergo- nomics, which may provide new possibilities for study in many fields such as human-computer interaction, intelligent design, and design education.
ACKNOWLEDGMENT
This work is supported by the National Natural Science Foundation of China [grant No. 52178019].
REFERENCES
Ashrafganjouei, M. & Gero, J.S. (2021). Exploring the effect of a visual constraint on students’ design cognition. Artificial intelligence for engineering design, analysis and manufacturing, 35(1), pp. 3–19. Gao, W. et al (2021). A data structure for studying 3D modeling design behavior
based on event logs. Automation in construction, 132, p. 103967. Laura Hay, Philip Cash & Seda McKilligan. (2020). The future of design cognition analysis. Design Science, 6, pp.Design Science, 2020–01-01, Vol. 6. Zhang, L. & Ashuri, B. (2018). BIM log mining: Discovering social networks.
Automation in construction, 91, pp. 31–43.
LISTED IN THE AHFE DIGITAL BOOKSTORE CATALOGUE
Explore the complete digital volume
Training, Education, and Learning Sciences
Read this individual research paper free through the original publisher, or explore the full digital proceedings book.
ISBN 978-1-958651-35-3
Explore this ISBN in the AHFE Bookstore ↗Listed in the July 2026 bookstore catalogue; search by ISBN to confirm current availability · Digital book purchase optional