Artis Riepnieks, Harold Kirkham (2023). Improving Trust in Power System Measurements. In: Human Factors and Simulation. AHFE Open Access, vol. 83, pp. 192–200. https://doi.org/10.54941/ahfe1003577
The power grid is a large and complex system. The system becomes larger and more complex daily. Distributed energy resources and a more active customer role are factors adding to the complexity. This complicated system is operated by a combination of human operators and automation. Effective control of the power grid requires an increasing amount of automation to support system operators. The need for more support from automation can only increase as operational complexity increases.Actions in controlling the system are entirely dependent on the results of measurements. Measurements inform decisions at all scales. How much trust can be placed in the measurements is essentially an unknown factor. North American Electric Reliability Corporation has generated reports showing that procedures and models have not always worked as expected. Part of the problem lies in the fact that system events can distort signal waveforms. Another part of the problem is that events taking place outside the control area of an operator can affect measured results. The companies involved, and their regulators, have had to change their requirements and guidelines.High “accuracy” measurements are available for most quantities of interest, but the problems are related to trustworthiness, rather than “accuracy.” Accuracy is established for a device within a controlled environment, where a “true value” can be estimated. Real-world conditions can be vastly different. The instrument may provide accurate output according to its specifications, but the measurement might not represent reality because what is happening in the real world is outside the bounds of these specifications. That is a problem that demands a solution. The crux of the matter is this: a real-world measurement’s usefulness as a decision-making aid is related to how believable the measurement is, and not to how accurate the owner’s manual says the instrument is. The concept of “uncertainty” that metrologists have refined over the last few decades is a statistical process that predicts the dispersion of future results. Such a measure is virtually meaningless for real-time power system use. The properties of the power system are not stationary for long periods. A low-quality result can lead to a bad decision, because power system measurements presently lack any kind of real-time “trustworthiness connection.”The signal model generally used in the electric power industry is that the voltages and currents are well-represented by mathematical sinusoids. Given that starting point, we describe two trust metrics that provide verifiable links to the real-time system being measured. The metrics capture any mismatch between the instrument measurement model and the actual signal. Our trust-awareness metrics can lead to ways to develop more robust operating models in the power system environment. Every measurement result is reported with an associated real-time trust (or no-trust) metric, allowing the user (whether human or not) to assess the usefulness of the result. It is, of course, up to the user to determine how a low-quality result should be used in decision-making. Examples of real-time trust metric calculations during real power system events are provided, with evaluation for application in utility user scenarios.
Measurements have been an essential part of the management of the electric power system from the very beginning. Surprisingly, today’s measurements are not particularly trustworthy. To see how this situation arose, it will be useful to see the way the electric power grid grew to its present size and complexity almost independently of the development of measurements, and of systems engineering. Once these features are appreciated, we can examine their impact.
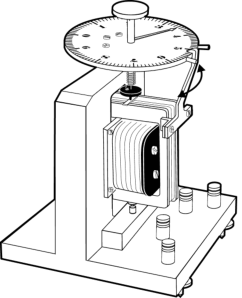
The first AC system in the US, was installed in 1886. To get an idea of the relatively simple state of instrumentation at the time, consider Figure 1, a manually-adjusted zero-reading instrument. This kind of scheme was still in use when the voltage reached over 50 kV early in the 20th century (Seiler, 1916). Measurement theory grew more slowly. For example, scales of measure- ment were not formalized until 1946 (Stevens, 1946). By then, power system voltages had increased to over 250 kV. While the physical plant was growing in power and extent, measurements were still based on electromagnetic tech- nology. Newer instruments differed from the instrument in Figure 1 mainly in that they were direct-reading.
To improve reliability, power engineers developed a system they called “protection.” In communications, protection had meant the provision of an alternate path. In power, it came to mean disconnecting something to ensure
Figure 1: An early multi-purpose instrument, the electrodynamometer.
safe operation, given the large amount of energy available in the event of a fault. The alternate path was planned for, but only if it was justified eco- nomically, which generally was not the case in the low-voltage distribution system.
As the system grew, it became increasingly important to operate it eco- nomically and reliably. Operation of the system in the “normal” state was managed by a network of “system operators,” usually working as a team in a control room owned by a utility. As the daily load cycle increased and decreased the power needed, generators were taken on and off the system according to a complicated economic order. The power to the load was bala- nced with generation by maintaining the frequency at some chosen value. The frequency indicated the overall state of balance between load and gene- ration. Separate communications was required so that the voltage and the power flowing down different lines around the system could be monitored (and adjusted) by system operators.
Various requirements were levied without ever being formally viewed as requirements. Crucially, the protection system was required to operate largely without communications, which was viewed as a source of unreliability. Pro- tection was also required to operate with all due speed—meaning no human interaction. It was completely autonomous.
As the capabilities of computers advanced, they were increasingly used in utility control rooms. Nowadays the wall displays of the system status are computer-generated displays. And smaller computers replace the electrome- chanical equipment performing the calculations required in protection.
While these advances in system operation and protection were taking place, significant advances in measurement theory and systems engineering were mostly not being communicated to the power engineering community. Yet more automation was needed as the system became more widespread, and faster responses were needed as energy levels in the system increased.
MEASUREMENTS AND AUTOMATION IN DECISION MAKING All measurements are made to inform a decision. Whether that decision is simply to raise a voltage someplace or to build a new power line costing many
194 Riepnieks and Kirkham
millions of dollars, the result of the measurement must be trustworthy. For two reasons, this aspect of measurement has not become part of the thinking of the power engineering community. The historical background tells us why.
First, electromagnetic measurements tended to be somewhat “forgiving.” The mass of the moving parts “smoothed out” small fluctuations in indi- cation. Used within their specified limits, they were reliable, too. Power engineers came to trust them implicitly. For example, some time around 1960, a device called a “watt transducer” was marketed. It was wired up to the system via the usual isolation transformers, and a DC voltage emer- ged, proportional to the power being observed. Several papers about them were written by the user community before anyone thought to explain how they worked. They were simply trusted.
Second, until about 1995, almost all of the measurements made in the power system were of the operational kind. The quantity being measu- red was not defined, as might be expected of a “scientific” measurement: instead, the method of measurement was specified. Such a measurement can- not be accompanied by a statement of uncertainty: provided the measurement procedure has been followed correctly, the result is (by definition) accurate.
The Phasor Measurement Unit, which has been widely deployed since the 2003 blackout in the American north-east, is the first large-scale applica- tion of a representational measurement, to which a statement of uncertainty should be attached. Power engineers did not (and mostly still do not) recognize the difference in the nature of the measurement, and are quite unconcerned that their measurement results now demand an uncertainty statement. Instead, they are just trusted.
The bottom line is that we build mathematical models to make sense of reality (the power system in this case), and we perform measurements to validate our models. If the measured values track with the models, we believe that the model is a good representation of reality.
Blindly trusting the measurements to reveal the truth and generate trust for models is not a good idea. In (Kirkham & White, 2022), we see that measurements themselves are based on models (measurement models) and therefore are subject to trust issues. This is particularly true when the signals being observed deviate from the norm, as we shall see next. Knowing that a particular measurement should not be trusted is valuable information that should be used to inform decisions.
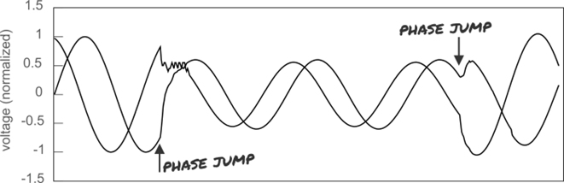
Example of Misplaced Trust: The Blue Cut Fire In the summer of 2016, a fire got started in the countryside to the east of Los Angeles. The burning undergrowth produced smoke, and the smoke produ- ced a conductive path between two phases of a high-voltage power line. The proper response to such an event is for the power line to be disconnected (quickly) by the protection system, and to be reconnected after a short while. The time allowed for disconnection depends on the voltage-class of the line, and for the lines affected by the fire, which got named the Blue Cut fire after the name of a local trail, the time to disconnect was a couple of cycles of the AC system. Figure 2 shows the waveform captured by a digital fault recorder in the area.
Improving Trust in Power System Measurements 195
Figure 2: Waveform near Blue Cut fire.
The effect of the fault was to cause the two phases to be shorted together. At the location of the recorder, their voltages were not quite the same, but each experienced an abrupt change, indicated here as a phase jump. As expected, the situation returned to normal after two cycles as the fault was cleared by the protection system.
The sequence of events became quite well-known because a nearby solar photovoltaic plant disconnected from the system. Its protection system, operating rapidly and autonomously, calculated that the frequency was out- side acceptable limits. The disconnection caused the abrupt loss of nearly 1000 MW of power. The North American Electric Reliability Corporation (NERC), with responsibility for the reliability of the bulk energy system in the US, thou- ght that the solar plant should not have disconnected. (NERC, 2017). Solar and wind generators are generally connected to the grid by DC/AC inver- ters (they are known as inverter-based resources or IBRs), and the Blue Cut fire triggered the inverter protection. The reconstruction of the Sequences of Events that lead to large blackouts is in their purview. And they make rules to improve reliability. In the case of the Blue Cut fire events, their reaction raises interesting questions about human factors in a rather esoteric way.
Ruling Over the Science?
An IEEE standard requires an inverter-based resource to “continue to operate normally” for a certain amount of time (actually 299 s) in the case of a fault. The applicable documentary standard (Committees on Energy Development & Power Generation, 2022) levies the requirement that “Frequency shall be calculated accurately including appropriate filtering...” The designer of a protection system is entitled to ask what the meaning of the term “frequency” is when the waveforms of the system are distorted in the way that they are in Figure 2. The designer of the control system is entitled to ask what “normal” operation means when the system voltage at the terminals is like those shown in Figure 2.
Legal metrology is the branch of science that deals with establishing con- sistency and fairness in measurements. The authors of this paper speculate that these matters will not be solved until legal action ensures that the human factor and system engineering notions of clarity, unambiguity, and testability are successfully applied to the demands of the standard.
196 Riepnieks and Kirkham
Requirements for Future Measurement Systems in the Electric Grid The implementation of the power grid is set to change dramatically as more power is generated by remotely located renewable generation. The growing need for automated control systems means that measurements are expected to play a key role. We see that the measurements of the future need to be:
Fast. Renewable generation uses inverters to connect to the grid. The num- ber of these inverter-based resources means that the grid dynamics will get very fast. Some protection systems may require reaction times of 2 ms or faster (Dagle & Shoenwald, 2021).
– Challenge: This means that there is little time to doubt measurement quality, as it is needed for use immediately.
Compliant with FAIR principles (GO FAIR, 2022): measurement results should be Findable, Accesible, Interoperable, and Reusable. The appropri- ate resources must be spent on the process throughout the lifecycle, from installing instrument transformers, to requiring operating power, commu- nications equipment, and storage space. In spite of the up-front costs, FAIR data are cost-effective because many applications and systems can use the same measurement systems.
– Challenge: each measurement system is usually optimized for specific use in an application.
Trustworthy. Measurement must be trustworthy enough for its intended use. The trust level should be assessed at the source of the measurement, so that the trustworthiness metric can be used in all downstream applications to improve decision-making.
– Challenge: Assessing trust at the source of the measurement imposes some requirements (digital measurements, certain computing power, etc.) and potential changes in communication protocols and applicati- ons.
From the Blue Cut Fire example, we see that we cannot simply expect the future power system to behave well. We will have to model the power system over a wider frequency range than just the 50 or 60 Hz of the fundamen- tal. Designers of control schemes and protection schemes will be obliged to understand the effects of higher-frequency currents and voltages.
We are at the point where the demand for good and fast measurements is rising rapidly for more automated control designs. These designs have alw- ays been operated by “trusting” that the measurement system is a perfect “transducer,” always telling the truth about the real-world conditions.
But measurement is not made by “transducers,” they are just a small part of the system. To build trust in automated solutions for the grid, we must first create an unbroken chain of checks and balances from the real-world domain to the conceptual. Two trust metrics are proposed as an attempt to achieve a part of that.
Improving Trust in Power System Measurements 197
Assessing Trust in Measurement Results During faults, waveforms are distorted, and measured results become untrustworthy. Whether the measurement is representational or operational, the algorithms in the instrument are based on the assumption that some “rea- sonable” conditions apply. The waveforms in Figure 2 are not well-described by the sinusoid that normally applies to the voltage in the power system. Even the concept of frequency does not apply, since an idea that underlies “frequency” is periodicity. The waveforms are not periodic.
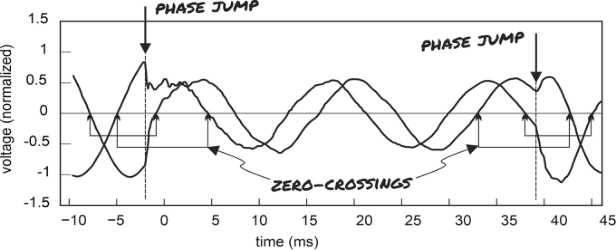
If the off-nominal condition can be detected early, often the best thing to do is to assume that the power system is going to restore normal operation rapidly. The example of Figure 2 shows restoration in a couple of cycles. Figure 3 shows that, during the fault, the zero crossings of the waveform suggest the system frequency was not changing. As the phase-jumps occur and then reverse, the zero-crossings of the two waves are changed, and the change is then reversed.
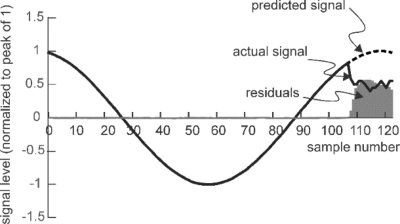
This sort of condition can be detected in near real-time by looking at the residuals obtained by fitting a pre-determined sinusoid to the actual (distor- ted) waveform. The system obtains the parameters for the attempted fit by continuously measuring the waveforms with a phasor measurement unit (Phadke & Thorp, 2008). This device gives a value for the amplitude, the frequency, and the phase at a time designated as zero by standards based on UTC. This phase is often called the “phase offset.”
The values from the previous measurement are then used to compare the real-time signals. An example is shown in Figure 4. The “predicted” signal values are obtained from the time preceding the event shown.
Figure 3: Blue Cut waveform highlighting zero-crossings.Figure 4: Residuals in Blue Cut example.
198 Riepnieks and Kirkham
The observed (faulted) waveform differs from the predicted signal (shown as a dashed line) as soon as the fault occurs. After just a few samples, the residuals are approximately as large as the observed signal: a sure sign of trouble! We have proposed using this method of evaluating the trustwor- thiness of results as a warning flag, a “No-Trust” metric, in (Kirkham & Riepnieks, 2021).
Obtaining no-trust metric information at the point of measurement allows immediate performance improvements in various grid applications, such as the state estimation algorithm. A state estimation (SE) algorithm relies on redundant information to reject bad measurements. But the execution takes time. If some measurements are flagged as bad as soon as they are made, the SE eliminate them upfront. The state estimator’s job, and thus the system operator’s job, become a little simpler.
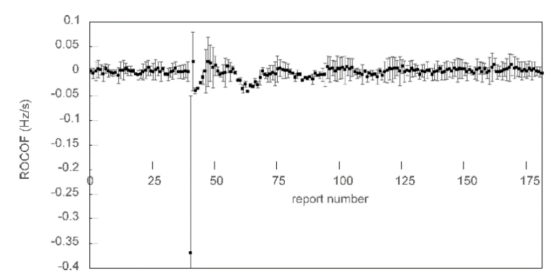
A Trust metric, indicating trustworthiness in a manner akin to the error bars on a graph, can also be generated at the point of the measurement. For this, the residuals between the actual signal (not a predicted signal) and a measurement model (the sinusoid) with “best fit” parameter values is used. Figure 5 gives an example of the rate-of-change-of-frequency measured during a generator-drop event, with error bars created from residuals much smaller than those in Figure 4. Details are in (Kirkham & Riepnieks, 2021).
Figure 5: Proof of concept result for error bars on rate of change of frequency measurement.
ESTABLISHING TRUST IN HUMAN-OPERATED MODELS Shortly after lunch on August 14, 2003, the operator of a generator, Eastlake 5 in Ohio, attempted to raise the voltage, overloaded the exciter, and tripped the generator. Shortly after that, three 345-kV lines in the vicinity relayed out. They were heavily loaded and sagging into trees because of the power redistribution that took place when the generator tripped. The stage was set for a blackout.
Each of these trips was quite appropriate, but together they began an unfortunate sequence of events. Throughout the afternoon, other lines in an increasingly large area were overloaded and tripped out. Shortly after 4:00 pm another 345-kV line was lost. By 4:15 pm, about 50 million people were without power.
Improving Trust in Power System Measurements 199
The operator at FirstEnergy, the Ohio company responsible for the Eastlake generator, recognized a problem of lack of voltage support very early on. But as the number of outages increased throughout the afternoon, nobody was aware of the magnitude of what was happening. The NERC report (NERC Steering Group, 2004) describes a situation in which an opera- tor in one company would call another, and ask for voltage support. Nobody suggested shedding some load so as to allow the generators to achieve the voltage support needed.
As the number of lines disconnected increased, and the problem spread, the operators at the PJM system (covering the states of Pennsylvania, New Jersey and Maryland, on the east side of the Ohio area) and American Electric Power (AEP) to the west, lacked any established way to solve a problem occurring at their border.
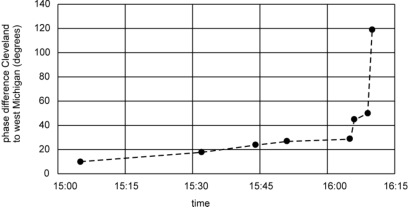
Figure 6 shows that the blackout was fairly slow to develop for an hour or so, but in the end, the cascade of events was too fast for any operator action to effect recovery.
Figure 6: Phase angle, Cleveland to West Michigan (NERC steering group, 2004).
Like the actions of an airline pilot in an emergency, the actions of a power system operator rely on experience, their mental model, and the instructi- ons manual. And, of course, the measurement data that is available to them. Operators are trained to respond to a large number of contingencies. But the number of continencies present as the events of the blackout unrolled consi- derably surpassed the number that anyone had been trained for, or that were represented in the manual.
Instead of saying “Infra-red level is high. Temperature rising. Smell of smoke,” the data system has to be able to say “Fire!”
DISCUSSION
Driven mainly by NERC, new steps are being taken to address the problem of blackouts and particularly the issues associated with IBR management. The Federal Energy Regulatory Commission (FERC) is starting to address the need for better (broader-band) modeling of the power system.
The system must inevitably be increasingly automated. But it will rely on human intervention for the foreseeable future. In the end, improvements will come down to this: better information (rather than more data) is needed for the operators.
200 Riepnieks and Kirkham
CONCLUSION
While we cannot yet make all measurements trustworthy, we can at least know how much to trust some of them. When the measurement conditions are not like the ones assumed in the design of the instrument, the users of the measurement results should be notified immediately. For many grid applica- tions there will not be enough time to assess measurement quality centrally, so a distributed, real-time quality metric is a clear choice.
The trust metrics we have described will allow threshold-value criteria to be established for measurement handling in grid applications. They will give the operators, via their instrumentation, real-time information on how much they can “trust the numbers.”
We speculate that broad-brush system-wide and inter-system models could provide reliability coordinators and system operators with the kind of situational-awareness view that could help to put an end to large blackouts. Well-trained operators could likely use this kind of information expressed graphically to prevent the system from “going critical”. Tools built on resou- rces such as this could be made routinely available to reliability coordinators in the power system.
ACKNOWLEDGMENT
PNNL is operated for the U.S. Department of Energy by Battelle under Con- tract DE-AC05-76RL0 1830. This work was supported in part by the US Department of Energy, Office of Electricity.
REFERENCES
Committees on Energy Development & Power Generation, E. M. (2022). IEEE Std 2800–2022. New York: IEEE. Dagle, J., & Shoenwald, D. (2021). Electricity Transmission System Research and
Development: Automatic Control Systems. Office of Electricity, US Department of Energy. GO FAIR. (2022). FAIR Initiative. Retrieved from https://www.go-fair.org. Kirkham, H., & Riepnieks, A. (2021). A Proposed Quality Metric PNNL 31118.
Richland, WA: PNNL. Kirkham, H., & Riepnieks, A. (2021). The Blue Cut fire PV trips: the need for a no-trust metric. PNNL-31119. Pacific Northwest National Laboratory. Richland, WA: PNNL. Kirkham, H., & White, D. (2022). The Physical Meaning of Reactive Power and
Distortion Power. Proc Int Instr & Meas Tech Conf (I2MTC). Ottawa. NERC. (2017). 1, 200 MW Fault Induced Solar Photovoltaic Resource Interruption Disturbance Report. Atlanta: NERC. NERC Steering Group. (2004). Technical Analysis of the August 14, 2003, Blackout:
What Happened, Why, and What Did We Learn? Princeton, New Jersey: NERC. Phadke, A., & Thorp, J. (2008). Synchronized Phasor Measurements and their Applications. New York: Springer. Seiler, E. (1916, June 1). A Study of the Electrodynamometer. Thesis for Master of
Arts in Physics. Urbana-Champaign, IL, USA: University of Illinois. Stevens, S. (1946). On the theory of scales of measurement. Science, 103, 677–680.
LISTED IN THE AHFE DIGITAL BOOKSTORE CATALOGUE
Explore the complete digital volume
Human Factors and Simulation
Read this individual research paper free through the original publisher, or explore the full digital proceedings book.
ISBN 978-1-958651-59-9
Explore this ISBN in the AHFE Bookstore ↗Listed in the July 2026 bookstore catalogue; search by ISBN to confirm current availability · Digital book purchase optional