Ji-yeon Kim, Ki-hwan Kim, Young Jin Kang, Seok Chan Jeong (2024). Securing Worker and Heavy Equipment Safety in Shipyards: A Study on Collision Prevention AI Systems. In: Human Systems Engineering and Design (IHSED2024): Future Trends and Applications. AHFE Open Access, vol. 158, pp. 239–249. https://doi.org/10.54941/ahfe1005547
Accidents between heavy machinery and workers frequently occur in shipyards, leading to severe casualties. To address this issue, this study developed and evaluated an AI-based collision prevention system that can enhance safety between heavy machinery and workers in shipyards. We utilized the shipyard environment in Korea to train an AI model with GPS data from workers and key heavy machinery. The AI model demonstrated the ability to predict collisions with an accuracy exceeding 90% during tests. This research suggests the potential for innovative improvements in safety management in shipyards and anticipates more advanced results with future on-site applications.
Accidents in shipyards worldwide continue to pose serious safety issues. On November 25, 2022, a gantry crane accident at a shipyard in Guam resulted in initial injuries, and later, on December 2, fatalities were confirmed (Irene Ang, 2023). Within shipyards, various issues arise due to the presence of heavy machinery, and one of the most urgent issues to address is the collision between heavy machinery or between heavy machinery and workers. The characteristics of heavy machinery, such as difficulty in making sudden stops and limited visibility, make it challenging to respond to workers who suddenly appear around corners. To address this issue, research has been conducted on IoT-based danger zone alert systems using Zigbee-based beacon technology and cellular mobile communication technology to prevent workers from approaching dangerous areas (Kim et al., 2019). Additionally, studies have been carried out on helmets equipped with multiple sensors to detect accidents and alert managers to dangerous situations (Woo-Yong Choi et al., 2022), as well as on safety equipment platforms that allow workers to access location information and sensor data attached to equipment through wearable devices (Chan-Woo Bang & Bong-Hyun Kim, 2022).
In this paper, we conducted a study using PECNet to predict the movements of workers. The training data utilized GPS data of workers from industrial sites, and by predicting pedestrian paths based on past routes, it is expected to prevent safety accidents.
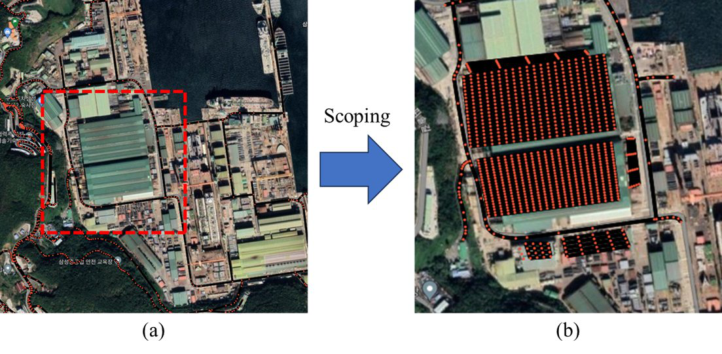
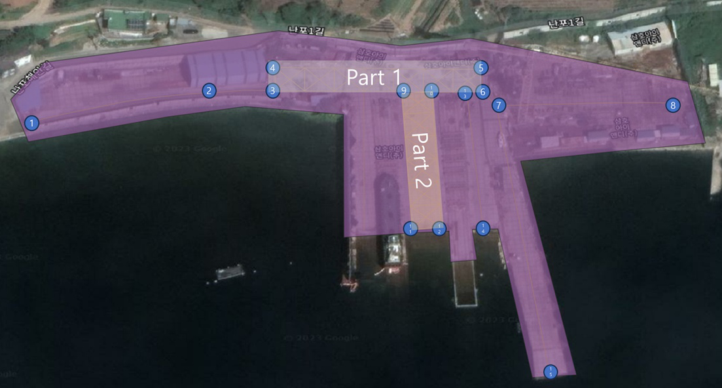
SUGGEST IDEA This study conducted data collection and analysis to prevent collisions between workers and heavy equipment such as forklifts, trailers, and transporters in shipyards. Shipyards, being complex environments with numerous heavy equipment and personnel working simultaneously, require thorough data collection to create a safe working environment. We specifically attached GPS sensors to various heavy equipment, including forklifts, cranes, and trailers, and collected real-time location data through them. The actual acquisition environment was conducted on a test field measuring 3.4 km by 2.3 km, as shown in Fig. 1. In industrial sites, where multiple workers and heavy equipment are present, we assigned IDs to both workers and heavy equipment based on the time the paths were recorded to store the data. If the time difference between two consecutive paths, i.e., the previous path and the next path, is significant, it is likely that the data were generated by different workers, thus they were differentiated. The collected data underwent a preprocessing step, including outlier removal to address signal interference and other technical issues. In this paper, this heavy equipment will be collectively referred to as TP (Transporters).
Figure 1: Environmental information retrieval for data generation, (a) work road network represented by OSMNX, (b) satellite photo and OSMNX network combined.
The raw path data attributes of the TP (Transporters) collected before applying the path prediction learning model are shown in Table 1. The ID attribute represents the unique ID of each TP. Since multiple TPs are used at industrial sites, each TP’s path data was recorded with an assigned ID to
Securing Worker and Heavy Equipment Safety in Shipyards 241
distinguish them. GPS coordinates were used to record the locations of the TPs, and the reception time indicates when each TP’s location was recorded.
Table 1. On-site collected data attribute information.
Table available in the original PDF paper.
Cases Explain Example ID Worker ID or Equipment ID 2476236501 Latitude Latitude 430.31505946 Longitude Longitude 772.43722857 Time Reception time 2022.11.01 02:46:15 Distance Travel distance 4.78882812143153
Examining the path data of the TP’s movements revealed that when GPS signals were not received, the latitude and longitude were recorded as 0, resulting in incorrect paths. These missing values were deleted. Additionally, if the time difference between the current reception time and the next reception time exceeded 10 minutes, the data was considered to be from different transporters and was separated accordingly. PECNet, the path prediction learning model, differentiates the movement time using frames rather than reception times, so the seconds of the reception time were converted into frame values. This method was used to preprocess the raw data and input it into the path prediction learning model. However, the dataset also included data augmentation techniques to remove erroneous GPS coordinates indoors, irregular GPS coordinates for people, and activities where individuals stayed in one place for an extended period. In addition to collecting actual GPS sensor data, a virtual dataset was created using the OSMNX library to reflect the various geographical environments of shipyards. OSMNX is an efficient tool for processing real-world geographical data, analysing, and visualizing complex urban street networks and structures.
During the data augmentation process, a specific region within the shipyard was selected, and the road network within that area was extracted. This extraction process analysed the road structure and connectivity of the region, and GPS coordinate data was mapped based on this analysis. The conversion of actual geographic coordinates to image coordinates was calculated based on the minimum and maximum values of the data and the size of the image. The generated virtual dataset supplemented the limitations of actual sensor data and was used as training data for the predictive model.
PECNet (Predicted Endpoint Conditioned Network) (Mangalam et al., 2020) is a path prediction algorithm that showed superior performance indicators compared to other path prediction algorithms. This indicates that PECNet can accurately predict pedestrian paths. The training data included GPS coordinate data of workers’ movements.
The entire dataset was divided into an 8:2 ratio, with 30,000 training data points and 7,500 validation data points. The model training was performed with a batch size of 512 and 650 epochs.
The results of the training were evaluated using performance metrics for the path prediction model, specifically ADE (Average Displacement Error) and FDE (Final Displacement Error). ADE represents the average absolute difference between the predicted and actual values at each prediction point. FDE represents the average absolute difference between the final predicted and actual values.
Additionally, other performance metrics such as Recall (RCL), Kullback- Leibler Divergence (KLD), and Average Distance Loss (ADL) were used to comprehensively evaluate the model’s performance. Recall indicates the proportion of actual positive cases that the model correctly predicted as positive. KLD measures the difference between two probability distributions. ADL measures the average distance between the predicted and actual locations.
Experiments In this experiment, we developed a model using PECNet for predicting the paths of TPs and workers, and validated its effectiveness through various data sets and experimental settings. As an initial experiment, we divided the entire data for the moving object in Fig. 2’s (a) environment into an 80:20 ratio, utilizing 500,000 training data and 125,000 validation data. For model training, the batch size was set to 512 and the epoch to 650 to conduct the training.
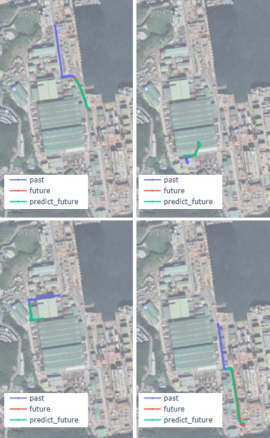
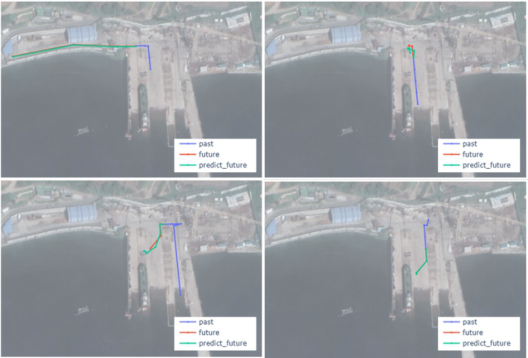
Figure 2: Comparative analysis of predicted outdoor movement paths for a specific moving object in four cases.
The results of the movement predictions for TPs and workers in the Fig. 1 environment are shown from Fig. 2 to Fig. 4. Fig. 2 displays four cases comparing the predicted outdoor movement paths of a specific moving
Securing Worker and Heavy Equipment Safety in Shipyards 243
object. In the first case (top left), the moving object progresses eastward and then turns south, with the predicted future path very accurately matching the actual future path. In the second case (top right), the moving object moves a short distance north before turning west, but the predicted path slightly misjudges the actual path’s direction change, showing a small error. In the third case (bottom left), the moving object heads south before turning east, and while the initial direction is well predicted, the point where the path turns is captured slightly late. The final case (bottom right) shows the moving object traveling south and then turning west, where the predicted future path relatively closely follows the actual future path, though there is a slight difference at the turning point.
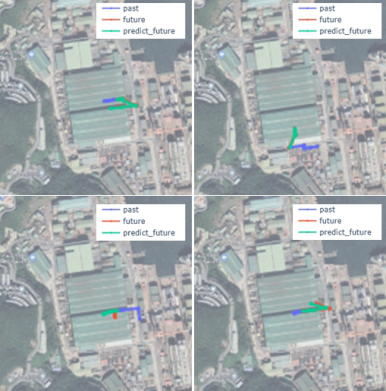
Fig. 3 displays the results of indoor movement predictions for TPs on the assembly line. In the first case (top left), the moving object travels north before sharply turning west. The predicted future path closely resembles the actual future path, though a slight error is present. In the second case (top right), the moving object moves a short distance south before turning east. The predicted path accurately captures the direction of the actual path, but there is a discrepancy at the turning point. In the third case (bottom left), the moving object goes straight north then turns west, where the predicted future path almost perfectly matches the actual future path. In the final case (bottom right), the object moves south and then turns east, where the predicted path generally follows the actual path well, but there is a slight error in the eastward turning portion.
Figure 3: Comparison of predicted versus actual indoor movement paths on the assembly line in four scenarios.
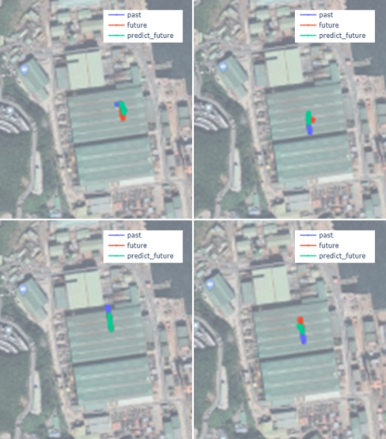
Fig. 4 shows the results of predicting movement paths for people working in an indoor workspace. In the third case (bottom left), the predicted future path closely matches the actual future path, accurately predicting both the direction changes and the length of movement. In the first case (top left), the
second case (top right), and the fourth case (bottom right), the prediction model also accurately captures the direction of movement and the stopping points, closely following the actual paths.
Figure 4: Visual comparison of predicted and actual movement paths in an indoor workspace.Figure 5: Node layout in the new port evaluation environment.
Additionally, to verify whether the trained model could be applied in different environments, a performance evaluation was conducted at a new port site measuring 219.4 meters in width and 139.7 meters in length, as
Securing Worker and Heavy Equipment Safety in Shipyards 245
shown in Fig. 5. For the moving objects, 320,000 training data points were used to develop the path prediction models. These models predict future location coordinates based on the coordinates from previous time points, thereby enabling more accurate position predictions.
Fig. 6 illustrates the model’s predictions for the movement paths of TPs. Each case includes the actual past path (blue), the predicted future path (green), and the actual future path (red). In the first case (top left), the ship travels eastward and then turns north, with the predicted path matching the actual path very accurately. In the second case (top right), the ship moves straight north, and the predicted path follows the actual direction well, though there is a slight discrepancy at the end point. In the third case (bottom left), the ship moves south and then sharply turns east, with the prediction accurately capturing the initial direction but showing an error at the turning point. In the fourth case (bottom right), the ship travels northeast, and the predicted path closely aligns with the actual path, effectively demonstrating the model’s predictive accuracy.
Figure 6: Comparative analysis of predicted and actual movement paths for TPs in four cases.
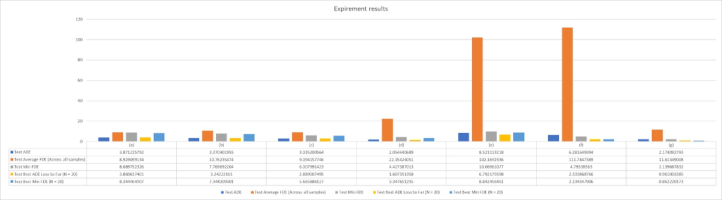
Fig. 7 synthesizes the results from various experiments, showcasing the performance of the path prediction algorithm for moving objects across different experimental settings using multiple metrics. These metrics include Average Displacement Error (Test ADE), Average Final Displacement Error (Test Average FDE), Minimum Final Displacement Error (Test Min FDE), the highest recorded ADE loss (Test Best ADE Loss So Far), and the best recorded Min FDE (Test Best Min FDE). Results from (a) to (f) are based on tests conducted in the Fig. 1 work environment, while (e) specifically pertains to tests in the Fig. 3 environment. Notably, the results from (a) to (c), which involve predictions of human movement, exhibit relatively lower ADE and FDE compared to other experiments.
From (a) to (c), the results demonstrate the predictions of human movement paths within the Fig. 1 environment, consistently showing relatively low ADE and FDE values across all cases. Notably, (c) records the lowest ADE and FDE values among these experiments, indicating the most accurate predictions. (d) and (g) show the results of forklift movement path predictions also within the Fig. 1 environment. (d) exhibits exceptionally low ADE and FDE values, indicating excellent predictive performance. Conversely, (g) shows a high average FDE but low minimum FDE and best Min FDE, indicating that some predictions are very precise. (e) and (f) represent the predictions of transporter movement paths within the same environment. (e) displays the highest average FDE among all experiments, suggesting that predicting the path of transporters is the most challenging under these experimental conditions. However, (f), despite a high ADE, shows a relatively low average FDE, indicating good performance in some predictions. Overall, these data illustrate that the accuracy and consistency of path predictions vary depending on the type of moving object and the experimental environment. Particularly, predictions for transporters were found to be the most challenging, while those for workers and forklifts were more accurate and consistent. The difficulty in predicting transporter movements is possibly related to their wider movement radius. In the experiments, three types of movers exist: workers, forklifts, and transporters, with transporters having the widest movement radius followed by forklifts and workers. Thus, a wider movement radius introduces more uncertainty in predicting movement points, affecting the ADE and FDE metrics.
Figure 7: Performance overview of path prediction algorithm across multiple experimental settings, (a)-(c): human movement prediction results in the HMB field, (d): forklift movement prediction results, (e)-(f): trailer movement prediction results, (g): forklift movement prediction results in the Fig. 5 environment.
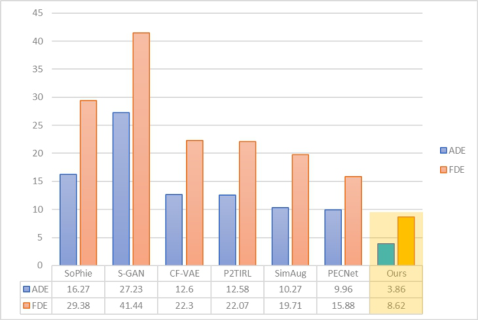
The results of this study demonstrated good performance compared to other relevant AI models for predicting human movement paths based on ADE and FDE in a defined environment. Fig. 8 reviews the baseline algorithms for comparing the study results, where the SoPhie model proposed by Sadeghian, which generates human-like movements considering social and physical constraints, was examined (Sadeghian et al., 2019). This model uses a GAN (Generative Adversarial Network) to create realistic trajectories and pays special attention to interactions and constraints within the environment. Additionally, Gupta et al. developed the S-GAN (Social
Securing Worker and Heavy Equipment Safety in Shipyards 247
GAN), a multimodal human trajectory prediction GAN that promotes diversity in predicted trajectories through various loss functions (Gupta et al., 2018) Bhattacharyya and others introduced the CF-VAE, a Conditional Flow-based Variational Autoencoder that does not rely on RGB scene images, making it suitable for various applications where visual data are unnecessary (Bhattacharyya et al., 2019). Deo and colleagues proposed the P2TIRL model that uses a maximum entropy inverse reinforcement learning policy (Deo & Trivedi, 2020). This model learns a grid-based policy for trajectory prediction, effectively handling complex movement patterns by maximizing the entropy of predicted paths. Liang et al. presented SimAug, a new camera view adaptation technique that enhances the robustness of the model in various environments using adversarially augmented 3D multi- view simulation data (Liang & Hauptmann, 2020). This study focused on using PECNet to predefine potential movement points for moving objects and workers as GPS coordinates, significantly reducing prediction errors by narrowing the range of potential paths. Consequently, PECNet demonstrated good performance in accurately predicting pedestrian paths, proving to be a useful tool for preventing collisions in complex environments like shipyards. Overall, PECNet effectively integrates spatial constraints and past movement data, achieving competitive performance compared to other contemporary models.
ADE measures the average distance error between the predicted and actual movement paths of each model, while measures the distance error at the final position. The model tested shows the lowest error values with an ADE of 3.86 and an FDE of 8.62, indicating significantly superior prediction accuracy compared to other models. For example, the SoPhie model has an ADE of 16.27 and an FDE of 29.38, while the S-GAN has an ADE of 27.23 and an FDE of 41.44. These results suggest that the tested model exhibits enhanced performance in predicting human movement paths compared to other models.
Figure 8: Comparison of ADE and FDE performance metrics across various AI path prediction models.
CONCLUSION
In this paper, we conducted a study using PECNet (Predicted Endpoint Conditioned Network) to predict the walking paths of workers in industrial environments based on their GPS route data. The training results showed a certain level of accuracy, but additional improvements are needed to achieve higher precision. The performance of the training model was evaluated using ADE (Average Displacement Error) and FDE (Final Displacement Error).
For the training data, the model achieved an ADE of 1.157 and an FDE of 1.4431, while for the test data, the ADE was 1.3809 and the FDE was 1.8761. These results indicate that the model achieved high accuracy in both overall path prediction and final destination prediction. Additionally, the evaluation using test data recorded slightly higher performance metrics than the training model, but the difference was not significant. Specifically, the test results showed an ADE of 0.53 and an FDE of 0.46, corresponding to an average path error of approximately 1.27 meters and a final position error of approximately 1.09 meters.
This study suggests that the PECNet model can be a useful tool for preventing collisions between workers and heavy machinery in complex working environments such as shipyards. Future research is expected to enhance the model’s accuracy and increase its practical applicability through algorithm improvements and data augmentation.
ACKNOWLEDGMENT
This work was supported by Innovative Human Resource Development for Local Intellectualization program through the Institute of Information & Communications Technology Planning & Evaluation (IITP) grant funded by the Korea government (MSIT) (IITP-2024-2020-0-01791).
REFERENCES
Bhattacharyya, A., Hanselmann, M., Fritz, M., Schiele, B., & Straehle, C. N., “Conditional Flow Variational Autoencoders for Structured Sequence Prediction”, arXiv preprint arXiv:1908.09008, 2019. Chan-Woo Bang and Bong-Hyun Kim, “Design of Smart Safety Equipment Platform
for Construction Site Workers”, Journal of Next-generation Convergence Technology Association, vol. 6, no. 7, pp. 1182–1188, 2022. Deo, N., & Trivedi, M. M., “Trajectory forecasts in unknown environments conditioned on grid-based plans.” arXiv preprint arXiv:2001.00735, 2020. Gupta, A., Johnson, J., Fei-Fei, L., Savarese, S., & Alahi, A., “Social GAN: Socially
Acceptable Trajectories with Generative Adversarial Networks”, Proceedings of the IEEE conference on computer vision and pattern recognition, pp. 2255–2264, 2018. Irene Ang and Adam Corbett, TradeWinds, Details emerge of major shipyard accident that left several workers dead and injured in China. Website: https://www.tradewindsnews.com/casualties/details-emerge-of-major-shipyard-ac cident-that-left-several-workers-dead-and-injured-in-china/2-1-1477143 Kim, S.H., Kang, C.S., & Ryu, H.(2019). IoT-based dangerous zone alarming system
for safety management in construction sites. Journal of the Korea Convergence Society, 10(10), 107–115.
Securing Worker and Heavy Equipment Safety in Shipyards 249
Liang, J., Jiang, L., & Hauptmann, A., “SimAug: Learning Robust Representations from Simulation for Trajectory Prediction”, Computer Vision–ECCV 2020: 16th European Conference, Glasgow, UK, August 23–28, 2020, Proceedings, Part XIII 16. Springer International Publishing, 2020. Mangalam, K., Girase, H., Agarwal, S., Lee, K. H., Adeli, E., Malik, J., & Gaidon, A.,
“It is not the journey but the destination: Endpoint conditioned trajectory prediction,” In Computer Vision-ECCV 2020: 16th European Conference, Glasgow, UK, August 23-28, 2020, Proceedings, Part II 16, pp. 759–776, 2020. Sadeghian, A., Kosaraju, V., Sadeghian, A., Hirose, N., Rezatofighi, H., & Savarese, S., “SoPhie: An Attentive GAN for Predicting Paths Compliant to Social and Physical Constraints”, Proceedings of the IEEE/CVF conference on computer vision and pattern recognition, pp. 1349-1359, 2019. Woo-Yong Choi, Hyo-Sang Kim, Dong-Hyeon Ko, Jang-Hoon Lee and Lee,
Seung Dae, “Risk Situation Detection Safety Helmet using Multiple Sensors”, The Korea Institute of Information and Communication Engineering, vol. 17, no. 6, pp. 1267–1274, 2022.
LISTED IN THE AHFE DIGITAL BOOKSTORE CATALOGUE
Explore the complete digital volume
Human Systems Engineering and Design (IHSED2024): Future Trends and Applications
Read this individual research paper free through the original publisher, or explore the full digital proceedings book.
ISBN 978-1-964867-34-2
Explore this ISBN in the AHFE Bookstore ↗Listed in the July 2026 bookstore catalogue; search by ISBN to confirm current availability · Digital book purchase optional