Satori Hachisuka, Kayoko Kurita, Shinichi Warisawa (2025). Elementary School Students’ Preferences and Learning Effects on Displayed Teacher Image in On-Demand Learning Content. In: Human Factors in Design, Engineering, and Computing. AHFE Open Access, vol. 199, pp. 1382–1391. https://doi.org/10.54941/ahfe1006950
This study aims to elucidate the appropriate form of teacher images in online learning content and to establish the knowledge necessary to construct effective learning content. Based on our previous study, we hypothesized that the improvement in learning effect would be maintained or continued when the preference for teacher image presentation matched the learners’ preferences for the display in the learning content. To confirm the validity of this trend, we experimented. We also analyzed the difference in learners’ gazing points when their preferences were matched and when they were not. In this paper, 41 elementary school students (grades 4-6) were given a quiz simulating on-demand learning, and the quiz’s correct response rate and gazing point were analyzed. Questionnaires and interviews were also conducted. Two types of content were created and used: one with the teacher’s image and the other without it. The content viewed by the participants included an explanation of the correct answers. The learning retention rate was analyzed based on the percentage of correct answers on the quiz before and after viewing this explanation, and then again after four weeks. In the analysis, we tested for differences in learning effects and gazing areas by whether the teacher image was presented and if it matched the participants’ preferences for the presentation of the teacher images. The results of the interview revealed that 46% of the experimental participants preferred the presentation of the teacher’s face image. It was also found that the presence or absence of the teacher’s image in the content did not affect the percentage of correct answers to the quiz. However, when the presence or absence of teacher images in the video content viewed matched the individual preferences of the participants, the learning effect was improved up to four weeks after the experiment. Furthermore, we compared the gazing areas of the groups in which the presence or absence of the teacher image matched the students’ preferences with those in which they did not. The results showed that the group who preferred the teacher image, in other words, the group whose preference matched the teacher presentation, spent significantly less time looking at the teacher image in the learning content than the group who didn’t prefer the teacher image, and spent considerably more time looking at the area of multiple choices during the explanation period. These results suggest that among participants who prefer the presentation of teacher image, there is less concern that gazing at the teacher image will reduce their attention to the learning content. The interview results indicated that the presentation of teacher images can be a reassuring or disincentive factor, depending on learner preference. To construct learning content with a high learning effect, it is essential to design a system that encourages learners to think and understand spontaneously, considering their preferences rather than just the presence or absence of teacher images.
Approximately five years have passed since the global adoption of online education began due to the impact of COVID-19. Today, online education has become one of the freely selectable options that embrace diversity in education and learning, adapting to the environments and circumstances of
Elementary School Students’ Preferences and Learning Effects 1383
both teachers and learners. Online education is no longer merely a necessity implemented under constrained conditions; it is now expected to be utilized to enhance educational effectiveness and learning motivation. We position the ultimate goal as elucidating effective methods of online education, which is still in its developmental phase. We aim to extract key elements within online education and establish guidelines for their practical application.
Because online education encompasses various forms and challenges, its underlying factors are intricately intertwined. In online formats, particularly hybrid or highly flexible models that combine online and face-to-face elements, a key challenge for teachers is determining how to structure and conduct lessons in this new educational environment (Beatty, 2019; Graef, 2025). Research focusing on the learner side has examined not only learning outcomes but also internal states such as motivation and engagement (Raes et al., 2020; Heilporn et al., 2021; Hachisuka et al., 2024; Molinari et al., 2022). Furthermore, when focusing solely on online education, it can be divided into synchronous and asynchronous modes, differing in whether the environment allows interaction with teachers or other learners via a screen. This study focuses solely on online education, specifically on-demand learning, where there is no interaction between teachers and learners. The rationale is that, precisely because on-demand learning lacks teacher-learner interaction, the teacher’s surface presence significantly influences learners. Furthermore, for the purpose of extracting such foundational insights, the on- demand environment, where all learners can view identical learning content, was deemed suitable. In other words, by elucidating the teacher’s presence in on-demand settings, the findings can be applied to synchronous online learning environments as well.
PURPOSE AND HYPOTHESIS Research on the representation of teachers in instructional video content used in on-demand education had been underway even before the COVID-19 pandemic. Mayer positioned the teacher as one element of multimedia learning and proposed effective methods for presenting this information (Mayer, 2020). Research has also examined how teachers are portrayed and whether teacher images should be included. Findings indicate the appropriate size for teacher images, the benefits of overlaying teacher images on instructional materials (Bhat et al., 2015; Colliot et al., 2018), and that the presence or absence of teacher images does not affect learning outcomes (Goh et al., 2017; Pi, Hong et al., 2017). These studies were based on educational environments targeting university students and above, where online education was already being implemented.
We have been investigating the impact of the presence or absence of teacher images in on-demand learning materials on learning motivation and effectiveness. This is to identify factors for making online education environments appropriate and effective for learners aged high school and below, following the spread of COVID-19. In this context, an experiment involving 53 junior high school students confirmed that, similar to prior research targeting university students and above (Goh et al., 2017; Colliot
et al., 2018), the presence or absence of teacher images did not affect learning effectiveness. However, a noteworthy finding emerged: when the presence or absence of teacher images in instructional video content aligned with learners’ preferences, a sustained improvement in comprehension was observed up to four weeks after implementation (Hachisuka et al., 2023). Building on these findings, a preliminary experiment with 21 elementary school students similarly found that when teacher images aligned with learners’ preferences, understanding was maintained and improved for up to four weeks after learning (Hachisuka et al., 2024). Therefore, this study aims to test the hypothesis that a similar trend holds as the number of elementary school participants increases to 41. Furthermore, we will use eye-tracking to clarify which areas of the learning content learners who showed improved comprehension tended to focus on when teacher images were presented.
We set the research questions for this study as follows: (1) Whether aligning the presentation of teachers’ facial images with learners’ preferences leads to a trend of improved comprehension lasting up to four weeks, and (2) Which areas of the learning content learners who prefer image presentation focus on more.
EXPERIMENT METHOD We pre-produced learning video content, including quizzes we created and their explanations, and then experimented by setting up a simulated on- demand learning environment. The quiz content was identical to that in our previous research, enabling comparison with earlier results. Details on the experiment participants, the learning content, and the experimental procedures are provided below.
Participants We experimented with 41 healthy elementary school students as participants. Participants were selected based on self-reports that they were receiving education in regular classrooms without requiring exceptional support. The gender breakdown of participants was 49% male (20 students) and 51% female (21 students). The grade distribution was as follows: 37% (15 students) were in fourth grade, 32% (13 students) were in fifth grade, and 32% (13 students) were in sixth grade. Participants were aged 10 to 12 years old. The experiment was conducted with parental consent and in a manner that respected the participants’ own free will.
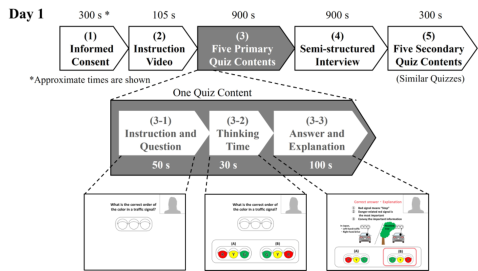
Procedure The experimental procedure was divided into two days, with a four- week interval between Day 1 and Day 2 (see Figure 1). On Day 1, in a face-to-face setting with the experimenter, the following were conducted: (1) obtaining informed consent, (2) experiment explaining, (3) administering a main (primary) quiz, (4) conducting a semi-structured interview, and (5) administering a similar (secondary) quiz. Day 2, conducted four weeks after Day 1, involved administering the same quiz as the main (primary) quiz on Day 1 (3) in an online environment via Google Forms.
The procedures from Day 1 (2) experiment explanation and (3) main (primary) quiz were replicated using video playback to simulate online
Elementary School Students’ Preferences and Learning Effects 1385
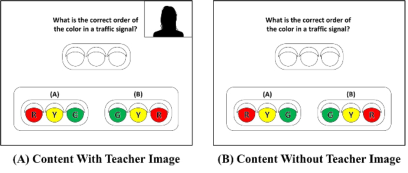
instructional materials. Two versions of this video were prepared: one displaying a teacher image in the upper right corner of the screen and one without. Participants were assigned to view one of these versions (see Figure 2). The only difference between the two videos was the presence or absence of the teacher image; the projected materials and audio information used identical content. Furthermore, the main (primary) quiz on Day 1 (3) was divided into three parts: (3-1) quiz presentation, (3-2) thinking and answering time, and (3-3) viewing the correct answer and explanation. During (3-3), participants could understand the correctness of their own answers and the problem-solving approach. Furthermore, participants’ gaze points during the (3) main (primary) quiz segment were measured using the non-contact, calibration-free EMR ACTUS experimental measurement device (manufactured by nac Image Technology Inc.).
Experiment Day 2, conducted four weeks after the Day 1 video viewing, involved answering the same questions as the (3) main (primary) quiz from Day 1 online via Google Forms. Participants were also asked whether they remembered the content of the explanations provided on Day 1. The online quiz was configured so that the teacher’s image was not displayed.
This experiment was conducted with the approval of the University of Tokyo Ethics Review Committee (Approval Number: 21-123).
Figure 1: The experiment procedure on Day 1. The contents of (5) the secondary quiz were similar to (3) the primary quiz. The contents of (3) on the second day were the same as (3) on the first day, but there were no instruction and explanation videos.Figure 2: The two types of displayed quiz content examples, with and without a teacher image. Japanese language was used in the actual experiment. The participants chose one option and orally answered the question along with the reason for the choice.
Quiz Contents We prepared five distinct quizzes in advance, designated as primary and secondary quizzes. The quizzes covered topics related to everyday objects commonly encountered in daily life or could be answered through spontaneous insight, ensuring participants’ strengths or weaknesses in specific school subjects did not directly influence their performance. Examples included traffic signals, which participants would have seen at least once, or the color schemes of traditional sweets and their reasons. Participants selected one answer they believed to be correct from two to four choices and provided their verbal response, including their reasoning. Verbal responses were used to avoid interfering with the measurement of participants’ gaze points. The order of questions was counterbalanced across participants.
DATA ANALYSIS Learning Retention Rate
When calculating quiz accuracy rates, we judged not only the correctness of the answer but also whether the reason given for selecting that answer was correct. That is, we defined a correct answer only when both the answer and the reason for choosing it were accurate. This excluded cases where an answer was correct by chance. Furthermore, for the test administered four weeks later, only correct answers in which the respondent reported remembering the explanation or answer viewed on the first day of the experiment were counted, excluding those who responded correctly by chance.
Preferences regarding the presence or absence of teacher images were collected from semi-structured interview responses. Since the quiz completion rate after four weeks was 100%, this paper analyzed learning retention rates based on quiz accuracy using data from all 41 participants.
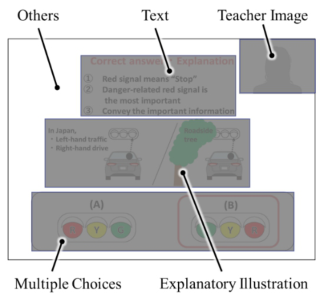
Eye Gaze Measurement Regarding gaze points, we compared the gaze areas of participants who viewed instructional videos on the first day of this experiment, specifically dividing them into groups whose instructional image presentation matched their personal preferences and those whose presentation did not. The analysis method involved dividing the areas within the explanatory videos viewed in (3-3) into five areas of interest (text, explanatory illustrations, teacher image, multiple choices, and others) as shown in Figure 3, and calculating the proportion of gaze time allocated to each area. This revealed which areas participants who preferred teacher images focused on. We considered this would help understand the visual context regarding the previously raised concern that presenting teacher images might distract learners’ attention.
Elementary School Students’ Preferences and Learning Effects 1387
Figure 3: Five areas of interest in the explanation video contents displayed in the (3-3) section.
RESULTS AND CONSIDERATTIONS Overall Evaluation
Based on impression evaluations from interviews, among the participants in this experiment, 46% preferred the teacher image in the learning content, 51% disliked it, and 2% reported feeling neither way. This result regarding the preference for teacher image presentation was nearly identical to the 45% of participants who preferred the teacher image in a prior study targeting junior high school students. Furthermore, the most common reason cited for disliking the presentation of teacher images was that it hindered concentration, with 67% of participants reporting this.
Learning Retention Rate First, to determine whether the presence or absence of teacher images affects the correct answer rate, we conducted a test for significant differences in correct answer rates between the groups with and without teacher images for each test session. Before the test, we performed a Shapiro-Wilk test to assess the normality of the correct answer rates for each group and session. The results showed that the correct answer rates for the main (primary) quiz were not normally distributed in either group (with or without teacher images). Therefore, for the main (primary) quiz, we used the Mann-Whitney U test to test for significant differences between the groups with and without teacher images. Since normality was confirmed for all other results, we tested the difference in mean correct answer rates between the presence and absence of teacher images using a t-test. The results showed no significant difference in performance between the presence and absence of teacher images across all test administrations. This trend is consistent with our previous experiments with junior high school students and preliminary studies with elementary school students.
Next, to confirm the study’s primary objective—that learning retention rates are maintained and improved up to four weeks later when learners’ preferences align with the presence or absence of teacher images—the data from 41 participants were divided into two groups. The first group
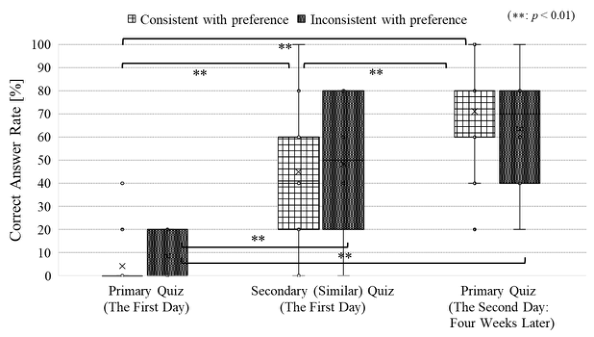
matched the preference for teacher image presentation, as indicated in interviews, with the actual presence or absence of teacher images in the experimental content. The second group did not match. A Friedman test was conducted on both groups to confirm significant differences in correct answer rates across the three quiz timings. Significant differences were confirmed at the 1% significance level for both groups. Subsequently, Bonferroni multiple-comparison tests were performed to identify significant differences in correct answer rates across quiz administrations. The results of the multiple comparisons are shown in Figure 4.
Figure 4: Correct answer rates of the group whose teacher image existence matched the preference of participants (consistent with preference group) and didn’t match the participants’ preference (inconsistent with preference group). The correct answer rate improved in the “consistent with preference group” over time, up to four weeks.
In both groups, the similar (secondary) quiz (after watching the explanation) showed a significantly higher correct-answer rate than the main (primary) quiz of the first day. However, when comparing the results of the secondary quiz and the primary quiz administered four weeks later, a significant performance improvement was observed only in the group whose preference for teacher image presentation matched the actual content presented during the experiment in Day 1. These results suggest that, consistent with our previous research, aligning the presence of teacher images in online learning content with learners’ personal preferences is preferable. However, in this study, the group whose preference matched comprised 29 participants (71%), while the group whose preference did not match comprised 12 participants (29%). This imbalance in numbers may have influenced the results.
Gaze Tracking Area of Interest In this analysis, as in the previous section, we divided participants into two groups: those whose preferences consisted with the teacher images presented in the content and those whose preferences did not consist. A
Elementary School Students’ Preferences and Learning Effects 1389
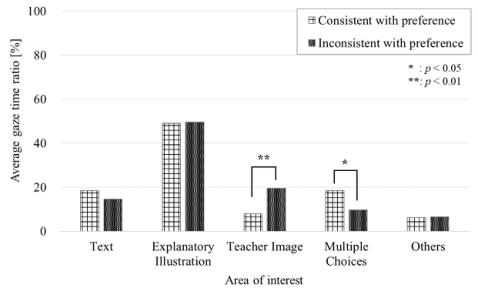
significant difference test was conducted between the groups regarding the percentage of time spent fixating on five areas of interest (text, explanatory illustrations, teacher image, multiple choices, and others). The Shapiro-Wilk test confirmed the normality of each data item. Among the group whose preferences matched the teacher’s images, the data on the proportion of gaze time spent on the teacher image and on the other area did not show normality. However, since the data in these two areas showed homogeneity of variance, a t-test based on ranks was used. For the other three areas, a t-test based on the observations was used to test for differences in gaze-time proportions between the two groups. The results showed a significant difference in gaze time proportions between the two groups for the teacher image and the multiple choices areas. For the teacher image, the group whose presentation matched the participant’s preference showed a significantly lower proportion of gaze time on the teacher image than the group whose presentation did not match, at the 1% significance level.
Regarding the teacher image area, the group whose teacher’s image presentation matched their preferences spent significantly less time in the teacher image area than the group whose presentation did not match, at the 1% significance level (see Figure 5). This result suggests that participants who preferred the teacher image presentation did not necessarily spend more time looking at the teacher image area. This implies that providing learning content with teacher images to learners who prefer them may not hinder their focus on the learning content, as they are not distracted by the teacher images. On the other hand, the group preferring teacher images spent more time looking at the multiple chpices while watching the explanatory video, suggesting they may have been re-solving the problems themselves while watching the explanation. This can be positioned as a new hypothesis.
Figure 5: The average gaze time ratio of the area of interest in the group, where the teacher image existed, matched the participants’ preference (consistent with preference group) and didn’t match their preference (inconsistent with preference group) during the explanation video. The consistent preference group gazed at the teacher image area significantly less time than the inconsistent group, and spent more time in the multiple choices area.
CONCLUSION AND FUTURE WORK Based on the results presented in this paper, we obtained the following findings for the two research questions regarding learning content for elementary school students. For the first research question (1), “Whether aligning the presentation of teachers’ facial images with learners’ preferences leads to a trend of improved comprehension lasting up to four weeks”, the experimental results showed that matching the presentation of the teacher image with learner preferences maintained and enhanced learning effectiveness up to four weeks. Regarding the second research question (2), “Which areas of the learning content learners who prefer image presentation focus on more”, it was found that during the explanation videos, learners in this content viewed the multiple choices area longer. This indicates that preferring teachers does not directly translate to more prolonged fixation on teacher images. This is further supported by the fact that participants who preferred teacher images in interviews did not report any annoyance toward them.
A limitation of this study is the relatively small number of participants. However, since we obtained data from elementary school students in a sample size similar to that of participants in our previous study targeting junior high school students, this suggests that similar tendencies are likely to be observed among learners in elementary and secondary education. In the next step, it will be necessary to increase the number of experiment participants further while also increasing the variation in their learning characteristics and proficiency levels. Furthermore, while this experiment used quizzes unrelated to specific school course subjects as simulated learning content, future experiments must be conducted within actual course subjects. By clarifying these points, it is possible to propose learning content tailored to learner characteristics and adapted to differences in course subjects and units.
Moving forward, it is necessary not only to adjust the presentation of teacher images based on learner preferences but also to extract requirements for the presentation methods and placement of teacher images according to the learning situation. Furthermore, it is essential to deepen the examination of not only visual information like teacher images but also the optimization of teacher audio information and learning content materials. Recent years have seen progress in the development and research of avatars utilizing generative AI to replace teachers and AI teachers capable of answering learner questions using LLM technology. In this era of remarkable advancements in information engineering technology, we aim to explore developmental applications that focus not just on pioneering technologies themselves, but on addressing the needs of both learners and teachers. We strive for such initiatives to contribute not only to learning effectiveness and efficiency but also to enhancing learner engagement, ultimately supporting a wider range of learning environments and learners.
ACKNOWLEDGMENT
This work was supported by JSPS KAKENHI Grant Number 23K28119.
Elementary School Students’ Preferences and Learning Effects 1391
REFERENCES
Beatty, Brian. (2019). Hybrid-Flexible Course Design. 1st ed. EdTech Books. Bhat, Suma, and Michelle Perry. (2015) “Seeing the Instructor in Two Video Styles: Preferences and Patterns.” Proceedings of the 8th International Conference on Educational Data Mining, pp. 305–312. Colliot, Tiphaine, and Éric Jamet. (2018). “Understanding the Effects of a Teacher
Video on Learning from a Multimedia Document: An Eye-Tracking Study.” Educational Technology Research and Development 66(6), pp. 1415–1433. Goh, WeiWei, Enna Ayub, Seng Yue Wong, and Chee Leong Lim. (2017) “The Importance of Teacher’s Presence and Engagement in MOOC Learning Environment: A Case Study.” 2017 IEEE Conference on e-Learning, e-Management and e-Services (IC3e), pp. 127–132. Graef, Inge. (2025) “Implementing Synchronous Hybrid Education Effectively:
Lessons from a Pilot in a Law Program in the Netherlands.”Journal of Educational Technology Systems 54(1), pp. 135–150. Hachisuka, Satori, Akiko Nakazawa, Hanako Itsubo, Naomi Iwazawa, Toru Fujimoto, and Yuhei Yamauchi. (2024), “On the Possibility of Emotion Recognition Using Facial Expressions and Utterance Voices for Measuring Online Students’ Emotional Engagement.” 2024 IEEE International Conference on Teaching, Assessment and Learning for Engineering (TALE), pp. 1–7. Hachisuka, Satori, Kayoko Kurita, and Shin’ichi Warisawa. (2023) “Relationship
between Preference for the Existence of Teacher Images and Learning Effects in Online Learning for Junior High School Students.” Training, Education, and Learning Sciences, pp. 22–28. Hachisuka, Satori, Kayoko Kurita, and Shin’ichi Warisawa. (2024) “WIP: Relationship Between Eye Gaze Points and Comprehension Level in on-Demand Learning Contents in Elementary School Students.” 2024 IEEE Frontiers in Education Conference (FIE), pp. 1–4. Heilporn, Géraldine, Sawsen Lakhal, and Marilou Bélisle. (2021), “An Examination of Teachers’ Strategies to Foster Student Engagement in Blended Learning in Higher Education.” International Journal of Educational Technology in Higher Education 18(1), 25 pages. Mayer, Richard E. (2020). Multimedia Learning. Cambridge: Cambridge University
Press. Molinari, Gaëlle, Annelies Raes, Lily Zeng, Susan Bridges, Nathan Mentzer, Shawn W. Farrington, Adrie Koehler, Lakshmy Mohandas, Ali Aamir, Mallory Claypool, Matthieu Petit, Julie Babin, Marie-Ève Desrochers, Hanna Järvenoja, Tiina Törmänen, Sari Pramila-Savukoski, Heli Kuivila, Sanna Järvelä, Kristina Mikkonen, Lisa Ollesch, Daniel Bodemer, and Armin Weinberger. (2022), “How to Promote Optimal Individual and Collaborative Learning in Remote and Hybrid Environments? A Focus on Motivational and Emotional Factors.” 15th International Conference on Computer Supported Collaborative Learning (CSCL), pp. 501–508. Pi, Zhongling, Hong, Jianzhong, and Yang, Jiumin. (2017), “Does Instructor’s Image
Size in Video Lectures Affect Learning Outcomes?” Journal of Computer Assisted Learning 33(4), pp. 347–354. Raes, Annelies, Loulou Detienne, Ine Windey, and Fien Depaepe. (2020), “A Systematic Literature Review on Synchronous Hybrid Learning: Gaps Identified.” Learning Environments Research 23(3), pp. 269–290.
LISTED IN THE AHFE DIGITAL BOOKSTORE CATALOGUE
Explore the complete digital volume
Human Factors in Design, Engineering, and Computing
Read this individual research paper free through the original publisher, or explore the full digital proceedings book.
ISBN 978-1-964867-75-5
Explore this ISBN in the AHFE Bookstore ↗Listed in the July 2026 bookstore catalogue; search by ISBN to confirm current availability · Digital book purchase optional