Vladimíra Čavojová, Robert Hanák (2019). Assessing Fluid Rationality and Its Relations to Cognitive Styles. In: Advances in Cross-Cultural Decision Making. AHFE Open Access, vol. 6. https://doi.org/10.54941/ahfe100185
A new tri-partite model of rational thinking (Stanovich, 2011) allows for assessing various aspects of rational decision making. Because of assumed multi-faceted nature of rationality, it is necessary to establish which measuring paradigms are best suited to assess it. 531 participants (31% men,), with mean age of 27.61 (SD=7.8) took part in the present study. We examined relationships between several testing paradigms from JDM literature, such as the jelly bean task (Kirkpatrik, Epstein, 1992), cognitive reflection test (Frederick, 2005) and Wason´s selection task. Higher scores in these testing paradigms are hypothesized to constitute a resistance to miserly processing. We also examined two other dimensions of fluid rationality: temporal discounting of the reward and acceptance of risk (Frederick, 2005), and several measures of cognitive style containing a preference for intuition or deliberation (PID, REI, CoSi, MBTI). The lack of strong mutual relationships between these measures, together with low internal consistency for a composite score of resistance to miserly processing, rather undermined the construct of miserly processing. There were also very weak relationships with other constructs hypothesized to be other dimensions of fluid rationality besides resistance to miserly processing. Such results seem to support Stanovich's (2011) hypothesis about multifactorial fluid rationality.
What is rationality and what is the best way to measure it? There has been much debate over what constitutes rationality and whether humans are rational beings (Gigerenzer, 2008, Nickerson, 2008, Sternberg, 2002, Stanovich, 2011). Rationality is hard to define, but the majority of researchers agree that it is probably multifarious – composed of a variety of cognitive abilities and thinking dispositions (Stanovich, 2011).
In dual process theories rationality has often been (wrongly) associated with Type 2 processes, which need to override the default automatic response of Type 1 processes. Evans (2010) argues that such overriding depends on cognitions as well as personality. Not only do we have to have sufficient knowledge to compute the right answer to the problem, but we also have to have a personality favoring a more reflective approach to problems. In a similar vein, Stanovich (2011) writes about individual differences in thinking dispositions, especially motivation towards rational integration (for discussion see also Saunders, Over, 2009). However, in a recent article written together by Evans and Stanovich (2013) they both emphasize the fact that rationality has to be ascribed to individual, not Cross-Cultural Decision Making (2019) subpersonal processes (i.e. a person can behave rationally, but neither Type 1 nor Type 2 processes rational per se).
The view that Type 2 processes are behind all rational behavior has been reflected in naming the Type 2 processes as rational (e.g. Epstein, 2003) or by arguing that Type 1 processes must be overcome in order to avoid biases and errors (heuristic and biases program, Tversky, Kahneman, 1974). However, there are three issues to consider. Firstly, cultural studies reviewed by Buchtel and Norenzayan (2009) suggest that holistic processing can also be learned, effortful and normatively correct for solving some problems and that it is likely to reflect cultural differences in Type 2 processing. In other words, in some cultures that value holism and relationships more highly, Type 2 processes have different attributes than is typically ascribed to them (analytic, de-contextualizing, etc.). Secondly, Stanovich (2011) recently proposed a taxonomy of errors, which reflects upon a newly formed understanding that errors can be caused by not using Type 1 processes when it is adequate, not recognizing the need to engage Type 2 processing (error of comprehension, Kahneman, Tversky, 1982), or lacking the skills or knowledge necessary for successful solving the task (errors of application, Kahneman, Tversky, 1982). In this notion, rationality is identified more with a so called reflective mind (recognizing the need to intervene in default automatic processing) rather than an algorithmic mind (cognitive capacity). Thirdly, Evans and Stanovich (2013) distinguish between types (Type 1 and 2 as qualitatively distinct ways of processing information) and modes of processing, which are cognitive styles and are manifest within the domain of what is regarded as Type 2 thinking. Taking cognitive styles as only a variation in the domain of Type 2 processes largely explains the many cultural differences reviewed by Buchtel and Norenzayan (2009).
In his new tri-partite model Stanovich (2011) elaborates on the dual-process theories, but differentiate reflective and algorithmic mind at the level of Type 2 processes. It is based on extensive research of individual differences and differential association of intelligence with the two minds. Reflective mind is a source of individual differences in rational thinking dispositions and is responsible for detecting the need to override automatic Type 1 responses. Algorithmic mind is a source of individual differences in fluid intelligence and is responsible for coming up with the correct response, when reflective mind detects the need for override. Stanovich extends this model further by proposing a framework for assessment of rational thinking, where rationality can be partitioned into fluid and crystallized components by analogy to the Gf and Gc of the Cattel/Horn/Carrol fluid-crystallized theory of intelligence. Fluid rationality encompasses the process part of rational thought (the thinking dispositions of the reflective mind), while crystallized rationality concerns acquired knowledge (content) that can either help (crystallized factors) or undermine (crystallized inhibitors) rational thinking. This framework (Stanovich, 2011, p. 192) allows for assessing various aspects of rational decision making. Because of assumed multi-faceted nature of rational thinking, it is necessary to establish which measuring paradigms are best suited for assessment of rationality.
The relationship between thinking disposition (cognitive styles) and rational decision making is not straightforward. Some studies have found a positive relationship (Witteman, van den Bercken, Claes, & Godoy, 2009, Sirota, Juanchich, & Hagmayer, 2013), others have found no such relationship (Newstead, Handley, Wright, & Farrelly, 2004, Čavojová, Ballová Mikušková, Hanák, 2013). One possible explanation for these results could lie in different cultural backgrounds. For example, Buchtel and Norenzayan (2009) review several studies that suggest that not only do Eastern and Western cultures differ in dominant cognitive style (holistic vs. analytic), but that these styles are learned in the process of socialization. They assert that cultural differences are best conceptualized as differences in habits of thought, rather than differences in the actual availability of information processing strategies in the cognitive repertoire, and that holistic and analytic ways of thinking can be differently encouraged in their development and use by different cultural and situational constraints (Buchtel, Norenzayan, 2009, p. 219).
The aim of the current paper is to outline the possible relationships between some of the testing paradigms proposed by Stanovich (2011) to measure aspects of fluid rationality, such as resistance to miserly processing, temporal discounting of reward, and acceptance of uncertainty (risk). Secondly, we examine the relationships between these dimensions and cognitive styles because in Stanovich´s (2011) framework faith in intuition is conceptualized as one of the rationality inhibitors belonging under crystallized rationality. Finally, we compared the results obtained in a Slovak sample with results from other cultural backgrounds.
In the rest of the paper we first introduce some concepts relevant for assessing rationality, such as resistance to miserly processing, temporal discounting of reward and risk seeking preference and then review their relationships with several cognitive styles. We then present the results of our preliminary study regarding relationships between rationality and cognitive styles, gender and cultural differences. In the final section we draw some conclusions Cross-Cultural Decision Making (2019) regarding the examined model proposed by Stanovich (2011).
ASSESSMENT OF RATIONAL THOUGHT Establishing a reliable measure for the assessment of rational thinking is of great importance because it differs from intelligence in many respects. However, due to its multifaceted nature, it is quite difficult to find just one measure that would reliably test rational thinking in all its complexity. We examined relationships between several dimensions from Stanovich´s framework (described below in detail) in a sample of 531 participants (31% men), with a mean age of 27.61 years (SD=7.8). In this section we first introduce the three main dimensions (resistance to miserly processing, prudently discounting the future and risk preference) and tasks from different measurement paradigms. We then briefly describe cognitive styles and their measurement. Results of our analysis will be presented in the following section.
Resistance to miserly processing Many tasks in the heuristics and biases literature (in which people fail to give the normatively correct response) reflect our tendency toward miserly processing (Stanovich, 2011). There are two ways in which the errors of faulty (not normatively correct) reasoning can occur. Earlier models presumed that miserly processing always involved defaulting to Type 1 processes (autonomous mind). However, more recent models (e.g. Stanovich, 2011) also allow for the possibility of miserly Type 2 processing. For example, recognizing the need for Type 2 processes to compute the answer, but resigning to serial associative cognition with a focal bias, resulting in a non-intuitive, but still incorrect, response.
Cognitive Reflection Test. The Cognitive Reflection Test (CRT; Frederick, 2005) is a simple task measuring our tendency towards miserly processing (or cognitive impulsiveness/laziness in defaulting to the autonomous mind) vs. the ability to postpone our judgment (cognitive reflection). It is a simple test of one type of cognitive ability that is so predictive of some preferences that it effectively functions as an expression of cognitive ability (Frederick, 2005). CRT is rooted in a dual process approach, but it also fits in the newer tripartite model proposed by Stanovich (2011) in that it directly reflects the most important aspect of the reflective mind – suppressing our tendency to give the first intuitive answer that comes to mind and recognizing the need to engage the algorithmic mind (Type 2 processes) to come to the correct answer. In contrast with classic insight problems, such as the nine-dot problem, it primes an attractive intuitive response – the (incorrect) answer comes to mind easily and the individual has to recognize that it is incorrect and calculate the right answer.
The CRT consists of three simple problems, as follows (taken from Frederick, 2005):
1) A bat and a ball cost $1.10 in total. The bat costs a dollar more than the ball. How much does the ball cost? 2) If it takes 5 machines 5 minutes to make 5 widgets, how long would it take 100 machines to make 100 widgets? 3) In a lake, there is a patch of lily pads. Every day, the patch doubles in size. If it takes 49 days for the patch to cover the entire lake, how long would it take for the patch to cover half of the lake?
In an extensive study, Toplak, West and Stanovich (2011) found that CRT is a more potent predictor of a wide sample of tasks measuring rational behavior than other measures of cognitive abilities, thinking dispositions and executive functioning. Based on these results they argue that CRT is such a powerful measure because it is performance based rather than a self-report measure, and that it assesses resistance to miserly processing in a way that is not addressed by any other test of cognitive abilities or executive functioning.
Diagnostic hypothesis testing. Another important aspect of miserly processing is confirmation bias and failure to take into account information that would falsify our hypotheses. Our ability to avoid these thinking errors is measured by Wason´s four card selection task. We used this problem: “You are shown a set of four cards placed on a table, each of which has a number on one side and a colored patch on the
Cross-Cultural Decision Making (2019) other side. The visible faces of the cards show 3, 8, red and brown. Which card(s) must you turn over in order to test the truth of the proposition that if a card shows an even number on one face, then its opposite face is red?”
The selection task showed moderate correlations (r=0.22) with CRT in the study by Toplak, West and Stanovich (2013). Furthermore, CRT was a significant predictor of normatively correct performance in the selection task. Thompson, Evans and Campbell (2013) examined the selection task in a slightly different format and concluded that people gave intuitive (incorrect) answers due to the fluency (and associated feeling of rightness) produced by Type 1 processes. Therefore, it seems reasonable to assume that the ability to suppress feelings of rightness connected with an intuitive response in the selection task will be related to an ability to resist miserly processing.
Attribute substitution refers to our tendency to lighten the cognitive load (Kahneman, Frederick, 2002). It occurs when a person needs to assess attribute A but finds that assessing attribute B (which is correlated with A) is cognitively easier, and so uses B instead. In other words, it means answering an easier question instead of a harder one. For assessing this tendency we used the Jelly bean task (Denes-Raj, Epstein, 1994), which reads as follows: You can always win 1 EURO when you draw a red bean (not peaking) from a bowl containing white and red beans. You can choose from the two bowls from which you will draw beans: (1) A bowl containing 10 beans, 9 white and 1 red, or (2) A bowl containing 100 beans, 93 white and 7 red?
The Jelly bean task showed moderate correlation (r=0.37) with the CRT in the study of Toplak, West and Stanovich (2013). The Jelly bean task has often been used in studies of dual-process theories to show that people often choose according to the vividness effect – despite knowing the more unfavorable ratio of the latter bowl, the picture of 7 winning marbles seems to be more appealing than just 1 winning marble (e.g. Epstein, 2003). The normatively correct choice (bowl A) is correlated with subscales of cognitive styles that are supposed to reflect Type 2 processing (e.g. Sobyra, 2010, Witteman, van den Bercken, Claes et al., 2009; for review see Hanák, 2013).
Prudently discounting the future (Temporal discounting of reward) Another major dimension within fluid rationality is 'prudently discounting the future' (Stanovich, 2011). It is based on the notion that more rational people should be more patient – that they “discount” future reward less (Frederick, 2005). Furthermore, they are more able to employ the algorithmic capacities of their mind to calculate the more advantageous option – the results of Frederick´s experiments show that there is no simple direct relationship between scoring high on CRT and automatically preferring future higher rewards. This was probably influenced by the fact that the high CRT group perceived themselves as both less impulsive and more concerned about inflation. Frederick (2005) concludes that “one observes considerable differences between CRT groups for choices like those in items a and b1, where more careful deliberation or “cognitive reflection” should argue strongly in favor of the later larger reward, but negligible differences for many of the other items, for which additional reflection would not make such a strong case for the larger later reward” (p.31). Similar results showing the low CRT group as less patient than the high CRT group were found by Oechssler, Roider and Schmitz (2009).
In the current study, we only used the items a to d of the temporal discounting the future task used by Fredereick (2005), which covered hypothetical choices between an immediate reward and a larger delayed reward, that proved to be significant in the Frederick´s study.
Risk seeking preference The influence of cognitive ability on risk seeking behavior is not widely studied but one can expect that people with higher rationality should be more able to choose according to the expected values of gambles (and thus employing the algorithmic capacity of their minds). Donkers, Melenberg and van Soest (2001) found that more educated participants were more tolerant of risk in hypothetical gambles. Benjamin and Shapiro (2005; in Frederick, 2005) also found a positive relationship between cognitive aptitudes tests and choice according to expected value for real decisions involving small stakes. Frederick (2005) found that the high CRT group was more willing to gamble. This was pronounced especially for higher expected value gambles, but it was clear even for middle stakes. On the other
1Frederick (2005) used 4 categories of time preferences: items a – e represented choices between an immediate reward and a larger delayed reward, items f – h represented choice between an immediate reward and a sequence of delayed rewards, item i represented choice between shorter more immediate massage and longer more delayed massage, and items j – k represented a choice between a smaller immediate loss or a larger delayed loss. In our study we employed only items a – e, because they showed as the most significant in Frederick´s studies. Cross-Cultural Decision Making (2019) hand, for items involving losses the high CRT group was less risk seeking and more willing to accept a sure loss to avoid playing a gamble with a lower expected value. These results have a curious implication for prospect theory (Kahneman, Tversky, 1979) because they indicate that prospect theory holds for average to low cognitively reflective individuals, while highly cognitively reflective individuals are immune to such a switch of risk aversion to risk seeking when the valence of a gamble changes from positive to negative (as prospect theory suggests).
Oechssler, Roider and Schmitz (2009) similarly found that the high CRT group was more likely to choose the alternative that is compatible with risk neutrality. They argue that people with higher cognitive abilities (as reflected by CRT) might save more and receive higher expected returns,which can lead to their pronounced role in a financial markets.
Similarly, we only used the items a to h from risk seeking preferences that were significant in the Frederick´s study. Concrete items are shown in Table 2.
COGNITIVE STYLES Belief in the superiority of intuition
Although many cognitive style measures are roughly based on a distinction between Type 1 (intuitive) and Type 2 (reflective) processing, they more reflect a personal variation and preference in using Type 2 processes (Evans, Stanovich, 2013). Usually, they measure two dimensions reflecting the preference for an intuitive or reflective mode of processing. However, in Stanovich´s model (2008) intuition is viewed mainly as an opposite pole from rationality and faith in intuition is hypothesized to be negatively associated with the normative response in many rationality thinking tasks. In our study, cognitive styles were measured by four questionnaires:the overview of the measures together with numbers of participants is shown in Table 1.
Preference for Intuition and Deliberation (PID, Betsch, 2004) is an instrument for measuring affective intuition, defined as being based on implicit knowledge and also as a basic mode of decision making, which uses affect as a decision criterion (high preference for intuition relates to Type 1 processes and reliance on instant impressions and emotions). On the other hand, deliberation is defined as decision making using explicit evaluation, rules of deciding, beliefs and reasons (high preference for deliberation relates to trusting rather Type 2 processes). PID consists of 18 items; 9 for PID-Intuition (e.g. “I listen carefully to my deepest feelings.”) and 9 for PID-Deliberation (e.g. “Before making decisions I usually think about the goals I want to achieve.”). Participants indicated their agreement with these statements on a 5-point Likert scale with 1 meaning “totally disagree” to 5 “totally agree”. Our participants were in general slightly more deliberative (M=35.4, SD=5.1) than intuitive (M=31.2, SD=51).
Rational-Experiential Inventory (REI, Epstein, Pacini, Denes-Raj, Heier, 1996) consists of two formerly separate scales – Need for Cognition (basis for REI-Rationality) and Faith in Intuition (basis for REI-Experientiality) and this makes it compatible with Stanovich´s recent (2011) framework, in which REI-R should be related to rationality and thinking tasks and REI-E should be negatively correlated with rationality. We used a 6-point scale to indicate agreements with REI items. This inventory was chosen because it has the best psychometric characteristics of inventories that measure intuitive and reflective cognitive styles (Hanák, 2013). It was also verified in a Slovak environment (Ballová Mikušková, Hanák, Čavojová, under review). Again, participants in general showed a slight inclination for rational processing (M=80.83, SD=13.7) than experiential processing (75.14, SD=14.4).
Cognitive Style Indicator (CoSI, Cools, Van den Broeck, 2007) is an 18-item questionnaire measuring people´s preferences for perception, processing, and structuring of information. Items are scored on a 5-point scale, with 1 meaning “totally disagree” to 5 “totally agree”. Authors distinguish three cognitive styles: Knowing, Planning, and Creating. The Knowing style is defined within CoSi as an emphasis on logic, precision and objectivity, which makes it similar to more traditional scales measuring reflective cognitive styles. Planning emphasizes structure, control and routine, while Creating emphasizes subjectivity, impulsivity and openness to possibilities. In CoSi, the most preferred style was Planning (M=27.46, SD=4.3), then Creativity (M=25.87, SD=4.6, and lastly Knowing (M=14.82, SD=2.3).
Myers—Briggs Type Indicator (MBTI, Myers, Briggs et al., 1998) helps to identify basic preferences for Cross-Cultural Decision Making (2019) perception and judgment in terms of mental functions in combination with various attitudes, such as orientation of energy and orientation towards the external world. MBTI consists of four dichotomous categories: 1) perception: sensing (S) and intuition (N), 2) judgment: thinking (T) and feeling (F), 3) energy: extraversion (E) and introversion (I), and 4) orientation toward the world: judgment (J) and perception (P). In the present study, we used the version published by Kovacs (2011). Based on studies criticizing dichotomized categories (e.g. Arnau, Green, Rosen, Gleaves, Melancon, 2003), which is created by a forced choice between statements, we used categories as separate dimensions where each item was evaluated on a scale from 0 to 5. For the current analysis we included only subscales related to judgment (Thinking, Feeling) and perception (Intuition, Sensing). Our sample preferred more Sensing (M=40.98, SD=6.6) than Intuition (M=31.62, SD=7.2), and Thinking (38.29, SD=8.4) over Feeling (M=34.16, SD=8.1).
Table 1: Overview of used measures within Stanovich´s (2011) taxonomy of rationality assessment Fluid rationality Crystalized rationality Resistance to Miserly
Table available in the original PDF paper.
Prudently Discounting of
Absence of Irrelevant
Belief in Intuition
Processing
Future
Context Effect
1. PID (Betsch, 2004), N=446
1. Cognitive Reflection Test (Frederick, 2005), N=531
4. Preference for Patience (Frederick, 2005), N=523
5. Preference for Risk Seeking (Frederick, 2005), N=515
3. CoSi (Cools, van den Broeck, 2007), N=388 4. MBTI (Myers Briggs, McCaulley, Quenk, Hammer, 1998), N=396
RELATIONSHIPS BETWEEN TESTING PARADIGMS Assessing fluid rationality
Firstly, we investigated the possibility of creating a composite score for Resistance to Miserly Processing (as a major dimension of fluid rationality), but the five items gave Cronbach´s alpha at only 0.584 level. After deleting Wason´s Selection Task and the Jelly bean task, Cronbach´s increased to 0.749. In Wason´s Selection Task there were only 2 participants out of 531 who gave the correct answer, therefore due to a floor effect we excluded it from further analysis. The Jelly bean task shows a small, but significant correlation with CRT (r=0.118, p=0.007), but it does not bring substantial additional effect. Thus, in further analyses we treat each measure separately and not as a composite score of Resistance to Miserly Processing.
We divided participants into extreme groups according to their overall score in CRT – those giving all three correct answers were assigned into high CRT group (N=139, 26.1%) and those giving no correct answer were assigned into low CRT group (N=114, 21.4%). To analyze the associations between cognitive reflection (measured by CRT) with other dimensions of fluid rationality (time preference and risk preference) from Stanovich´s (2011) taxonomy we employed chi-square analyses and the results are shown in Table 2.
Table 2: Intertemporal and risk seeking preferences for Low and High CRT Groups Cramer low CRT high CRT x2 df p Value
Table available in the original PDF paper.
´sV time preference n % n % a €3400 this month 91 33.30% 18 22.50% 3.402 1 0.042 0.098
or €3800 next month 182 66.70% 62 77.50% b €100 now 228 83.50% 65 81.30% 0.225 1 0.373 0.025
Cross-Cultural Decision Making (2019) or €140 next year 45 16.50% 15 18.80% c €100 now 173 64.10% 57 71.30% 1.41 1 0.146 0.063 or €1100 in 10 years 97 35.90% 23 28.70% d €9 now 200 73.30% 57 70.40% 0.262 1 0.352 0.027 or €100 in 10 years 73 26.70% 24 29.60% risk preferences a €1000 for sure 116 43,10% 29 36,30% 1,199 1 0,167 0,059
or a 90% chance of €5000 153 56,90% 51 63,70% b €100 for sure 112 41,00% 23 28,40% 4,224 1 0,026 0,109
or a 90% chance of €500 161 59,00% 58 71,60% c €1000 for sure 207 75,80% 55 67,90% 2,039 1 0,101 0,076
or a 75% chance of €4000 66 24,20% 26 32,10% d €100 for sure 221 81.00% 66 81.50% 0.011 1 0.529 0.006
or a 75% chance of €200 52 19.00% 15 18.50% e €100 for sure 246 90.10% 77 95.10% 1.917 1 0.12 0.074
or a 75% chance of €150 27 9.90% 4 4.90% f €100 for sure 231 84.60% 70 86.40% 0.16 1 0.421 0.021
or a 50% chance of €300 42 15.40% 11 13.60% g €500 for sure 184 67.40% 38 46.90% 11.211 1 0.001 0.178
or a 15% chance of €1000000 89 32.60% 43 53.10% h €100 for sure 245 89.70% 64 79.00% 6.483 1 0.012 0.135
or a 3% chance of €7000 28 10.30% 17 21.00%
In contrast with Frederick (2005), our results showed that high CRT is associated with only 1 out of 4 preferences for a more patient option yielding higher reward, and 3 out of 8 preferences for a riskier option. After calculating a composite score for both time preference and risk preference (we used the same procedure as Frederick, 2005) and correlating it with total CRT scores (Table 3), there is only a slight correlation with riskier preference and no correlation with preference for the more patient option. Also Cramer´s V shows only weak relationships.
Oechssler et al. (2009) similarly found more pronounced differences between low and high CRT groups in risk seeking preference than in time preferences. They employed slightly differently formulated items (and only two for risk preferences and one for time preference).
Predicting rational performance from cognitive styles Next, we analyzed relationships between measures of fluid rationality and cognitive styles. As we stated earlier, measures of rational thinking showed only weak correlations among themselves (CRT correlating with a composite score for risk preference, r=0.09, p=0.04 and the jelly bean task, r=0.118, p=0.007; and time preference correlating with risk preference, r=0.24, p<0.001,and Wason´s task, r=0.12, p=0.005).
Measures of cognitive style showed only a few weak correlations with rational thinking measures. The most useful was REI-R scale that correlated with three other measures: CRT (r=0.14, p<0.01), time preference (r=0.105, p<0.05), and risk preference (r=0.115, p<0.05). PID and CoSi subscales showed no correlations with other cognitive tasks, which is in contrast with the findings of Witteman at al. (2009). MBTI showed an interesting pattern of correlations with other cognitive tasks – intuition correlated positively with preference for the riskier option (r=0.112, p<0.05). Sensing (as opposed to intuition) correlated negatively with CRT (r=-0.099, p<0.05). However, all significant relationships were only very weak and explained only a few percent of the variance. Cognitive style Cross-Cultural Decision Making (2019) measures designed to tap into individual differences in reflective and intuitive thinking show, in fact, only a poor ability to predict performance in CRT as a prime measure of resistance to miserly processing. Apart from REI-R, no subscale of PID, MBTI, or CoSi could be used as a useful predictor for CRT total score.
The REI-R consists of two parts, each having a different predictive ability. Rational engagement when used as a predictor was only close to significance (p = 0.057); rational ability was the better predictor ([Equation or mathematical symbol available in the original paper PDF]= .162, t(498) = 3.655, p = .000), but still explained only a very small part of the variance, R2 = .024, F(1, 496) = 13.36, p = .000. From four widely used cognitive style questionnaires (having 15 subscales altogether together), only Rational Ability (REI) could be used as a significant predictor for successful reflective thinking (CRT). Toplak et al. (2013) found a stronger correlation between CRT and thinking disposition (r=0.3), which consisted also of the Need for Cognition Scale (which is the basis for REI-R), but probably because they calculated the correlation for a composite score of thinking disposition (Need for Cognition, Actively Open-Minded Thinking, reversed Superstitious Thinking, and Consideration for Future Consequences).
Gender differences in rationality Because men seem to do better in CRT than women (Frederic, 2005, Toplak et al., 2013) we also analyzed gender differences in cognitive tasks (Table 3a) and cognitive styles (Table 3b).
Table 3a: Gender differences in cognitive tasks and preferences men women
composite score for Time preferences 0.44 0.29 0.34 0.28 3.527 0.000 0.15 composite score for Risk preferences 0.37 0.22 0.27 0.23 4.561 0.000 0.20
We found gender differences in CRT and almost all preferences – men seemed to be more patient in waiting for a larger reward and also generally prefer the riskier option with the more advantageous pay-off. Although differences are significant, effect sizes are close to zero or minimal. From Table 4b we can also see gender differences in cognitive style. Women scored higher in styles associated with a preference for intuition and feeling (PID_I, REI_E, MBTI_F), men scored higher in styles associated with analysis and deliberation (PID_D, REI_R, CoSi_c, MBTI_T). An exception to this was a higher score in CoSi_k and MBTI_N for men. Only in CoSi_p were there were no gender differences. As in the previous table we can see in table 4b that men differ significantly from women in almost all scales but the effect sizes are minimal or very small, explaining no more than a few percent of the variance. These results complement our previous findings (Ballová Mikušková et al., under review), where we found that combined measures of cognitive styles tapping into intuition vs. deliberation generally load to three factors, which we labeled “decision-making based on cognitions”, “decision-making based on affect and holistic processing” and “planned, structured decision-making”, and it seems likely that the preference of a particular style is affected by gender.
Table 3b: Gender differences in cognitive styles men women
Differences between men and women in the cognitive styles are supported by CRT scores, where men differ from women significantly (Table 3a).
Gender differences, which were significant among cognitive styles and CRT, do not significantly interact together in a moderation analysis, only in combination with REI-R and PID-D. Specifically, although men and women differ in CRT score and also in PID-D, moderation analysis (with CRT score as the outcome, PID-D predictor and gender moderator) produces a model that is insignificant, and also an interaction between PID score and gender that is insignificant. This model explains minimal variance. The same results were found with REI-E as predictor.
Results are very different however, when investigating PID-I and REI-E. A moderation model with CRT score as outcome, PID-I predictor, moderated by gender, was found to be significant. The same results were found with REI-E as predictor. In both cases, the model is highly significant, as is the interaction between scales and gender and each is significant predictor alone. However, both models explain only a few percent of CRT score variance and the increase due to interaction is about 2%. Based on these results we could speculate that it is not high levels of self- reported reflective cognitive style which means that your CRT is higher. It is high levels of intuitive cognitive style in women, which makes your CRT lower. This result would provide partial support for Stanovich´s (2011) claim that faith in intuition undermines rational thinking.
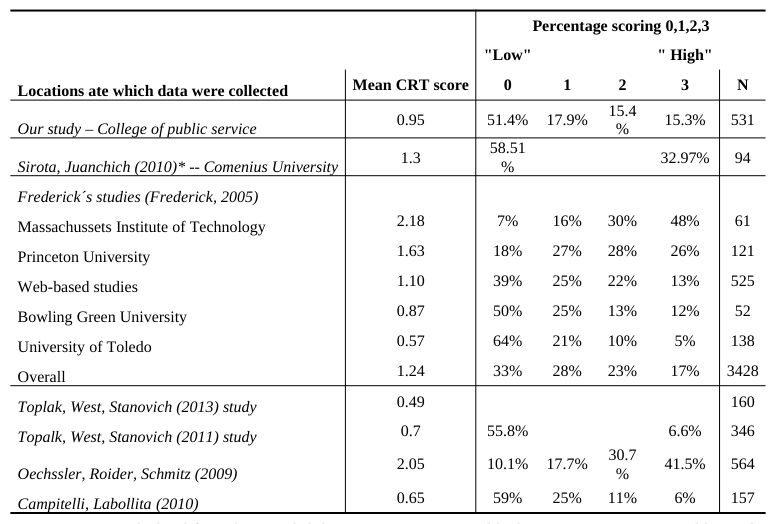
Comparison with other studies – comment on intercultural differences In this section we summarize our results in terms of their comparison with findings from other cultural backgrounds. In Table 4 we can see that successful CRT answers and their distribution are comparable to Frederick´s (2005) results, with our sample situated somewhere in the middle range between top colleges like MIT and Princeton and low-end collages like University of Toledo. Results are similar to Frederick´s (2005) web-based studies in terms of number of participants and also achieved level of success, possibly reflecting the heterogeneity of our sample comparable with web sampling. Our participants also achieved similar scores to participants of non-American samples (e.g. Canadian sample – Toplak et al., 2011, 2013, or Argentinian sample – Campitelli, Labollita, 2010), with the exception of the German sample in Oechssler et al. (2009) study.
It is likely that rather low levels in CRT were caused by the fact that our sample from a private college consisted of students accepted without passing entrance exams. Sirota and Juanchich (2010) on similar sample from a more elite college with hard entrance exams found a higher mean score (M=1.3), though their sample was smaller than ours. As Toplak et al. (2013) noted, in some populations the overall score on the three-item version of CRT might be floored, and thus the CRT is in need of supplement and extension. We agree, because our experience and results Cross-Cultural Decision Making (2019)
(e.g. Čavojová, Hanák, Ballová Mikušková, 2014) show the rather unflattering fact that even university students are not very successful in a variety of cognitive tasks extensively used in the JDM literature. We believe these results are caused by our unfortunate educational system rather than essential differences in rational thinking between Slovaks and other nations (e.g. Ballová Mikušková, Hanák, Čavojová, under review).
We also confirmed gender differences in the expected direction in CRT and other measures of rationality, which is in line with previous studies (Frederick, 2005, Toplak et al., 2013, Oechssler et al., 2009) and can also explain the rather low scores of our sample, as women tend to score lower in CRT and our sample consists predominately of women (69 %). On the other hand, Campitelli and Labollita (2010) did not find significant differences between men and women in their sample, though they observed a similar trend and their sample was similar to ours (73% of women).
Table 4: CRT results for several studied samples Percentage scoring 0,1,2,3
We found a different pattern of connection between CRT and time and risk preferences than in the original study by Frederick (2005). A possible reason for the insignificant results in time preference could be very big differences in the possible returns. Options differ in terms of time necessary for waiting (1 month in a vs. 120 months in c, d), and also in return amount (€400 vs. €40). Probably, students of management made these simple financial comparisons by taking into account time, return, return ratio to average wage in Slovakia and inflation, and thus recognized that the best option for Slovak financial environment is option a (highest return, shortest time, high return ratio compared to the average Slovak monthly wage). Campitelli and Labollita (2010) found that the majority of their sample behaved impatiently and safely in comparison with Frederick´s (2005) study. They argue that it could be caused by high inflation rates in their country (Argentina), which is not the case with Slovakia, as inflation in recent years is approaching its minimum.
CONCLUSIONS
How do our results contribute to the proposed model of fluid rationality (Stanovich, 2011)? A lack of mutual Cross-Cultural Decision Making (2019) relationships together with a low internal consistency for a composite score of resistance to miserly processing (cognitive reflection, resistance to attribute substitution, and diagnostic hypothesis testing) rather undermined the unitary notion of resistance to miserly processing (measured by different testing paradigms). There were also very weak relationships between other constructs which were hypothesized by Stanovich (2011) to form other dimensions of fluid rationality together with resistance to miserly processing. On the other hand, such results seem to support Stanovich´s (2011) hypothesis about multifactorial fluid rationality.
Our results in general point to the need for further refinement of the measures used to assess rational thinking, as these are typically very difficult for general (less elite) populations. This leads to either a pessimistic conclusion about the rationality of people in general or to a conclusion about the necessity of possessing specialized knowledge for solving these rationality tasks. Another issue with rational thinking tasks, which deserves attention, is that some of these tasks are beginning to be widely known and once a person acquires the solution for such tasks they become useless in further research (Toplak et al., 2013, Kostovičová, Konečný, Dudeková, 2013).
Another issue worth emphasizing is the general lack of a relationship between rationality thinking tasks (performance based measures of rational thinking) and cognitive styles (self-reported measures of preference for rational thinking). Self-report cognitive style inventories, such as PID, CoSi or MBTI did not predict performance in the cognitive reflection test. Only rational ability (from REI) could be used as a self-reported tool useful for predicting related performance in rational thinking tasks. Our findings are in accordance with Newstead et al. (2004) who came to the similar conclusions.
However, analysis of gender differences revealed that high levels of intuition in the female group as measured by REI negatively affected miserly processing (resulting in low scores in CRT). Stanovich (2011) lists Faith in intuition as a crystallized inhibitor of rational thinking, but our results highlight the importance of analyzing the effect of faith of intuition separately for men and women. It seems to be a case that gender differences in cognitive reflection (and thus higher resistance to miserly processing) are not caused by lower cognitive abilities of women in our sample, but rather their preference for affective and holistic decision making that resulted in satisfying with the appealing intuitive (though incorrect) answers in CRT.
Generally, it seems unsatisfactory to examine rational thinking only in regard to resistance to miserly processing (or cognitive reflection) or any thinking disposition. Rather, it would seem advantageous to test the ability of such measures to predict any real-life outcomes. Many accounts of rationality embrace the notion of instrumental rationality – the rational is any behavior that leads to fulfilling personal goals, which makes its measurement rather difficult (it is difficult to establish a valid real-life outcome if it is not desirable for every person). We believe it is necessary to include into future battery tests of rational thinking measurements of personal beliefs and values, some of which probably facilitate rationality and some of them detrimental to it.
ACKNOWLEDGMENT
This work was supported by Slovak grant agency VEGA 2/0064/13 ”Decision making of experts: using intuition for solution of strategic tasks” awarded to Vladimíra Čavojová.
REFERENCES
Arnau, R. C., Green, B. A., Rosen, D. H., Gleaves, D. H., Melancon, J. G. (2003), “Are Jungian preferences really categorical?: An empirical investigation using taxometric analysis”. PERSONALITY AND INDIVIDUAL DIFFERENCES, Volume 34, pp. 233–251. Ballová Mikušková, E., Hanák, R., Čavojová, V. (under review), “Intuition versus deliberation: Psychometric properties of two
self-reported scales”. JOURNAL OF PERSONALITY ASSESSMENT. Betsch, C. (2004), „Präferenz für Intuition und Deliberation (PID): Inventar zur Erfassung von affekt- und kognitionsbasiertem Entscheiden“. ZEITSCHRIFT FÜR DIFFERENTIELLE UND DIAGNOSTISCHE PSYCHOLOGIE, Volume 25, No. 4, 179–197. Buchtel, E.E., Norenzayan, A. (2009), “Thinking across cultures: Implications for dual processes.” In Evans, J.St.,B.T.,
Frankish, K. (Eds.), IN TWO MINDS. DUAL ROCESSES AND BEYOND. Oxford: Oxford University Press. pp. 217 – 238. Cross-Cultural Decision Making (2019)
Campitelli, G., Labollita, M. (2010), “Correlations of cognitive reflection with judgments and choices”. JUDGMENT AND DECISION MAKING, Volume 5(3), pp. 182–191. Cools, E., Van den Broeck, H. (2007), „Development and validation of the Cognitive Style Indicator“. THE JOURNAL OF
PSYCHOLOGY, Volume 141, 359–387. Čavojová, V., Ballová Mikušková, E.,Hanák, R. (2013), “Preferencia k deliberáii: (ne)istota úspechu v kognitívnych úloháh”. In KOGNITIVNÍ VĚDA A UMĚLÝ ŽIVOT. Opava: Slezská univerzita v Opavě, pp. 53-58. Čavojová, V., Hanák, R., Bllová Mikušková, E. (2014), “Educating rationality: Assessing Master Rationality Motive in future
teachers”. In INTED2014 Proceedings. Denes-Raj, V., Epstein, S. (1994), “Conflict between intuitive and rational processing: When people behave against their better judgment”. JOURNAL OF PERSONALITY AND SOCIAL PSYCHOLOGY, Volume 66, 819–829. Donkers, B., Melenberg, B., van Soest, V. (2001), "Estimating Risk Attitudes Using Lotteries: A Large Sample Approach."
JOURNAL OF RISK AND UNCERTAINTY. Volume 22, No.2, pp. 165-95. Epstein, S. (2003), “Cognitive-Experiential self Theory of Personality”. In COMPREHENSIVE HANDBOOK OF PSYCHOLOGY (Vol. 5, pp. 159–184.). Epstein, S., Pacini, R., Denes-Raj, V., Heier, H. (1996), “Individual differences in Intuitive-Experiential and Analytical-Rational
Thinking Styles”. JOURNAL OF PERSONALITY AND SOCIAL PSYCHOLOGY, Volume 71, No.2, 390–405. Evans, J. S. B. T., Stanovich, K. E. (2013), “Dual-Process Theories of Higher Cognition: Advancing the Debate”.
PERSPECTIVES ON PSYCHOLOGICAL SCIENCE, Volume 8(3), pp. 223–241. Frederick, S. (2005), „Cognitive Reflection and Decision Making“. JOURNAL OF ECONOMIC PERSPECTIVES, Volume 19, No. 4. 25–42. Gigerenzer, G. (2008), “Rationality for Mortals. How people cope with uncertainty”. New York: Oxford University Press. Hanák, R. (2013), “Prediktívna validita dotazníkov merajúcich intuíciu” [Predictive validity of PID, REI and GDMS
questionnaires measuring intuition]. In R. Hanák, E. Ballová Mikušková, V. Čavojová (Eds), ROZHODOVANIE A USUDZOVANIE IV. APLIKÁCIE A LIMITY INTUÍCIe. Bratislava: ´´Ustav experimentálnej psychológie SAV. Kahneman, D., Frederick, S. (2002), “Representativeness revisited: At- tribute substitution in intuitive judgment.” In T. Gilovich, D. Griffin, & D. Kahneman (Eds.), HEURISTICS AND BIASES: THE PSYCHOLOGY OF INTUITIVE JUDGMENT. New York: Cambridge University Press, pp. 49–81. Kahneman, D.,Tversky, A. (1979), "Prospect Theory: An Analysis of Decision Under Risk." ECONOMETRICA. Volume 47,No.
2, pp. 263-91. Kahneman, D., Tversky, A. (1982), “On the study of statistical intuitions”. In D. Kahneman, P. Slovic, & A. Tversky (Eds.), JUDGMENT UNDER UNCERTAINTY: HEURISTICS AND BIASES. Cambridge, England: Cambridge University Press. pp. 493–508. Kirkpatrick, L.A., Epstein, S. (1992), “Cognitive-experiential self-theory and subjective probability: Further evidence for two
conceptual systems”. JOURNAL OF PERSONALITY AND SOCIAL PSYCHOLOGY, Volume 63, 534–544. Kostovičová, L., Konečný, M., Dudeková, K. (2013), “Čo to vlastne meriame? Reflexia testu kognitívnej reflexie : What do we actually measure? Reflection on the cognitive reflection test.” In OTÁZNIKY ROZHODOVANIA: TEÓRIA, EMPÍRIA, ŽIVOT: 31. Psychologické dni: zborník príspevkov. Editor Ivan Sarmány-Schuller. Bratislava : Stimul, pp. 166-171. Kovács, J. (2011), “Manažérské dovednosti”, Ostrava: VŠB - Technická univerzita. pp. 206. Myers Briggs, I., McCaulley, M. H., Quenk, N. L., Hammer, A. L. (1998), „MBTI Manual: A Guide to the Development and Use
of the Myers-Briggs Type Indicator“, Third Edit., p. 420. Palo Alto: Consulting Psychologist Press. Newstead, S. E., Handley, S. J., Harley, C., Wright, H., Farrelly, D. (2004), „Individual differences in deductive reasoning“. THE QUARTERLY JOURNAL OF EXPERIMENTAL PSYCHOLOGY. A, HUMAN EXPERIMENTAL PSYCHOLOGY, Volume 57, No.1. 33–60. Nickerson, R.S. (2008), “Aspects of Rationality. Reflections on what it means to be rational and whether we are.” New York:
Psychology Press. Oechssler, J., Roider, A., & Schmitz, P. W. (2009), “Cognitive abilities and behavioral biases”. JOURNAL OF ECONOMIC BEHAVIOR & ORGANIZATION, Volume 72(1), 147–152. Pacini, R., Epstein, S. (1999), „The relation of rational and experiential information processing styles to personality, basic
beliefs, and the ratio-bias phenomenon“. JOURNAL OF PERSONALITY AND SOCIAL PSYCHOLOGY, Volume 76, No. 6, 972–987. Saunders, C., Over, D.E. (2009), “In two minds about rationality?” In Evans, J.St.,B.T., Frankish, K. (Eds.), IN TWO MINDS.
DUAL ROCESSES AND BEYOND. Oxford: Oxford University Press. pp. 317 – 334. Sirota, M., Juanchich, M. (2011), “Role of numeracy and cognitive reflection in Bayesian reasoning with natural frequencies.”
STUDIA PSYCHOLOGICA, Volume 53(2), pp. 151–161. Sirota, M., Juanchich, M. Hagmayer, Y. (2013), “Ecological rationality or nested sets? Individual differences in cognitive processing predict Bayesian reasoning.” PSYCHONOMIC BULLETIN & REVIEW, Volume 06, DOI:10.3758/s13423- 013-0464-6 Sobyra, J. (2010), “The accuracy of self-reported intuitive and analytical ability.” HONORS PROJECT. Paper 140. Research
report. Stanovich, K. E. (2011), “Rationality and the Reflective Mind”. New York: Oxford University Press. Sternberg, R.J., Ed., (2002), „Why smart people can be so stupid?“ New Haven: Yale University Press. Toplak, M.E., West, R.W., Stanovich, K.E. (2013), „Assessing miserly information processing: An expansion of the Cognitive Reflection Test“, THINKING & REASONING, http://dx.doi.org/10.1080/13546783.2013.844729 Tversky, A., Kahneman, D. (1974), “Judgment under Uncertainty: Heuristics and Biases”. SCIENCE, Volume 185(4157), 1124– Cross-Cultural Decision Making (2019)
31. doi:10.1126/science.185.4157.1124 Witteman, C., van den Bercken, J., Claes, L., Godoy, A. (2009), “Assessing Rational and Intuitive Thinking Styles”, EUROPEAN JOURNAL OF PSYCHOLOGICAL ASSESSMENT, Volume 25 No. 1. 39–47.
Cross-Cultural Decision Making (2019)
LISTED IN THE AHFE DIGITAL BOOKSTORE CATALOGUE
Explore the complete digital volume
Advances in Cross-Cultural Decision Making
Read this individual research paper free through the original publisher, or explore the full digital proceedings book.
ISBN 978-1-4951-2095-4
Explore this ISBN in the AHFE Bookstore ↗Listed in the July 2026 bookstore catalogue; search by ISBN to confirm current availability · Digital book purchase optional