Junya Sugimoto, Hiroshi Hagiwara (2019). Effect of fNIRS on Physiological Index and Performance Under Vibratory Stimulus. In: Advances in Cognitive Engineering and Neuroergonomics. AHFE Open Access, vol. 7. https://doi.org/10.54941/ahfe100217
Many traffic accidents are caused by human error. In order to help prevent human such error, we investigated brain hemodynamics in both the frontal and the somatosensory areas by functional near-infrared spectroscopy (fNIRS), electrocardiogram (ECG), and the following two types of task performance with vibratory stimulation: a Tracking task and the Stroop test. To evaluate changes in oxygenated hemoglobin concentration (oxyHb), we used δoxyHb as previously defined (H. Iwasaki: Availability and future prospects of functional near-infrared spectroscopy in usability evaluation, Human Factors and Ergonomics). Briefly, the waveform data of oxyHb are passed through a differential filter. A sum of more than zero is defined as a positive component, whereas a sum of less than zero is defined as a negative component. δoxyHb is defined as a positive component minus a negative component. δoxyHb > 0 indicates an increasing trend of oxyHb and δoxyHb < 0 indicates a decreasing trend of oxyHb. Our results show that tracking error and the variance of tracking error were reduced when vibratory stimulation was present. Marginally statistically significant (p < 0.1) differences for both tracking and Stroop indices were observed when comparing measures with and without vibratory stimulation. These results suggest that subjects were able to track targets more stably with than without vibratory stimulation. On the other hand, performance on the Stroop test (reaction time, variance of Stroop test, and percentage of correct answers) was not affected by vibratory stimulation. ECG HF (high frequency) in both tasks was lower with than without vibratory stimuli. ECG LF (low frequency)/HF in both tasks was higher with than without vibratory stimuli. The results of HF and LF/HF stimulation imply the predominance of both the sympathetic nervous system during vibratory stimulation and the parasympathetic nervous system with no stimulus. δoxyHb showed differences in the somatosensory area during the Tracking task between vibratory stimulation and no stimulation. In summary, presentation of vibratory stimuli improved performance in the Tracking task. Therefore, use of vibratory stimulation during driving may decrease traffic accidents caused by human error.
Recently, developed countries have become 24-hour societies, characterized by nighttime shift work and long working hours. This transformation has led to an increasing number of traffic accidents caused by excessive fatigue. However, technological developments for preventing such accidents are currently being developed. Some vehicles are now equipped with sensors that can detect the amount of space between cars on the road. Major contributing factors to accidents include human fatigue and error; therefore, to investigate external stimuli useful for reducing human error and preventing traffic accidents, this study focused on vibratory stimuli.
People have two types of vibratory receptors: Meissner and Pacinian. Meissner receptors are sensitive to low frequencies. The most sensitive frequency of Meissner receptors is around 30 Hz. Pacinian receptors are sensitive to high frequencies. Pacinian receptors are more sensitive than Meissner receptors and are most sensitive to vibration around 200 Hz. Therefore, we adopted sine waves of 200 Hz to give vibratory stimulation to subject’s palms. In this experiment, we investigated whether vibratory stimulation (200 Hz) is effective for improvement in a Tracking task and a Stroop task.
EXPERIMENTAL METHOD Subjects
After obtaining informed consent, ten right-handed healthy subjects participated in the study (9 male, 1 female, range: 21-23 years). Blood hemoglobin concentration in the brain was measured used OMM3000 (Shimadzu, Japan), a near-infrared imaging device. The measurement sites of NIRS are shown in Figure 1. In this report we focus on the frontal area and the somatosensory area. This is because the frontal area is relevant to cognition, judgment, attention concentration and attention allocation functions and vibratory stimuli are categorized as somatosensory stimuli. We analyzed data from channel 1 (right frontal cortex), channel 6 (central frontal cortex), channel 11 (left frontal cortex), channel 14 (left somatosensory area), channel 19 (central somatosensory area) and channel 24 (right somatosensory area). In addition, electrocardiograms (ECG) were measured using Polymate (Digitex Lab. Co. Ltd., Japan). The sites of ECG electrodes were monitored by 4-lead ECG. Before attaching electrodes, subject’s skin was grazed by skin cream in order to reduce skin impedance.
Somatosensory area
13 14
1 2
15 16
17
3 4
5
18 19
6 7
CZ
10 9 8
22 21 20
24 23
12 11
Prefrontal cortex
: emitter : detector
Figure 1. Schematic indicating probe mounting position. Probe spacing is 3 cm. We analyzed channels 1,6,11 (prefrontal cortex) and channels 14,19,24 (somatosensory area). The NIRS probes of NIRS were positioned on each subject’s head according to the
Figure available in the original PDF paper.
international 10/20 system.
Tasks We prepared two types of tasks to be performed with vibratory stimulation: a Tracking task and a Stroop test (Figure 2). In the Tracking task, the participant is required to track a target which moves in a pattern, such as a figure-eight, with a computer mouse using their dominant hand. The target moves at a constant speed so the task is monotonous to perform. We calculated the tracking error following formula 1. We used the tracking error and the variance of tracking error to evaluate the Tracking task. In the Stroop test, the participant requires cognition and decision- making ability in order to think about the character and the color. For each trial, one word which means color is displayed on monitor. The subjects decide whether the meaning of word and the meaning of color are matched or not. Subjects step on a foot switch as soon as a character is displayed on a monitor. The computer mouse and the foot switch replicate car-driver responses such as a brake pedal or an accelerator pedal. We recorded the reaction time, the variance of reaction time and the percentage of correct answer following each Stroop test.
Figure 2. A schematic of the Stroop test. In the Stroop test, we prepared two foot switches. When the meaning of word and the meaning of color are matched (Figure 2, left), the subjects step on the left foot switch. On the other hand, when the meaning of word and the meaning of color are not matched, the subjects step on right foot switch. The words change every two seconds, and the subjects are required react within one second.
Figure available in the original PDF paper.
2+(Y−y) 2 (1)
E (t )=√( X−x)
Experimental Protocol Repeat three times
Figure 3. Schematic of the experimental design. The participants performed a rest condition for 60 s before and after the tasks in order to stabilize the NIRS waves. After the first rest condition, the following process was repeated three times: 60 s pre-rest; 300 s Tracking task; 10 s rest; 300 s Stroop test; 60 s post-rest.
Figure available in the original PDF paper.
The experimental protocol is shown in Figure 3. First of all, we observed a control condition for 60 sec. After the control condition, the protocol included a pre-rest (60 sec), Tracking task (300 sec), rest (10 sec), Stroop test (300 sec), and a post-rest (60 sec) in this order which was all repeated three times. Another control condition was observed for 60 sec following the three repetitions of the experimental conditions. This protocol was conducted with and without vibratory stimulation. Subjects were presented with a vibratory stimulus during the Tracking task and Cognitive Engineering and Neuroergonomics (2019)
Stroop test. This vibratory stimulus consists of 4 sec of interval time and 3 sec of vibratory (200 Hz) time, because Pacinian receptors have a fast adaption. Noise was created by a vibratory shaker, and therefore participants listened to white noise during this experiment. The order of presentation of the two conditions (with a vibratory stimulus or without a vibratory stimulus) was random. NIRS and ECG were measured from the start of this protocol.
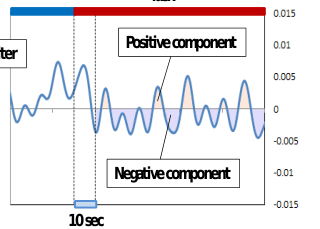
ANALYSISI Using NIRS, we can observe oxygenated hemoglobin concentration (oxyHb), deoxygenated hemoglobin concentration and total hemoglobin concentration. In this study, we focused on oxyHb, because oxyHb correlates with changes in regional cerebral blood flow. Some researchers argue that NIRS wave forms carry important information, because NIRS data is not absolute but relative in value compared to baseline measures. To assess NIRS wave forms, it is not enough just to calculate the average of oxyHb. In our previous study, we defined δ oxyHb in order to assess the NIRS wave form. First, we applied a Band pass filter (0.001 Hz to 0.1 Hz) to oxyHb (Figure 4 left). After BPF, we applied a differential filter to oxyHb (Figure 4 right). We regarded a result greater than zero following application of the differential filter to oxyHb as positive component, on the other hand we regarded a results less than zero as a negative component. We defined δoxyHb as the positive component minus the negative component. Using this value, termed δoxyHb, we can assess changes in oxyHb during the task. A positive value of δoxyHb (δoxyHb>0) indicates an overall increase in oxyHb level, and a negative value of δoxyHb (δoxyHb<0) indicates an overall decrease in oxyHb level.
Pre-Rest Task Pre-Rest Task Positive component
Differential filter
Negative component
10 sec
10sec
Figure 4. Representative data from one subject to illustrate the analysis procedure. The left panel shows oxyHb after BPF. The right panel shows these data after they have been passed through a differential filter. Initial 10 s of task was excluded to calculate δoxyHb because neurovascular coupling reaction takes 6 to 10 sec.
RESULTS
Tracking task The left plot in Figure 5 shows the average tracking error of 10 subjects with vibratory stimulation and without stimulation. The right plot in Figure 5 shows the average tracking error variance of 10 subjects with vibratory stimulation and without stimulation. The average tracking error with vibratory stimulation was 15.13±10.74 pixels compared to 18.76±22.48 pixels without vibratory stimulation. This difference in average tracking error is marginally, significantly different (p=0.076 < 0.1). The average tracking error variance with vibratory stimulation was 10.74±4.89 pixels compared to 26.25±22.48 pixels without vibratory stimulation. Again, this difference is marginally, significantly different (p=0.051 < 0.1).
+ p<0.1 (10%)
+ p<0.1 (10%)
60
30
+
50
25
+
40
20
30
15
pixels
pixels
20
10
10
5
0
0
vib-stimulus no-stimulus
vib-stimulus no-stimulus A B
Figure 5. The A bar chart shows the average tracking error of 10 subjects with vibratory stimulus and without stimulus. The B bar chart shows the average tracking error variance of 10 subjects with vibratory stimulus and without stimulus.
Figure available in the original PDF paper.
Stroop test The average reaction time of 10 subjects from the Stroop test with vibratory stimulation was 700.46±56.48 msec, compared to 695.81±63.87 msec without vibratory stimulation. The average reaction time variance of the 10 subjects from the Stroop test with vibratory stimulus was 104.28±18.42 msec, compared to 103.47±15.24 msec without vibratory stimulation. The average percentage of correct answers of 10 subjects from the Stroop test was 93.48±5.11%, compared to 92.57±5.59% without vibratory stimulation.
ECG (HF, LF/HF) The left plot in Figure 6 shows the average HF, which is normalized by each subject, for both vibratory stimulation and without vibratory stimulation in the Tracking task and the Stroop test. The right plot in Figure 6 shows the average LF/HF, normalized by each subject, with and without vibratory stimulation in the Tracking task and Stroop test. The average ECG HF in the Tracking task with vibratory stimulation was -0.198±0.572, compared to 0.580±0.724 without stimulation. The average ECG HF in Stroop test with vibratory stimulation was -0.381±0.589, compared to -0.001±0.461 without stimulation. There were marginally, statistically significant differences between HF in the Tracking task with a vibratory stimulus and without a vibratory stimulus (p=0.073<0.1). Average ECG LF/HF in the Tracking task with vibratory stimulation was 0.507±0.410, compared to -0.006±0.601 without stimulation. Average ECG LF/HF in the Stroop test with vibratory stimulus was -0.023±0.515, compared to - 0.479±0.464 without stimulation. There were marginally statistically significant differences between LF/HF in both tasks with a vibratory stimulus and without a stimulus (p=0.085<0.1 and p=0.093<0.1).
+ p<0.1
1.5
1.5 +
+ +
1
1
0.5
0.5
tracking with vib-stimulus tracking with no-stimulus
0
0
stroop with vib-stimulus stroop with no-stimulus
-0.5
-0.5
-1
-1
-1.5
-1.5
Figure 6. The left plot shows the average HF with vibratory stimulus and without vibratory stimulus in Tracking task and Stroop test. The right plot shows the average LF/HF with vibratory stimulus and without vibratory stimulus in Tracking task and Stroop test. The first bars of both plots are Tracking task with vibratory stimulus, the second bars of both plots are Tracking test without vibratory stimulus. The third bars of both plots are Stroop test with vibratory stimulus. The fourth bars of both plots are Stroop test without vibratory stimulus.
Figure available in the original PDF paper.
NIRS In this study, we focused on the frontal association area (via channels 1, 6, and 11) and the somatosensory area (via channels 14, 19, and 24). The left and right plots in Figure 7 show δ oxyHb for the Tracking task and Stroop test Cognitive Engineering and Neuroergonomics (2019) respectively, with vibratory stimulation and without vibratory stimulation. The δoxyHb values for the Tracking task from channels 1 and 11, which are frontal areas with vibratory stimulation, were larger than without vibratory stimulus. On the other hand, the δoxyHb values for the Tracking task from channels 14, 19, and 24, which are somatosensory areas with vibratory stimulation, were smaller than without vibratory stimulation. There are marginally, statistically significant differences between δoxyHb for the Tracking tasks in channel 19 with vibratory stimulation compared to without vibratory stimulation (p=0.053<0.1). The δoxyHb value for the Stroop test in all channels with vibratory stimulation was larger than without stimulation. There are marginally, statistically significant differences between δoxyHb for the Stroop test in channel 14 with vibratory stimulation compared to without vibratory stimulation (p=0.052<0.1).
1.8
0.9
0.8
1.6
0.7
1.4
+
0.6
1.2
0.5
+
1
0.4
vib-stimulus
0.3
0.8
no-stimulus
0.2
0.6
0.1
0.4
0
0.2
-0.1 -0.2 1ch 6ch 11ch 14ch 19ch 24ch 0
1ch 6ch 11ch 14ch 19ch 24ch
Figure 7. The left δoxyHb values for the Tracking task (left plot) and the Stroop test (right plot). Channel 1 represents the right prefrontal cortex, channel 6 represents the middle prefrontal cortex channel 11 represents the left prefrontal cortex, channel 14 represents the right somatosensory cortex, channel 19 represents the middle somatosensory cortex and channel 24 represents the left somatosensory cortex.
Figure available in the original PDF paper.
DISCUSSION
The tracking error and the variance of tracking error with vibratory stimulation were smaller than without vibratory stimulation. These results reveal that presenting vibratory stimulation results in more stability while tracking targets than without vibratory stimulation. ECG HF in the Tracking task and Stroop test with vibratory stimulation was smaller than without vibratory stimulation. In addition, ECG LF/HF in the Tracking task and Stroop test with vibratory stimulation were larger than without vibratory stimulation. Vibratory stimulation is interpreted predominantly by the sympathetic nervous system. On the other hand, the absence of vibratory stimulation is a parasympathetic nerve predominant state. Monotonous tasks such as the Tracking task are useful to determining if vibratory stimulation will improve performance.
δoxyHb values from channels 1, 6, and 11 for the Tracking task were not different between vibratory stimulation and no stimulation conditions. δoxyHb values from channels 14, 19, and 24 with vibratory stimulation were small compared to δoxyHb values from these channels without vibratory stimulation. This result means that hemodynamic aspects in the somatosensory cortex were decreased by vibratory stimulation, this result means that somatosensory cortex was refrained. δoxyHb values from all channels for the Stroop test with vibratory stimulation were larger than without vibratory stimulation. This result means that prefrontal cortex and somatosensory cortex are activated by vibratory stimulation.
In this study, we assumed that prefrontal cortex activation would correlate with task performance. However, there were not large δoxyHb differences between vibratory stimulation conditions for the Tracking task. On the other hand, there were large δoxyHb differences between conditions with vibratory stimulation and without vibratory stimulation for the Stroop test in prefrontal cortex. In contrast, δoxyHb values of the somatosensory cortex in the Tracking task with vibratory stimulation were smaller than without vibratory stimulation. This point is differennt to compare with the δoxyHb values for the Stroop test in somatosensory cortex. This somatosensory cortex was refrained may be related with the performance improvement of the Tracking task. Due to decrease of blood flow to the somatosensory area, other brain areas may increase blood flow, therefore the Tracking task performances may be improved. We must analyze and observe other brain areas such as the dorsolateral prefrontal cortex or brain areas that more directly control the Tracking task.
CONCLUSIONS
We suggest vibratory stimulation is valid for monotonous tasks such as the Tracking task. Our results imply that presenting vibratory stimulation improves performance on monotonous tasks. Therefore, use of vibratory stimulation during driving may decrease traffic accidents which are often caused by human error.
ACKNOWLEDGMENT
This study was supported by the Ministry of Education, Culture, Sports, Science and Technology (MEXT) - Supported Program for the Strategic Research Foundation at Private Universities, 2013-2017.
REFERENCES
Hiroaki.I, Hiroshi.H, (2012), “Availability and future prospects of functional near-infrared spectroscopy (fNIRS) in usability evaluation”, Human Factors and Ergonomics 27: 6368‒6377. Ofen N, Kao YC, Sokol-Hessner P, et al. (2007),“Development of the declarative memory system in the human brain”, Nat
Neurosci, 10: 1198-1205. Peifang T, et al, (2010), “Cortical depth-specific microvascular dilation underlies laminar differences in blood oxygenation leveldependent functional MRI signal” 107: 15246-15251, Roland S. J, Göran W, (1990), “Tactile Afferent Signals in the Control of Precision Grip, Attention and Performance” 13: 677‒
713 Sowell ER, Thompson PM, et al. (2004), “Longitudinal mapping of cortical thickness and brain growth in normal children”, J Neurosci 24 (38): 8223-8231. Taoka T, Iwasaki S, Uchida H, et al. (1998), “Age correlation of the time lag in signal change on EPI-fMRI”, J Computer
Assisted Tomography 22: 514-517.
LISTED IN THE AHFE DIGITAL BOOKSTORE CATALOGUE
Explore the complete digital volume
Advances in Cognitive Engineering and Neuroergonomics
Read this individual research paper free through the original publisher, or explore the full digital proceedings book.
ISBN 978-1-4951-2101-2
Explore this ISBN in the AHFE Bookstore ↗Listed in the July 2026 bookstore catalogue; search by ISBN to confirm current availability · Digital book purchase optional