Noritaka Komiyamaa, Hiroshi Hagiwarab (2019). Brain Activity During a Visual Stimulation Task Performed Alone and with an Auditory Task. In: Advances in Cognitive Engineering and Neuroergonomics. AHFE Open Access, vol. 7. https://doi.org/10.54941/ahfe100218
Dual processing of visual and auditory stimuli has been reported to reduce performance. However, assessment of brain activity during tasks that use both visual and auditory senses has seldom been reported. The purpose of this study was to compare brain activity during a visual reaction task performed alone and at the same time as an auditory task. Near-infrared spectroscopy was used to measure hemodynamic changes in the prefrontal cortex during task performance. Probes were placed on the surface of the scalp over the prefrontal cortex and the dorsolateral prefrontal cortex (Brodmann area 46). Brain activation patterns were measured during performance of a visual reaction task with and without concurrent performance of an auditory task. Oxygenated hemoglobin concentration was larger when the visual reaction task was performed alone than when the visual reaction task was performed with an auditory task. These results suggest that dual performance of visual and auditory tasks affected brain activity and that dual performance of visual and auditory tasks may reduce brain activity and performance.
Advances in technology have improved safety while driving and resulted in a decrease in traffic fatalities. However, careless driving remains a leading cause of traffic fatalities. One possible contributing factor is reduced attention, which is often a result of the use of a smart phone or car navigation system during driving. The use of a mobile phone during driving is potentially dangerous because the driver’s attention is diverted away from the road. Interference of spatial information processing of visual and auditory stimuli has been reported to reduce running stability (Azuma, 2004), and performance of a reading task was lower when the task was performed with music than when it was performed alone (Honma,2010). However, these assessments of performance do not directly measure attentional state, because they are influenced by external factors. Assessment of brain activity during tasks that involve both visual and auditory senses has seldom been reported. Human brain activity can be non-invasively measured using technologies such as positron emission tomography and functional magnetic resonance imaging. However, it is difficult to use these technologies when the subject is in a standing or sitting position. Near-infrared spectroscopy (NIRS) has lower spatial resolution, but can measure brain activity in a more natural state. The purpose of this study was to compare brain activity between a visual task and a dual visual and auditory task.
EXPERIMENTAL METHOD
PARTICIPANTS Eleven young healthy volunteers (10 male, one female, mean (SD) age: 21.6 (0.48) years, age range: 21-22 years) were recruited from a university to participate in this study. All volunteers were right-handed. Informed consent was obtained from each participant before the experiment, and all participants were instructed to rest well prior to the experiment.
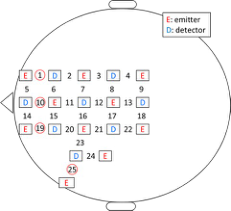
NIRS NIRS safely measures hemoglobin concentration of blood through the tissue. The NIRS device emits near-infrared light (wavelength range 700-900 nm) and analyses the amount of light that is transmitted through the tissue. The system allows non-invasive assessment of brain activity, and has a low cost and a has a high degree of flexibility under various measurement conditions compared to other systems for measuring brain activity such as functional magnetic resonance imaging and positron emission tomography. In this study, we used the OMM3000 system (Shimazu, Japan) to measure brain activity. This device uses three wavelengths of light (780, 805, and 830 nm) to measure changes in oxygenated hemoglobin (oxyHb) concentration, deoxygenated hemoglobin concentration and total hemoglobin (totalHb) concentration. The distance between emission and detector probes is 3 cm. The measurement sites are shown in Figure 1. We focused on the frontal probe and analyzed data from channel 1 (right frontal cortex), channel 10 (center frontal cortex), channel 19 (left frontal cortex) and channel 25 (dorsolateral prefrontal cortex, near Brodmann area 46). The frontal cortex is involved in cognition and judgment and the dorsolateral prefrontal cortex is involved in control and attention.
Figure 1. Attachment of the probes
MORPHING ANIMATION TEST (VISUALTASK)
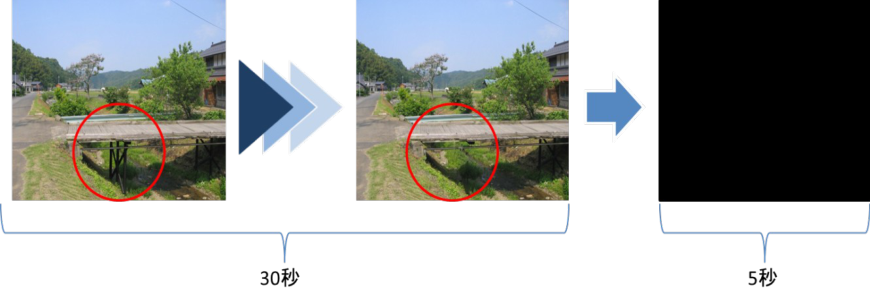
We designed an animation in which some items disappear from the screen or change color. The participants were required to press a button with their right hand as soon as they noticed items disappearing or changing color. There were five different animations. Each animation was repeated for a maximum of five times or until the participant noticed a change. The part of the animation that changed is circled in red. The animation changed gradually over a period of 30 s’. We inserted a black screen in between repeats of the same animation to prevent participants noticing the change when the animation restarted. Types of animation are at random per participants.
Before After
Figure 2. Morphing Animation Test (Performance Test)
VERBAL STIMULI STROOP TEST (AUDITORY TASK)
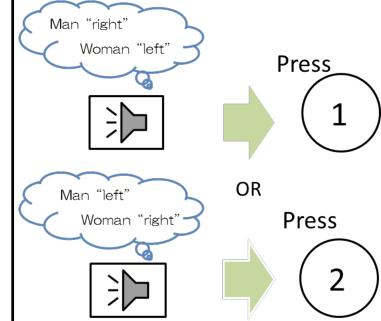
The verbal stimuli stroop test requires cognitive judgment. Participants were instructed to press button 1 if a man’s voice spoke the word “left” or a woman’s voice spoke the word “right”, and to press button 2 if a man’s voice spoke the word “right” or a woman’s voice spoke the word “left”. Both buttons were pressed with the left hand. The audio stimuli were presented through a speaker at a rate of one every 1.8–2.2 s. This task was performed at the same time as the animation test.
Figure 3. Schematic of the verbal stimuli stroop test
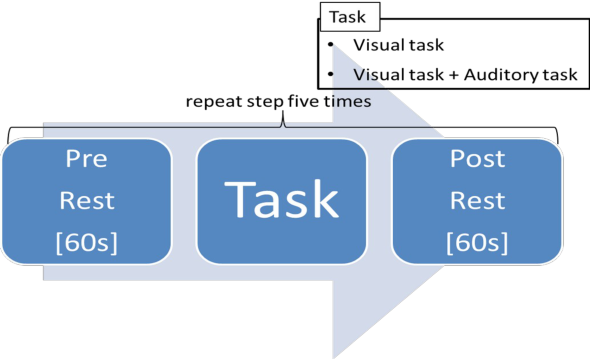
EXPERIMENTAL PROTOCOL The experimental protocol is shown in Figure 4. One block of trials consisted of 60 s pre-task rest, the task, and 60 s post-task rest. This procedure was repeated five times for each task. Participants were instructed to sit quietly with eyes open in the rest periods. The post-task rest began as soon as the participant pressed a button to indicate that they perceived a change in the animation. The attentional resources required for the visual task are larger compared to the task using both visual and auditory stimuli. Thus, participants performing the dual task that involved both visual and auditory stimuli made more careless mistakes compared to visual task. The two tasks were performed five times each in a random order. The visual task is the morphing animation test and the auditory task is the verbal stimuli stroop test.
Figure 4. Schematic of the experimental design
ANALYSIS The change in cerebral blood flow is most correlated with the change in oxyHb concentration. Analysis of totalHb concentration is only required if the participant has a blood circulation disorder. However, the participants in this study were young and healthy, and therefore had only a small chance of having a blood circulation disorder. Thus, we focused on oxyHb concentration. The NIRS data were digitally filtered at 0.01–0.1 Hz. A high-pass cut-off frequency of 0.01 Hz was used to eliminate baseline drift and a low-pass cut-off frequency of 0.1 Hz was used to remove artifacts. OxyHb concentration from 10 s before to 10 s after the moment that the participant pressed the button to indicate that they perceived a change in the animation was averaged across all trials. Normalization of oxyHb concentration averages was performed to obtain relative changes from baseline. δoxyHb was calculated according to the method reported in a previous study (Iwasaki, 2012) to evaluate oxyHb concentration in the 10 s before and after the button press. A differential filter was applied to the NIRS data. We summed the slope in the 10 s before and after the button press. δoxyHb > 0 indicates an overall increase in oxyHb concentration, and δoxyHb < 0 indicates an overall decrease in oxyHb concentration. We calculated standard variation of NIRS data that applied differential filter to assess variability of NIRS data.
BF
DF
1.5
0.025
1
0.02
0.5
0.015
0
0.01
slope
(mM・cm)
0.005
-0.5
0
-1
-0.005
-1.5
-10 -5 0 5 10
-10 -5 0 5 10
Figure 5. Schematic of analysis procedure
Figure available in the original PDF paper.
RESULTS
MORPHING ANIMATION RESPONSE TIME
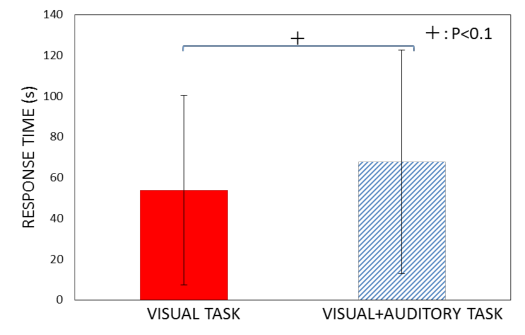
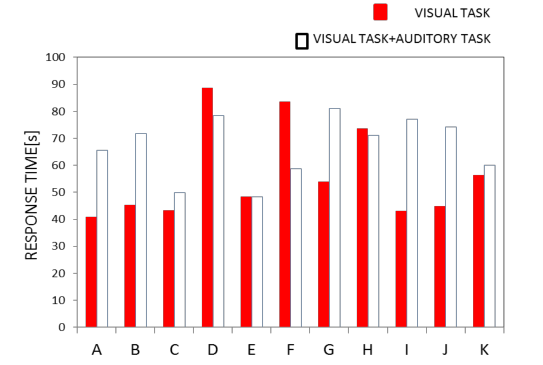
Figure 6 shows the average response time of all participants and the individual response time of each participant for the visual task when performed alone (average response time = 54 s) and when performed with the auditory task (average response time = 67 s). The response time was shorter when the visual task was performed alone (p < 0.1;
Figure 4). The response time was shorter when the visual task was performed alone for 63% of participants.
Figure 6. The average response time in the visual task (morphing animation)Figure 7. The average response time of each participant (morphing animation)
NIRS
Figure 8 shows the average oxy-Hb waveform across all subjects. These graphs show maximum value of oxy-Hb was 6-10 seconds after the participant noticed the change in the animation in both task.
VISUAL TASK VISUAL TASK+AUDITORY TASK PUSH BUTTON Left prefrontal cortex
Right prefrontal cortex
-10 -5 0 5 10 (s)
(s)
Central prefrontal cortex
Left dorsolateral prefrontal cortex
(s)
Figure 8. Average oxy-Hb waveform across all subjects
Figure available in the original PDF paper.
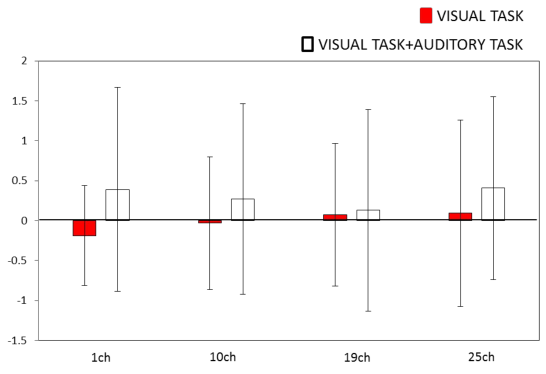
Figure 8 shows the δoxyHb values in the 10 s after the participant noticed the change in the animation. Channel 1 represents the right prefrontal cortex, channel 10 represents the central prefrontal cortex, channel 19 represents the left prefrontal cortex and channel 25 represents the left dorsolateral prefrontal cortex. δoxyHb was higher when the visual task was performed alone than when visual task was performed with the auditory task in channel 10 (central prefrontal cortex; p < 0.1) and channel 19 (left prefrontal cortex; p < 0.1).
VISUAL TASK VISUAL TASK+AUDITORY TASK
3
2
δoxyHb
1
0
Figure 9. The δoxyHb in the 10 s after the participant noticed the change in the animation
Figure available in the original PDF paper.
VARIABILITY OF THE NIRS WAVEFORM
Figure 10 shows the variability of NIRS data in the 10 s after the participant noticed the change in the animation. A differential filter was applied to the NIRS data and the standard variation was calculated for data that applied differential filter. Variability of NIRS data shows standard variation of this data. In all channels, the standard variation of the NIRS wave was lower when the visual task was performed alone than when the visual task was performed with the auditory task.
Figure 10. The standard variation in the 10 s after the participant noticed the change in the animation POWER IN THE HIGH-FREQUENCY COMPONENT OF HEART RATE VARIABILITY
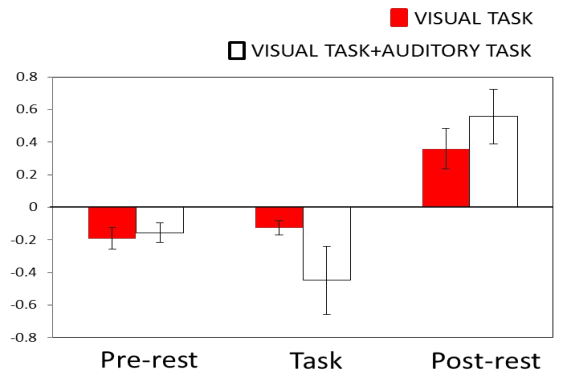
In the pre and post task periods, the participants were instructed to sit with eyes open for 60 s. The duration of the task depended on the response time. The power in the high-frequency component of heart rate variability was similar whether the visual task was performed alone or with the auditory task during pre task. However, the HF of the visual task only increased compared with the dual visual and auditory task during task. In post task, opposite results were obtained compared with task.
Figure 11. Mean power in the high-frequency component of heart rate variability
DISCUSSION
Previous studies show that practice can dramatically reduce dual-task interference (Ruthruff et al 2000). In this study, dual processing of visual and auditory stimuli increased response time for a visual stimulation task. We propose that interference of visual and auditory stimuli has a negative effect on performance. Attention resource is required to performance the cognitive task, and limited (Kawaguchi, 1995). Dual task involving visual and auditory stimuli required more attention resources than the visual task alone. The required increase in attention might have exceeded the upper limit of the attention resource capacity. However, dual processing increased response time in only 63% of participants. We think that the difficulty of the task may have been too low for the participants, and attention resource for visual task increased in 63% of participants during dual task. This coincides with the earlier studies (Cindy, 1994).
Previous researches show that increase of half of maximum value for amount of cerebral blood flow takes few seconds in arrear of nervous activity (Adams, 2008). In this experiment, Average maximum value of oxy-Hb was 6- 10 seconds after the participant noticed the change in the animation in both task. This result means that dual task does not influence for time to reach maximum. The δoxyHb after the participants noticed the change in the animation was higher when the visual task was performed alone than when it was performed with the auditory task in channel 10 (central prefrontal cortex) and channel 19 (left prefrontal cortex). This shows that brain activity was lower for the dual task than for the visual task performed alone. During the visual task, cerebral blood flow was divided between the prefrontal area and the visual cortex, whereas in the dual task, cerebral blood flow was divided between the prefrontal area, visual cortex and auditory area. Thus, the amount of cerebral blood flow in the prefrontal area was larger when the visual task was performed alone than when it was performed with the auditory task. We think that difference of attention resource influences difference of amount of cerebral blood flow. Many studies for NIRS measure only the amount of cerebral blood flow. We thought that dual processing exerts influence for variability of NIRS data, and calculated standard variation of NIRS data to assess influence for dual processing. The standard variation of the NIRS data was lower when the visual task was performed alone than when the visual task was performed with the auditory task in this experiment. This result means that dual processing decreased stability of brain hemodynamics. HF in the dual task was smaller than visual task only during task. We think that the participants are subjected to stress under condition large amount of attention resource compared to condition that amount of attention resource is small.
ACKNOWLEDGMENT
This study was supported by the Ministry of Education, Culture, Sports, Science and Technology (MEXT) - Supported Program for the Strategic Research Foundation at Private Universities, 2013-2017.
REFERENCES
Adams, S.M., Miller, K.E. (2008),” Pharmacologic management of adult depression”: American family physician, Volume77 No.6.pp786-792 Azuma, Y., Kawano, T. (2004), “Interferences of Semantic and Spatial Information Processing in Dual Task Performance
between Cell Phone Talk and Driving”, C70 (693), pp.1341-1347: Transactions of the Japan Society of Mechanical Engineers. Iwasaki, H., Hagiwara, H, 2012, Availability and future prospects of functional near-infrared spectroscopy (fNIRS) in usability evaluation,: Human Factors and Ergonomics 27: pp.6368‒6377. Kawaguchi, J. (1995), “Memory (cognitive psychology 2)”, Y.Takano (Ed.).pp 49-69 Monma, T., Honda, K. (2010), “Examination of the Impact of Verbal Information Contained in Music on Reading Task” :The
Japanese Journal of Ergonomics 46(5), pp.342-345 Ruthruff E., Johnston, J.C., Van Selst, M. (2001)”Why practice reduces dual-task interference”: Journal of Experimental Psychology: Human Perception and Performance, Volume 27 No 1. Yee, C.M., Miller, G.A. (1994),”Dual -task analysis of resource allocation in dysthymia and anhedonia: Journal of
Abnormal Psychology, Volume 103 No.4. pp.625-636
LISTED IN THE AHFE DIGITAL BOOKSTORE CATALOGUE
Explore the complete digital volume
Advances in Cognitive Engineering and Neuroergonomics
Read this individual research paper free through the original publisher, or explore the full digital proceedings book.
ISBN 978-1-4951-2101-2
Explore this ISBN in the AHFE Bookstore ↗Listed in the July 2026 bookstore catalogue; search by ISBN to confirm current availability · Digital book purchase optional