Akihisa Hirata, Koji Kitamura, Yoshifumi Nishida (2022). Visualizing Prioritized Typical and Potential Risks of Consumer Products by Graph Mining of an Accident Database. In: Advances in Ergonomics In Design, Usability & Special Populations: Part III. AHFE Open Access, vol. 20. https://doi.org/10.54941/ahfe1001300
Designing a safe product requires predicting how consumers will use the product and what sort of risks exist in their daily environment. However, assistive technology for risk assessment of consumer products used in the daily environment has not yet been established. One of the most promising approaches is to utilize data on actual accidents that have occurred in the past. This paper proposes a new method that uses recently developed data mining technology to predict the typical and potential risks of consumer products. The proposed method is as follows: 1) create a situational graph database by structuralizing accident data as a graph; 2) visualize the typical risk using this situational graph database; and 3) visualize the potential risk using two methods: a probabilistic latent semantic indexing (pLSI) method and a method based on the features of the product. Prioritizing design improvement requires considering severity of injury. To this end, a function for supporting severity control is also implemented. To demonstrate the effectiveness of the proposed system, we applied our system to a dataset of 681 cases of accidental burning or scalding injuries. Injury severity was evaluated using body area of burn and scald injuries.
Accidents due to consumer products regularly occur in our daily lives. Many of these accidents can be prevented by improving the products. According to a 2008 report on childhood injuries published by the World Health Organization (Peden et al., 2008), unintentional injury is a major killer of children under the age of 18 and, worldwide, is responsible for approximately 950,000 deaths per year. Thus, it is clear that safe product design is strongly needed. To design safe products, risk assessment is a useful concept (ISO, 1999; ISO, 2009; ISO/ICE, 1999). Figure 1 shows the steps in a typical risk assessment, which generally proceeds as follows: 1) identify the likely users and forms of use for the product; 2) identify the potential hazards; 3) estimate the risk, which is a combination of the probability of occurrence of an injury and the severity of that injury; and 4) evaluate the need for risk reduction. However, scientific and data-based risk assessment methodology has not been established. Currently, designers and other practitioners use their experience or intuition. Technology to formalize and assist in risk assessment is thus strongly needed. In recent years, an enormous number of accident situation reports have become publicly available. For example, the U.S. Consumer Product Safety Commission (CPSC) developed an accident
database and a retrieval system called the National Electronic Injury Surveillance System (NEISS); the U.S. Center for Disease Control and Prevention (CDC) developed an accident database called the Web-based Injury Statistics Query and Reporting System (WISQARS); and in Japan, the Consumer Affairs Agency (CAA) and the National Consumer Affairs Center of Japan developed the Japanese Accident Information Databank System. Our research group developed a childhood injury database that has been open to the public since 2008 (Tsuboi et al., 2008), (Nishida et al., 2009). Knowledge of the safe design and operation of consumer products has been developed, including several trials that have been carried out in Japan. For example, the well-known Failure Knowledge Database (Hatamura, 2009) is very advanced. The Knowledge Base for Building-Related Accident Prevention, developed by the National Institute for Land and Infrastructure Management, is also well known. However, these knowledge databases were created manually. Recently, many types of data mining and machine learning technology have been developed (Han et al., 2012). This new technology and the existence of a large amount of accident data are opening up new ways to develop assistive technology for creating knowledge on the safety of products. From this perspective, our research group has been developing technology for accident-data-aided design support. For example, Nomori et al. (Nomori et al., 2010) proposed a method that uses a Bayesian network to model and predict infant behavior and injuries; and Matsunaga et al. (Matsunaga et al., 2012) proposed a method that uses recent developments in graph structuralization methods and graph data mining technologies (Shawe-Taylor et al., 2004; Gärther, 2008; Neuhaus, 2007) to find typical patterns in the occurrence of injuries that are due to consumer products. In this paper, we propose a new technology that uses data mining methods to determine not only typical risks but also potential risks. In this paper, by potential risk, we mean the risk of an event that has not occurred in the past but that may occur in the future. To predict the potential risk, we use two methods: a probabilistic latent semantic indexing (pLSI) method (Hofmann, 1999) and a method based on the features of the products. The pLSI method determines the latent class by using dimension reduction and it is used for a clustering method for text data. We used this method to determine potential risks. Prioritizing design improvement requires considering severity of injury. In this paper, we focus on scalding and burning injuries and deal with a function for supporting severity control of scalding and burning injuries. To make evaluation of severity possible, we utilize the bodygraphic information system (BIS) that the authors have developed recently. The BIS allows us to compute injury body area. In this paper, we utilize injury body area as criteria on severity. In the next section, we describe the basic functions of our proposed system. Section 3 describes the implementation of the system implementation, and a demonstration of the system is described in Section 4.
METHOD FOR VISUALIZING TYPICAL AND POTENTIAL RISKS OF CONSUMER PRODUCTS
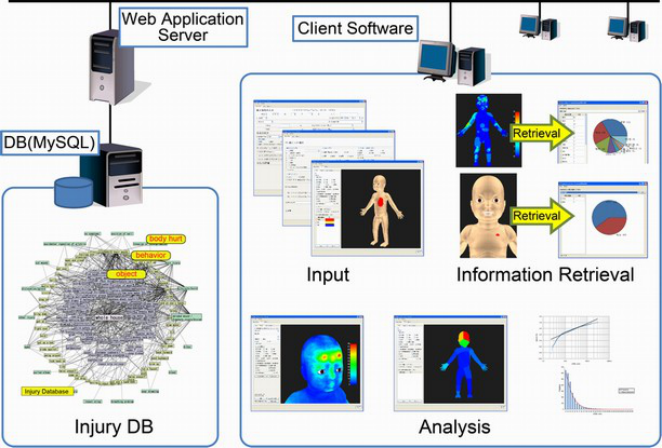
Figure 2 shows an overview of the proposed system for visualizing typical and potential risks of consumer products in the daily environment. The system has four basic functions.
Figure 2. Overview of typical and potential risk visualization system
Figure available in the original PDF paper.
Function for Structuralizing the Situation Graph Data Requirements
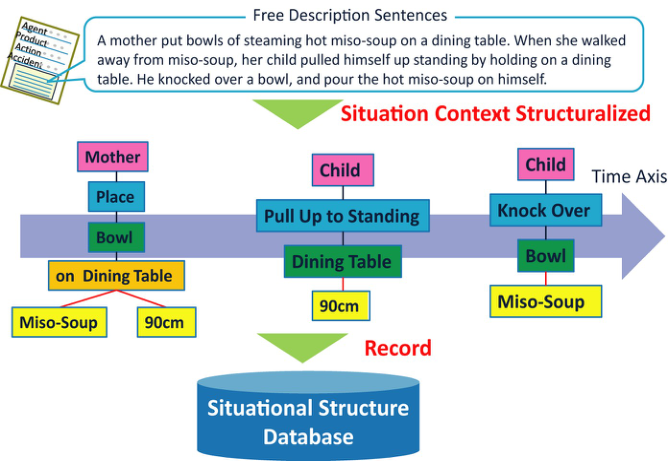
From the free descriptions of a situation, a user can create a situation graph from the situational structure data by extracting words that express agents (subjects), actions (verbs), and products (objects), and defining uses and accident situations related to the products as shown in Figure 3. In this paper, a situational structure includes two kinds of structural data: the relationships between the factors (such as persons, actions, and consumer products) and the changes over time of these relationships (Matsunaga et al., 2012).
Function for Visualizing Typical Risk The corresponding situation structure data can be searched for certain conditions defined by user input. The system summarizes the search results as a frequent-pattern tree so that the user can have an overview of the typical situations in which an accident occurs.
Function for Visualizing Potential Risk The system predicts the potential risk related to a target situation from a user-defined query. The situation structure data for the query are graphical data that consist of an agent (subject), an action (verb), and a product (object). The system then uses dimension-reduction data mining to predict the potential risk. The details are described in the next section. The system also summarizes the prediction results as trees so that the user can have an overview of the situations in which potential accidents may occur.
Function for Visualizing Feature-Based Risk The system predicts the potential risk related to certain user-queried features of a target product. This function allows the user to predict the potential risk related to a product for which there are no data on past accidents by searching the accidents due to products that have similar features. For example, when a user inputs the features of a speaker as a query, this function will find the accidents due to “heater” which is similar in size and upper-surface area. Unlike the previous function, this function predicts the potential risk related to the target product, not the target situation. Also, unlike the previous function, this function considers the positional risk, using predefined features, such as a thing that can rotate, a thing that can be held, or a thing that has a high temperature. Using these predefined product features, the system calculates the similarity between the products in the database and the target product, and summarizes and visualizes as trees the potential situations in which an accident may occur, based on the target features.
Figure 3. Process of situation structuralization
IMPLEMENTED SYSTEM FOR VISUALIZING TYPICAL AND POTENTIAL RISKS OF CONSUMER PRODUCTS Function for Structuralizing the Situation Graph Data
This function converts into a structured graph the narrative data that describe the situations in which accidents occur, and thus prepares it for data mining. Specifically, this function has two steps: the first extracts words from the free description, and the second creates situation graph structures from the relationships between the extracted words.
The words are extracted by using text-mining software (MeCab) (Kudo, 2004). To use this function, a user extracts the subjects, verbs, and objects that are necessary to explain the accident situations, and from this, a situation graph is created interactively. Using a graphical user interface (GUI) to make the selections, the user can create a graph structure that expresses the relationships between the elements (subjects: people; verbs: actions; and direct/indirect objects: items relevant to the actions). The candidates for the graph structure are as follows: “subject-verb”, “subject-verb-direct object”, or “subject-verb-direct object-indirect object”. The product names are extracted from the direct or indirect objects in the descriptive sentence. If necessary, the user can change nodes. For each accident registered, the current system allows the user to register a situation graph for up to five time steps (e.g., before the accident, during the accident, and after the accident).
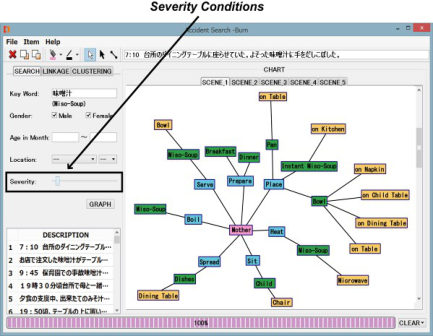
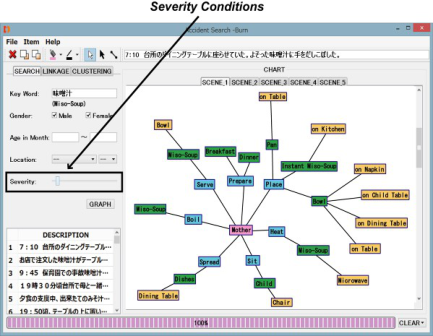
Function for Visualizing Typical Risks The system first searches for corresponding data in the situational graph data, using conditions, such as keywords, the age of the child in months, or places where the accidents occur. The search results are then visualized as a frequent pattern tree. The user can then inspect the frequent pattern tree, which, for each accident situation, consists of an agent, actions, related products, and the narratives. For example, as shown in Figure 4, if the user types in the keywords “miso soup”, the system searches for the corresponding situational graph data related to “miso-soup”. Using the GUI, the user can also change tabs to see the frequent pattern trees by each time step (e.g., before the accident, during the accident, and after the accident).
Figure 4. Summary of a visualization of an accident situation
Figure available in the original PDF paper.
Function for Visualizing Severity of Injury
Figure 5 shows the configuration of a bodygraphic information system that our research group has developed (Tsuboi et al., 2008; Nishida et al., 2009). The bodygraphic information system (BIS) consists of injury database system, a web server, and a client software. The client part of the BIS has four functions: input, retrieval and analysis, database construction, and visualization. In BIS, we can input information by typing in text data or outlining on a three-dimensional human body model with a computer mouse, and then the input data is digitized into a raster model and relevant information can be obtained. All input data is stored in a database for retrieval, analysis, and visualization according to need.
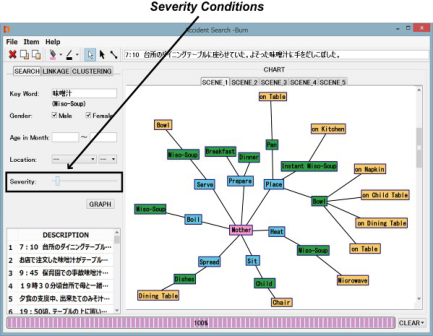
The BIS has the following functions: 1) input/output function, 2) information retrieval function, 3) ICD-10 Code Conversion Function, and 4) statistical analysis functions. As for the function 1), using the BISS, shape data of an external injury is drawn on the three-dimensional human body model with a computer mouse and other text data is typed in with a keyboard. The input injury data is converted to raster data and stored in a database system. Since the standard human body model is used, injury data is normalized. As one of the statistical analysis functions, the BIS can calculate injury body area. In this paper, we utilize injury body area as criteria on severity. As shown in Figure 6 and Figure 7, the user can see relationship between injury severity of burning and scald and accident situation structure by changing a severity condition bar on the software. Figure 6 and Figure 7 shows how accident situation structure changes in terms of severity. The user also can see injury area by selecting situational structure. Figure 8 shows an example of injury area corresponding to the selected situational structure “Mother / Place / Pan / on Table” from BIS database.
Figure 5. Bodygraphic Information SystemFigure 6. Example of a visualization of a situation structureFigure 7. Example of a visualization of a situation tree including of low severity structure tree including of high severityFigure 8. Example of injury area corresponding to the selected structure
Function for Visualizing the Dimension-Reduction-Based Potential Risks This function predicts the potential risks by finding similar situations that resulted in accidents. We used the pLSI method (Hofmann, 1999) in this study. The pLSI method is a useful method for clustering binary relations. We now give a concrete explanation of how we used the pLSI method for predictions. First, the system divides the situation graph data into two structures: One contains the relationships between agents and actions and the other contains the relationships between actions and products. Second, the pLSI method is applied separately to each of these two datasets (“agent and actions” and “actions and products”). Third, the system determines the latent classes of “agent and actions” and those of “actions and products”. The system then combines the latent classes of “agent and actions” with those of “actions and products” by considering if both latent classes include the same action. Finally, the system visualizes the potential risks as agent-actions-products trees so that the user can see a graph of the potential risks related to the target situation.
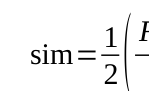
Function for Visualizing Feature-Based Potential Risks This function requires predefined product features. We manually defined 48 product features by using text-mining software to analyze the data for over 20,000 cases. The 48 features were divided into four categories (1: functional feature; 2: form, size, weight; 3: material feature; 4: type of use, kind of product) (Nomori et al., 2010). We developed a GUI for registering the features of the products in the database; an example of this is shown in Figure 4. The user can easily register product features by selecting from icons representing 48 different product features. Since it may be difficult for a user to recognize a feature when only given the name of the product, we developed an online image-search function that allows the user to obtain web images that match the product’s name and thus enables the user to register suitable features. Let N be the number of features that are input, and let Fs1...FsN be the features that are obtained as the result of searching based on expressions Fp1...FpM; then we define the similarity of objects as
Equation reproduced from the original PDF.
+ Fs∩F p
2( Fs∩Fp
Fs
Fp ) (1)
EVALUATION OF THE DEVELOPED SYSTEM USING DATA FROM REAL ACCIDENTS Search Examples Using Function for Predicting and Visualizing Dimension-Reduction- Based Potential Risks
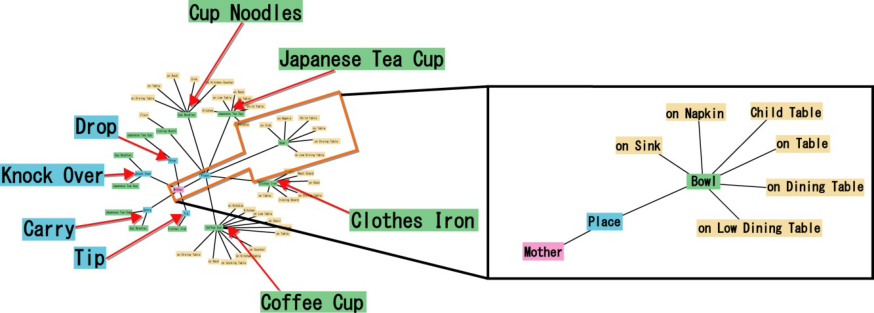
To confirm the effectiveness of the developed system, we applied the proposed method to actual data from accidents (Tsuboi et al., 2008; Nishida et al., 2009), which we collected in cooperation with a medical institution. From this database, we selected 681 accidents resulting in potentially severe burns. For example, the free description, “A mother put bowls of steaming hot miso-soup on a dining table. When she walked away from miso-soup, her child pulled himself up standing by holding on a dining table. He knocked over a bowl, and pour the hot miso-soup on himself.” is converted into the following three expressions: “Mother / Place / Bowl / on Dining Table”, “Child / Pull Up to Standing / Dining Table”, and “Child / Knock Over / Bowl / Miso-Soup”. Situations similar to “Mother / Place / Bowl / on Dining Table” are shown in Figure 9. From this situation graph of potential risks, we see that, besides a dining table, the mother can also put miso-soup on a sink, a tea table, or a child’s table. If we focus on the object that is placed, then similar situations include a cup of noodles, a Japanese tea cup, coffee, or a clothes iron. If we focus on the action, then similar situations include drop, knock over, fall, or carry. The above example for a scenario in which a child is burned or scalded suggests that it is not only the child who can take actions that lead to accidents, but other people in the child’s environment may take various actions that lead to accidents.
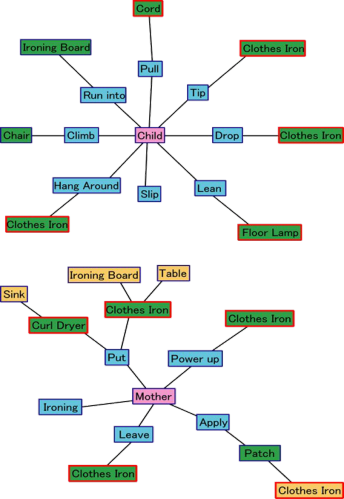
Search Examples by Using the Function for Predicting and Visualizing Product-Feature- Based Potential Risks We manually added 48 features to 516 products involved in 681 burn accidents. Figure 10 shows examples of searching for items similar to a steam cleaner, which was not included in reports of past accidents with burning or
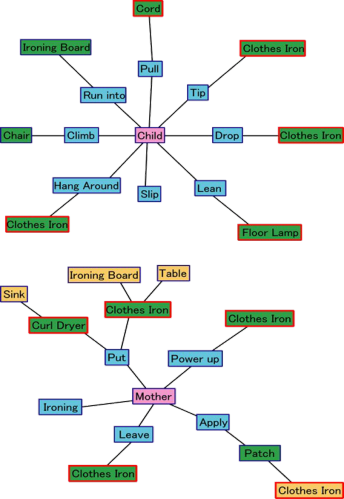
Figure 9. Example of a visualization of a situation structure tree using dimension-reduction-based analysisFigure 10. Example of a visualization of a situation structure treeFigure 11. Example of a visualization of a situation using dimension-reduction-based analysis structure tree using feature based analysis scalding injuries. For example, when we input the following features: home electronics, thick sticks, hard materials, liquid, can be held, high temperature, and has string, the search results include the following items: clothes iron,
floor Lamp and curling iron. Figure 11 shows examples of situation-structures that give the actions for these products. For example, from “a child leaned a floor lamp”, the system predicts that a child may lean a steam cleaner when it is placed on a low surface, such as a floor. From “a child dropped a clothes iron”, the system predicts that a child may drop a steam cleaner when it is placed where the child can reach it. Finally, from “a child pulled a cord”, we can predict that a child may be injured by a falling steam cleaner if the cord is pulled, even if the cleaner itself is beyond the child’s reach. Thus, the user is able to understand the potential risks of a steam cleaner by seeing the potential risks related to products that have similar features.
CONCLUSIONS
In this paper, to assist in the design of safe consumer products that are to be used in daily living, we proposed a new method for visualizing not only the risks that are typical to given consumer products, but also the potential risks. Our proposed system consists of 1) a function for creating a database by structuralization of the situation data from accidents, 2) a function that uses this database to visualize the typical risks, and 3) a function that visualizes the potential risks via two methods: a pLSI method and a feature-based method. The system also has a function for supporting analysis of relation between severity of scalding and burning injuries and accidental situation structures as a sub function of the second function of typical risks visualization. This allows the user to prioritize design improvement severity of injury taking into considering. We confirmed the effectiveness of this system by using the data of 681 accidents involving scalding or burning injuries. We consider the following to be areas of important future work: applying this system to accidents other than those resulting in scalding or burning injuries, and collaborating with manufactures in order to evaluate the effectiveness of this system for supporting safe designs.
REFERENCES
Gärther, T. (2008), “Kernels for Structured Data”, World Scientific Publishing. Han, J., Kamber, M., Pei, J., (2012), “Data Mining”, Morgan Kaufmann Publishers. Hatamura, Y. (2009), “ Learning from Design Failure”, Springer. Hofmann, T. (1999), “Probabilistic Latent Semantic Indexing”, Proc. of The 22th Annual ACM Conference on Research and Development in Information Retrieval, pp. 50–57. ISO. (1999), “ ISO14121: Safety of Machinery. Principles of Risk Assessment”. ISO. (2009), “ ISO3100: Risk Management—Principles and Guidelines”. ISO/ICE. (1999), “Guide 51 Safety Aspects—Guidelines for Their Inclusion in Standards”. Kudo, T., Yamamoto K. and Matsumoto. Y. (2004), “Applying Conditional Random Fields to Japanese Morphological
Analysis”, Proceedings of the 2004 Conference on Empirical Methods in Natural Language Processing (EMNLP-2004), pp.230-237. Matsunaga, T., Kitamura, K., Nishida, Y. and Takemura, H. (2012), “Situation Analysis Based on Graph Structuralization”, Proc. of The 2012 International Conference on Information and Knowledge Engineering (IKE’12), pp. 122–128. Neuhaus, M., Bunke, H. (2007), “Bridging the Gap between Graph Edit Distance and Kernel Machines”, World Scientific
Publishing. Nishida, Y., Motomura, Y., Kitamura, K. and Yamanaka, T. (2009), “Representation and Statistical Analysis of Childhood Injury by Bodygraphic Information System”, Proc. of The 10th International Conference on GeoComputation, pp. 194–202. Nomori, K., Nishida, Y., Yamanaka, T. and Komatsubara, A. (2010), “Constructing Relationship Dictionary among Product,
Behavior and Injury for Product Safety Design: Linkage Service for Foreseeing Usage of Product Based on Injury Data”, Proc. of Japanese Domestic Conference of Japan Ergonomics Society, pp. 140–141. Nomori, K., Nishida, Y., Motomura, Y., Yamanaka, T. and Komatsubara, A. (2010), “A Method of Evidence-Based Risk Assessment through Modeling Infant Behavior and Injury”, Proc. of The 3rd International Conference on Applied Human Factors and Ergonomics (AHFE). Peden, M., Peden, M., Oyegbite, K., Ozanne-Smith, J., Adnan A Hyder, C. B., Rahman, A. F., et al. (2008), “World report on
child injury prevention.” Switzerland: WHO Press. Tsuboi, T., Nishida, Y., Mochimaru, M., Kouchi, M. and Mizoguchi, H. (2008), “Bodygraphic Information System”, Proc. of The 9th World Conference on Injury Prevention and Safety Promotion, p. 79. Shawe-Taylor, J., Christianini, N. (2004), “Kernel Method for Pattern Analysis”, Cambridge University Press.
LISTED IN THE AHFE DIGITAL BOOKSTORE CATALOGUE
Explore the complete digital volume
Advances in Ergonomics In Design, Usability & Special Populations: Part III
Read this individual research paper free through the original publisher, or explore the full digital proceedings book.
ISBN 978-1-4951-2108-1
Explore this ISBN in the AHFE Bookstore ↗Listed in the July 2026 bookstore catalogue; search by ISBN to confirm current availability · Digital book purchase optional