Oksana Isaeva, Marina Boronenko, Yura Boronenko (2022). Optical Diagnostics of the Dispersion Composition of Fuel-Air Flare. In: Production Management and Process Control. AHFE Open Access, vol. 36, pp. 128–135. https://doi.org/10.54941/ahfe1001627
One of the central problems of using heavy hydrocarbons as fuel for thermal burners and internal combustion engines is mixture formation. The purpose of this article is to present the results of optical diagnostics of the dispersion composition of a fuel-air torch according to the developed method. The technical means of the information acquisition and processing system can be a high-speed micropyrometric complex for measuring temperature and flame propagation velocity, the main elements of which are a personal computer and a VideoSprint high-speed video camera. The software includes the Origin data analysis package and ImageJ, a free image processing program. The peculiarity of the video camera is that it can detect low-intensity radiation due to amplification in microchannel plates, and the speed and multi-frame exposure is provided by an electronic shutter. To use video cameras as high-speed pyrometers, their preliminary calibration is necessary. During the calibration of the video camera, the non-linearity of the response of the measuring system depending on the exposure time was revealed. The study of the injection process in diesel mixture formation requires reliable information on the relationship between the speed characteristics of the fuel jet and the dynamics of the fuel supply cycle. Optical research methods do not destroy the structure of the fuel plume and allow obtaining information about the structure and dynamics of the flame development. The technique also makes it possible to obtain data on the root angles of fuel plumes and to estimate the distribution of aerosol particles along their length. For analysis, an experimental frame of the fuel atomization process was taken, made in the Videoscan VS-SST-285 system with an exposure of 39 µs, the delay time of the sync pulse from the pressure sensor was 300 µs. From the analysis of the fuel jet, it was found that the maximum fuel concentration is observed at the atomizer, in the initial zone of the jet and in the front (less than at the atomizer), and there is also a deviation of the torch core axis from the nozzle axis. As experiments show, a change in the angle of the spray cone by 10° and a deviation of the axis of the cone from the axis of the nozzle are permissible by 3-5°. Obtaining data for processing using a high-speed micropyrometric complex can greatly improve the quality of diagnostics. The result of experimental data processing according to the proposed method is consistent with the previously obtained results, which indicates great prospects for further development of this express diagnostic method to obtain numerical characteristics of fuel jet dispersity and improve the ecology of heavy hydrocarbon combustion processes.
One of the central problems of using heavy hydrocarbons as fuel for thermal burners and internal combustion engines is mixture formation. The efficiency of the working process, the rate of pressure increase during combustion, the maximum pressure, smoke and toxicity of exhaust gases, as well as the star- ting properties of a diesel engine, directly depend on atomization, mixture formation, ignition and subsequent combustion of the fuel.
During the processes occurring in the combustion chamber of the engine, a large number of gaseous and solid components are formed. When expe- rimentally determining the flame temperature in the combustion zone from the radiation of combustion products, especially for rarefied flames, che- miluminescence is often observed, leading to large measurement errors. A nonequilibrium distribution of energy over degrees of freedom is observed in fast processes (for example, in an explosion). In this case, one should speak of translational, rotational, vibrational, and electron temperatures. Attempts to record the temperature optically will lead to an underestimation of the thermodynamic temperature. However, this error becomes noticeable only
Optical Diagnostics of the Dispersion Composition of Fuel-Air Flare 129
for rarefied flames; for an ordinary flame burning at atmospheric pressure, with an appropriate choice of the working region of the spectrum and the measurement method, as a rule, flame radiation can be considered thermal (Gulyaev P., 2009). During the combustion of fuel, the sources of thermal radiation are solid particles, for example, soot particles. Moreover, the main part of the thermal radiation of soot particles falls on the visible wavelength range. This makes it possible to optically diagnose the processes occurring in the combustion chamber. In the manufacture of fuel atomizers, even small deviations from the passport dimensions of the constituent parts and assem- blies lead to a deterioration in the quality of atomization. The process of spraying-mixture formation in the engine combustion chamber is transient on the order of a millisecond, therefore, it is practically impossible to distin- guish local heterogeneities in the air-fuel flow without special instruments (Gulyaev I., 1997). Thus, the development of a method that makes it possi- ble to record the parameters of the plume with the required spatiotemporal resolution in real time during the experiment is of considerable scientific and practical interest (Gulyaev P., 1999, Ostrenko, 1973). This work presents the result of processing experimental data using the developed method for obtai- ning quantitative characteristics of the jet torch: root angles of fuel torches, their length, the presence of local thickenings and jets.
The purpose of this article is to present the results of optical diagnostics of the dispersion composition of a fuel-air torch according to the developed method.
When determining the temperature of a flame that is inhomogeneous in Z (the ratio of fuel and oxidizer), the dependence of temperature T on Z can be calculated theoretically and is a curve with a maximum lying near a value equal to the stoichiometric value. The processes of mixing fuel and oxidizer are a random process, therefore, it is described by the Gauss formula. Thus, the probability that at a given moment of time, in a given microvolume of the flame, the ratio of oxidizer and fuel will be equal to some value of Z, different from the average value of Z0. The probability of deviation of the concentration of fuel introduced into a homogeneous air flow at a given time or in a given micro-region of the flame from its average value (1): e−h2(Z−Z0)2dZ, (1)
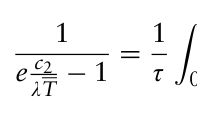
where h=0.7/σ, σ is the standard deviation of Z from its mean value Z0. This probability is the smaller, the more Z differs from Z0. The dependence of temperature T on Z can be calculated theoretically and is a curve with a maximum lying near a value equal to the stoichiometric value. The average optical temperature T is determined from relation (2):
2
1
Z0
R ∞
dZ
0 e −h2 Z−Z0
1
e
c2 λT(Z) −1
=
Equations and mathematical formulas are available in the original paper PDF.
e
c2 λT −1
Z0
R ∞
0 e −h2
When measuring the temperature of a flame or a portion of a flame with a non-uniform or time-varying temperature field using optical pyrometry,
we will measure a certain average optical temperature [Gulyaev P., 1997, Gulyaev P., 2000), which, due to the non-linear dependence of the radiation intensity on temperature, will not coincide with the average mass, arithmetic average, maximum flame temperatures.
When measuring the brightness temperature of a flame, for a flame with a non-uniform temperature field, we will measure the average optical brigh- tness. The relationship of this temperature with the average true temperature is determined by the well-known formula (3):
1
−λ
Equation reproduced from the original PDF.
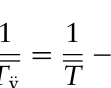
ln ελT, (3) c2 T Tÿ
where ελ is the emissivity for wavelength λ.
Due to the non-linear nature of averaging inherent in optical methods (regardless of whether this is averaging over space or over time), the ave- rage optical temperature will not equal the true, average temperature of the flame around which the temperature pulsation occurs, and this difference will be more than the shorter wavelength. Along with a spatially inhomo- geneous temperature field, flames exhibit periodic temperature changes with time, even when fuel and oxidizer are supplied continuously. The combustion process itself is accompanied by a temperature pulsation. The average opti- cal temperature is found from the relation, and the averaging occurs not over space, but over time (4):
1
Z τ dt, (4) τ
1 e c2
0
c2 λT(t) −1
e
Equation reproduced from the original PDF.
where τ is the period of pulsations, T(t) characterizes the change in tempera- ture with time, i.e., we find the temperature of such a stationary flame, the monochromatic brightness of whose radiation is equal to the time-averaged monochromatic brightness emitted by the pulsating flame.
By determining the average optical temperature using a high-speed micropyrometric complex, it is possible to carry out more subtle diagnostics with a microsecond time resolution. In this case, the measurement can be con- sidered “instantaneous”, because the measurement time is much less than the smallest period of temperature fluctuations in the flame. It is possible to con- sider that we are measuring the temperature at a point in those cases when, within the volume allocated by us, both monotonous temperature changes and the inhomogeneity of the flame in terms of the ratio of fuel and oxidi- zer can be neglected. These conditions for different flames are satisfied for different values of the allocated volume and measurement time.
EXPERIMENTAL SETUP The technical means of the information acquisition and processing system can be a high-speed micropyrometric complex for measuring temperature and flame propagation velocity, the main elements of which are a personal computer and a VideoSprint high-speed video camera. The software inclu- des the experimental data analysis package Origin and the freely distributed
Optical Diagnostics of the Dispersion Composition of Fuel-Air Flare 131
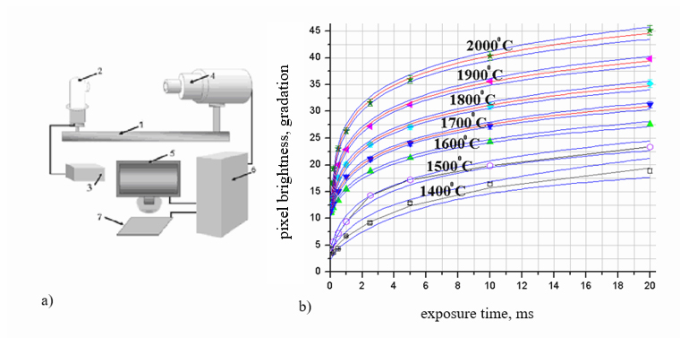
Figure 1: a) Calibration stand: 1 - optical bench; 2 - reference lamp TRU1100-2350; 3 - current source PSH-2035; 4 - high-speed camera VideoSprint; 5 - monitor; 6 - system unit; 7 - keyboard; b) Graph of image pixel brightness versus exposure time at constant lens illumination.
image processing program ImageJ (Gulyaev P., 2012). The peculiarity of the video camera is that it can detect low-intensity radiation due to amplification in microchannel plates, and the speed and multi-frame exposure is provi- ded by an electronic shutter. To use video cameras as high-speed pyrometers, their preliminary calibration is necessary. During the calibration of the video camera, the non-linearity of the response of the measuring system depending on the exposure time was revealed. The calibration stand is shown in Fig. 1.
An experimental study of the response of the measuring system with a constant illumination of the lens at different exposure times was carried out using a reference lamp TRU 100-2350 (Gulyaev P., 1997). Depending on the current supplied to the TRU 100-2350 reference lamp from the PSH-2035 source, the tungsten filament of the lamp has a different temperature and brightness. Also, depending on the exposure time, a two-dimensional image of a tungsten filament obtained by a video camera is obtained with different brightness.
The image of the tungsten filament was presented in gray scale. All curves approximated from the experimental data are logarithmic functions of the pixel brightness as a function of the accumulation times. In this case, the approximation error does not exceed 2%.
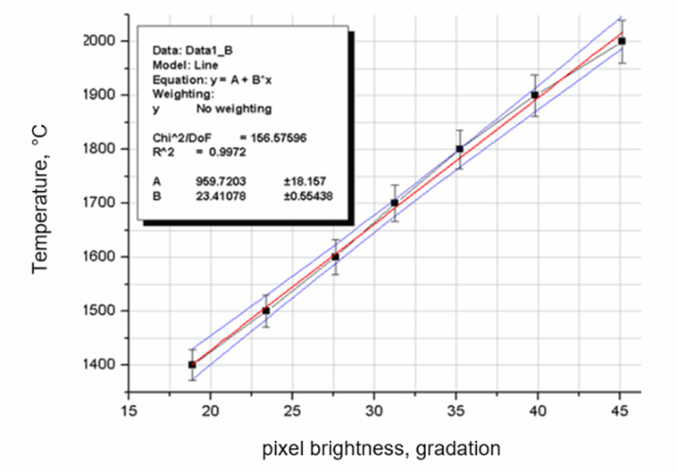
So, for the light flux corresponding to the temperature T=17000C, the transfer function of the measuring system is y=a-b*ln(x+c), coeffici- ents a=15.68534±0.3598, b=-5.07267±0.16345, c=0.38808±0.04772. By matching the current supplied to the lamp and the brightness of the image pixels, it is possible to introduce a new calibration scale that relates the brigh- tness of the image pixels and the temperature of the luminous object recorded by the video camera at a given exposure. The graph of the approximated function is shown in Fig. 2.
The introduced scale makes it possible to use this optoelectronic measuring system as a high-speed micropyrometer.
Figure 2: Approximate function of image pixel brightness correspondence to tempe- rature (2% error).
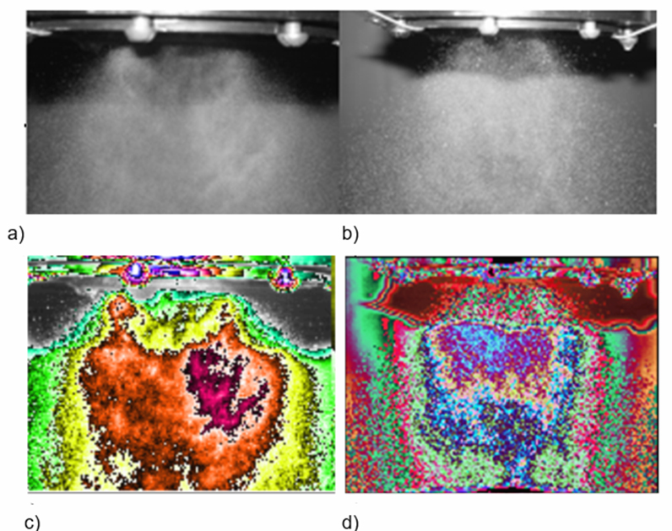
RESULTS OF DATA PROCESSING ACCORDING TO THE PROPOSED METHOD To test the technique, we used schlieren photographs of the fuel-air torch of the new injector module and the spray torch for the original device at 3 kPa air pressure drop, taken from (Gulyaev P., 2012, Gulyaev P., 2008) and shown in Fig. 3.
It is known that when fuel is sprayed through injector nozzles with small holes in the cylinder, an annular flame is formed from small fuel particles. Particles of fuel in the form of a torch should fill the entire space of the chamber, but not reach the walls of the piston of the cylinder and burn out in suspension. When visually observed, the injected fuel should be misty, without continuous streams and easily distinguishable local thickenings.
In the photo of the new module, prepared for gradient analysis, it is noti- ceable that the formed mixture has a more finely dispersed composition, therefore, it ensures the completeness of combustion due to more complete mixing in the turbulent boost mode. However, some asymmetry and optical inhomogeneities of the mantle of the fuel-air mixture of injected fuel are also noticeable, which indicates the possibility of improving this module in the future.
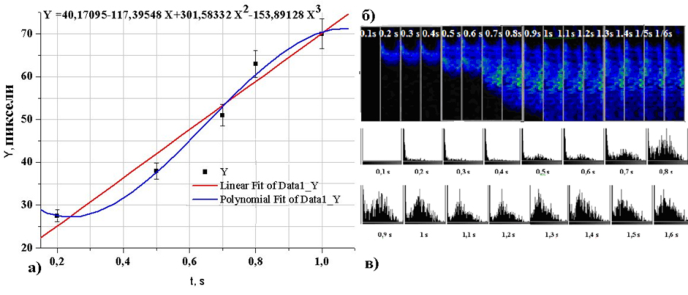
To test the methods for calculating the speed of a two-phase fuel-air jet, given in Svistula, 1999), a video fragment of high-speed video filming of the process of fuel atomization by a Nissan Atlas injector, shown in Fig. 4 b, was used.
The position of the jet front was determined from the front maximum of the brightness gradient and its motion graph is shown in Fig. 4a, where the
Optical Diagnostics of the Dispersion Composition of Fuel-Air Flare 133
Figure 3: Photographs of a) the new nozzle module and b) the spray jet for the original device at 3 kPa air pressure drop; Fuel plume image processing: Bayesian restora- tion of “pseudo” optical density color; heterogeneity gradient; isolines of density; dispersion and its gradient; c) a new module; d) original module.Figure 4: a) Plot of dependence of the fuel jet front coordinate on time; b) Changes in the optical inhomogeneity of the investigated jet over time; c) Histograms of areas of isotemperature zones of the jet.
coordinates of the points of maximum distance from the spray point were plotted along the Y axis. The distance is given in pixels. On the x-axis, the corresponding point in time.
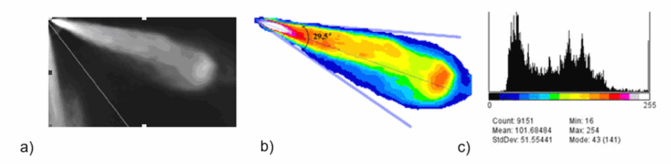
The technique also makes it possible to obtain data on the root angles of fuel plumes and to estimate the distribution of aerosol particles along their length (Kadyshevich, 1962). For analysis, an experimental frame of the fuel
Figure 5: a) Digital photo of the torch; b) Isotemperature zones highlighted in the image of the fuel jet; c) Histogram of isotemperature zones of the fuel jet.
atomization process was taken, obtained in (Gulyaev P., 2008), made in the Videoscan VS-SST-285 system with an exposure of 39 µs, the delay time of the sync pulse from the pressure sensor was 300 µs. The angle of the spray cone and the angle of deviation of its axis from the axis of the nozzle characterize the quality of the spray and affect the process of mixture formation and fuel combustion. The fuel injected into the combustion chamber must evenly fill the entire volume of the chamber for good mixing with air. The angle of the cone reduced against the normal one leaves part of the chamber unfilled with fuel, which worsens mixture formation and leads to underutilization of part of the oxygen in the air intended for fuel combustion. With an increased spray angle, part of the fuel, falling on the walls of the chamber, turns into carbon deposits and does not participate in the formation of the mixture. At the same time, the engine reduces power, its efficiency worsens. Similar phenomena occur when the axis of the spray cone deviates from the axis of the nozzle (side injection). According to technical requirements, the spray cone angle for most diesel injectors is 25°. The axis of the spray cone must coincide with the axis of the nozzle.
From the analysis of the fuel jet in Fig. 5b, c shows that the maximum fuel concentration is observed at the atomizer, in the initial zone of the jet and in the front (less than at the atomizer), and there is also a deviation of the flame core axis from the nozzle axis. As experiments show, a change in the angle of the spray cone by 10° and a deviation of the axis of the cone from the axis of the nozzle are permissible by 3-5°.
The reason for the change in these values may be deposits of solid carbon particles in the nozzle hole and on the nozzle pin, as well as wear on the nozzle and pin.
CONCLUSION
The study of the injection process in diesel mixture formation requires relia- ble information on the relationship between the speed characteristics of the fuel jet and the dynamics of the fuel supply cycle. Optical research methods do not destroy the structure of the fuel plume and allow obtaining informa- tion about the structure and dynamics of the flame development. Obtaining data for processing using a high-speed micropyrometric complex can greatly improve the quality of diagnostics. The result of experimental data processing according to the proposed method is consistent with the previously obtained results (Gulyaev P., 2008, Svistula, 1999), which indicates great prospects for
Optical Diagnostics of the Dispersion Composition of Fuel-Air Flare 135
the further development of this express diagnostic method to obtain nume- rical characteristics of fuel jet dispersity and improve the ecology of heavy hydrocarbon combustion processes.
REFERENCES
Gulyaev I.P., Solonenko O.P., Gulyaev P.Yu. (2009). Hydrodynamic features of the impact of a hollow drop with a surface. Letters to the journal of technical physics. 35 (19). pp. 12–19. Gulyaev P.Yu., Gulyaev Yu.P., Dolmatov A.V. (1997). Bayesian color restoration of
digital images. Vestnik SSGA. 2. pp. 114–115. Gulyaev P.Yu., Jordan V.I., Eskov A.V.(1999). Error in Reconstructing the Size Distribution Function of Particles in the Small Angle Method. Bulletin of AltSTU im. I.I. Polzunova2. pp. 55–58. Gulyaev P.Yu., Eskov A.V., Poltorykhin M.V. (2000). Experimental study of velocity
and flow characteristics of air-fuel jets. Polzunov almanac. 3. p. 19. Gulyaev P.Yu., Dolmatov A.V., Popov V.A. (2012). Methods for optical diagnostics of particles in high-temperature flows. Polzunovskiy Bulletin. 2(1). pp. 4–7. Gulyaev P.Yu., Jordan V.I., Gulyaev I.P. (2008). Optoelectronic system for diagnosing
two-phase flows by the dynamic method of particle counting. Izvestiya vuzov. Physics. 9(3). pp. 79–87. Kadyshevich A. E. (1962). Current state and ways of development of optical flame pyrometry. Advances in the physical sciences vol. LXXVI No. 4. Ostrenko S.A. (1973). Hydraulics, hydraulic drive, hydraulic and pneumatic systems.
Lecture notes. 95 p. Svistula A.E., Matievskii D.D., Gulyaev P.Yu. (1999). Experimental study of the characteristics of fuel jets of diesel injectors. Engine building. 1. pp. 29–31.
LISTED IN THE AHFE DIGITAL BOOKSTORE CATALOGUE
Explore the complete digital volume
Production Management and Process Control
Read this individual research paper free through the original publisher, or explore the full digital proceedings book.
ISBN 978-1-958651-12-4
Explore this ISBN in the AHFE Bookstore ↗Listed in the July 2026 bookstore catalogue; search by ISBN to confirm current availability · Digital book purchase optional