Lorelie Grepo (2023). Students’ perceived workload, stress, fatigue and performance during the remote learning setup: A semester-long study. In: Training, Education, and Learning Sciences. AHFE Open Access, vol. 109, pp. 149–161. https://doi.org/10.54941/ahfe1003161
Department of Industrial Engineering and Operations Research, College of, Engineering, University of the Philippines Diliman, Quezon City 1101, Philippines ↗
The COVID-19 pandemic has largely impacted college students as they reported experiencing increased workload, stress, and fatigue in the remote learning setup, which could potentially affect student learning and academic performance. This study investigated the experiences of 3rd year Industrial Engineering students at the University of the Philippines Diliman in the remote learning setup for the 2nd Semester of the Academic Year 2021-2022. The study measured students’ perceived workload (PWL), perceived stress (PS) and stress symptoms experienced, perceived fatigue (PF), and perceived academic performance weekly throughout the semester. Participant demographics and weekly activities were documented. Fifty-five (55) students completed the 17-week study with questionnaires administered through Qualtrics. The results indicate that the perceptions of workload, stress, fatigue and academic performance differed significantly between weeks in the semester, as well as between the participants’ sex. Hours spent by students on different activities during the semester were shown to significantly affect their perceived workload, stress, fatigue, and academic performance. Finally, the perceived workload correlated with perceived stress and perceived fatigue, which were also significantly correlated with the student's perceived academic performance.
College students experience stress and fatigue in school due to several factors, workload being one of them. Student stress and fatigue have been exacerba- ted by the COVID-19 pandemic, affecting academic performance, health, and well-being. To help support students’ learning in the future, instructors and administrators need to understand what college students currently experie- nce in the remote setup, as this will influence what the future of education will be.
Workload has been identified as one of the main causes of stress (Britz & Pappas, 2010). It is defined as “the volume of work expected of a person” (Jacobs et al., 2013), consisting of both physical and mental aspects. Fan &
Smith (2017) identified workload as one of the main contributors to fatigue and stress in the workplace. In addition to stress, fatigue, and performance, workload is also shown to correlate with college students’ well-being (Smith, 2019). The World Health Organization (WHO) defines stress as “any type of change that causes physical, emotional or psychological strain.” (www.who.int). Research in academic settings reports that students experie- nced moderate to high levels of stress (Kizhakkeveettil et al., 2017; Aldiabat et al., 2014), with female students having higher stress compared to male stu- dents (Kizhakkeveettil et al., 2017; Lee et al., 2013; AlAteeq et al., 2020). The COVID-19 pandemic further exacerbated this stress (Son et al., 2020). Causes of stress include academic workload, academic difficulty, concerns about aca- demic performance, and time management (Britz & Pappas, 2010; Dy et al., 2014; Son et al., 2020). High stress levels are shown to correlate with negative well-being and unhealthy behaviors (Britz & Pappas, 2010), poor academic performance, poor psychological/mental and physical health (Kizhakkeveet- til et al., 2017; Koch, 2018; Canillo et al., 2022, Lee et al., 2013), mental illnesses (Seedat et al., 2009 as cited in Aldiabat et al., Lee et al., 2013), and general health (Yang et al., 2021).
Fatigue is “a state of tiredness and diminished functioning.” (dictio- nary.apa.org). It reduces one’s ability to perform a task (De Vries et al., 2003). Similar to stress, studies reported students experiencing high levels of fatigue (Kizhakkeveettil et al., 2017), which was correlated with psycho- logical health, reduced wellbeing and lower academic performance, and time demands and conflict between tasks (Mosleh et al., 2022; Kizhakkeveettil et al., 2017; Smith, 2018). Male students experienced lower levels of fati- gue compared to female students (Mosleh et al., 2022; Kizhakkeveettil et al., 2017). Students’ academic performance can be affected by stress and fatigue. Academic performance can be measured objectively or subjectively, with Grade Point Average (GPA) as the most commonly used objective measure that is reliable (Bacon & Bean, 2006). In a 2020 study among veterinary students, it was reported that 96.7% believed that their academic performa- nce was affected by COVID-19 (Mahdy, 2020). This emphasizes the need to understand student learning experiences during the pandemic and its implica- tions. Smith (2018) concluded that lower academic performance is linked to reduced well-being and mental fatigue. In addition, perceived academic per- formance was shown to correlate negatively with depression, anxiety, and stress.
Relationships between workload, stress, fatigue, and performance have been explored. High workload is correlated with higher stress and nega- tive wellbeing (Yang, Chen & Chen, 2021; Smith, 2019; Dy et al., 2014). A similar relationship can be seen between academic workload and percei- ved fatigue (Sy et al., 2022). The level of stress had been shown as a predictor of the levels of fatigue among undergraduate students (Kizhakkeveettil et al., 2017). Both fatigue and stress had been shown to affect student performa- nce (Cahapay, 2022; Palmer, 2013; Almonte et al., 2021). All four variables have been explored in a workplace setup and it was found that the workload
Students’ Perceived Workload, Stress, Fatigue and Performance 151
contributed to stress and fatigue and that fatigue is correlated with stress and work-life balance (Fan & Smith, 2017).
While previous studies explored the 4 variables (workload, stress, fati- gue and academic performance), relationships between these have yet to be established in the academic setting. In addition, the week-to-week variation in the reported experiences of students has not been explored. This study provides insights into the student experiences during an entire semester of remote learning at the University of the Philippines Diliman, describing the workload, stress, and fatigue experienced by students during an entire seme- ster and establishing the relationship of these perceived experiences to their academic performance.
METHODS
This is a mixed-methods repeated-measures study. Participants were 3rd and 4th year Industrial Engineering students at the University of the Philippines Diliman during the 2nd semester of the Academic Year 2021-2022. Students were recruited at the beginning of the semester from the IE 163 (Cognitive Ergonomics) course. Those who volunteered to participate were asked to sign consent forms. Participants who completed the 17-week received extra class credits.
The independent variables in the study are demographics and weekly acti- vities. The variables of interest are perceived workload, perceived stress, perceived fatigue, perceived academic performance, and general weighted average (GWA). The scales used in this study are as follows: Subjective Workload Assessment Technique (SWAT) (Reid & Ngyren, 1988) for wor- kload, the 10-item Perceived Stress Scale (Andreou et al., 2011) for stress, the 12-item Piper Fatigue Scale (PFS) (Reeve et al., 2012) for fatigue, and a 1-item question for the perceived academic performance (“In the past week, how well do you think you performed academically” using a 10-point rating scale from 1 worst to 10 best).
Data were collected weekly online through Qualtrics, from the week before classes began until the week after the final exams in the semester. Data analy- sis was mainly done in MS Excel and R version 4.1.2. Descriptive statistics (mean, standard deviation and distributions) were obtained for each varia- ble. Repeated-measures ANOVA was used to determine if the weeks in the semester affected the 4 variables of interest. If found significant, a posthoc Dunnett’s test was done to identify the weeks that were significantly different from the rest. A t-test was used to identify a significant difference between the sexes. Correlation and regression analyses were done to establish relati- onships between the number of tasks, time spent on tasks, workload, stress, fatigue, and academic performance.
RESULTS AND DISCUSSION
55 students (out of 62) completed the 17-week study. 24 were male (44%) and 31 were female (56%) students. The mean age is 21 (SD = 0.9).
152 Grepo
Students were located all over the Philippines, with 69% in Metro Manila and Region 4.
Activities and Tasks. The number of requirements averaged 7.89 (SD = 9.61) per week. The variance may be attributable to the weekly differences in the tasks throughout the semester, with some weeks having more (11) than others (2). Requirements included assignments (M = 1.62, SD = 2.93), exe- rcises (M = 1.85, SD = 2.35), exams (M = 1.26, SD = 0.61), discussions (M = 1.01, SD = 1.97) and lab reports and activities (M = 2.01, SD = 2.48). Nongraded activities, papers, and presentations averaged less than 1 per week.
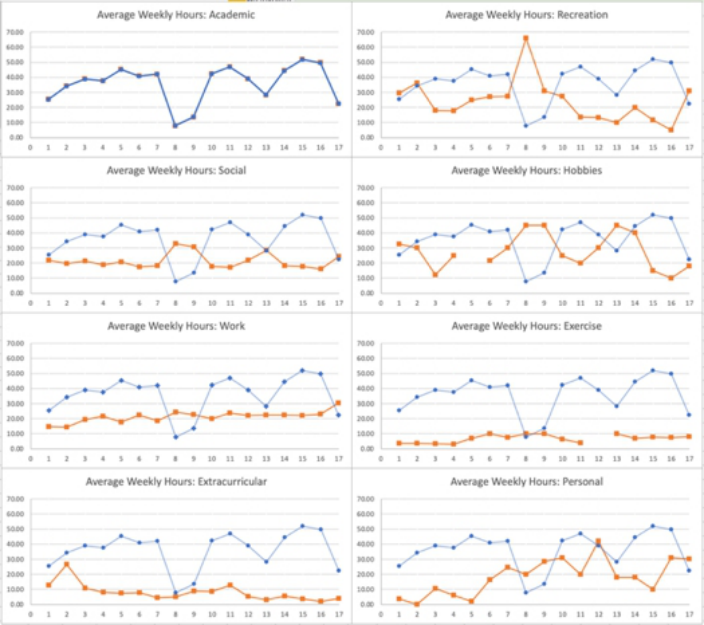
Students estimated the time spent on academic tasks (M = 35.83, SD = 22.57), socializing (M = 21.36, SD = 23.28), work (M = 21.86, SD = 15.26) and extracurricular activities (M = 10, SD = 11), including others they needed to specified every week. Similar to the number of requi- rements, time spent on academic tasks varied over the weeks. 31% of the responses indicated hours spent for work, with the first 2 weeks in the study having the lowest mean (M = 14) while the last week (after the final exams) had the highest mean work hours (M = 30). 14.5% reported the time spent on extracurricular activities, which highly varied, with some students spending more than 20 hours, while some with 1 hour per week. 5% of the respondents reported their internship (M = 12.65, SD = 9.03. Time spent on recreation was reported by about 5% of the students (M = 24.83, SD = 18.77), with the highest value (79 hours) falling on weeks 8 (Lenten break) and 9 (reading break. 2% reported the time spent on hobbies (M= 26.43, SD = 12.39), 4% reported exercise (M = 6.23, SD = 3.35) while 3% included personal time (M= 20.28, SD = 14). Only the academic, social, work, and extracurricu- lar were included in the questionnaire with all other activities reported by the students as “others”. Figure 1 shows the time spent on different activities (weekly average), with the first plot on academic tasks. The rest are plotted relative to it. Most tasks, particularly socialization, recreation, exercise, and personal time, increased on weeks 8 and 9, when the time spent for academic tasks decreased during the break. The mean time spent on work, exercise and extracurricular activities remained about the same during the study period, except at week 1 for extracurricular and week 17 for work.
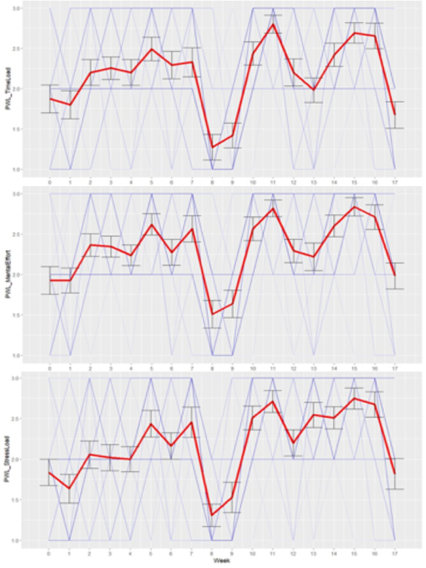
Perceived Workload. Figure 2 shows the mean perceived workload score for each dimension (TL=time load, ME=mental effort, PS=psychological stress) per week and the 95% CI. The lowest levels of workload were reported on Week 8 (TL = 1.28, ME = 1.52, PS = 1.31) and 9 (TL = 1.43, ME = 1.65, PS = 1.54), while week 11(TL = 2.79, ME = 2.81, PS = 2.69), 15 (TL = 2.72, ME = 2.83, PS = 2.74) and 16 (TL = 2.65, ME = 2.69, PS = 2.65) having the highest. A one-way repeated measures ANOVA resulted in p < 0.05 for all three dimensions of perceived workload, indicating a significant differe- nce within weeks. A post hoc pairwise multiple comparisons using Dunnett’s test (baseline at week 8) indicated that all weeks differed from week 8, having p < 0.05 except week 9, highlighting the significant reduction in the student’s
Students’ Perceived Workload, Stress, Fatigue and Performance 153
Figure 1: Students’ average weekly hours spent on different activities.
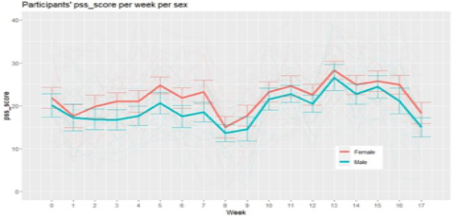
workload during the break. The perceived workload between sexes was com- pared using a t-test resulting in a nonsignificant difference at a 5% level of significance. Perceived Stress and Symptoms. The students’ perceived stress was measured using the 10-item Perceived Stress Scale (PSS) by Cohen et al. (1983), scored between 0 to 40, and categorized into low (scored 0-13), moderate (scored 14-26), or high (scored 27-40) levels. Figure 3 shows the students’ PSS scores. The lowest stress levels were reported on weeks 8 and 9. A one-way repeated measures ANOVA resulted in a p-value of < 0.0001, indicating a significant difference in the PSS scores within weeks. A Dunnett’s test, with a baseline at week 8, indicated that weeks 1, 9, and 17 were not significantly different from it. All the other weeks were significantly different, with p-value < 0.05 for week two and p-value < 0.0001 for all other weeks. A t-test resulting in p < 0.05 shows that females perceived higher stress levels than males, similar to the findings of Kizhakkeveettil et al. (2017).
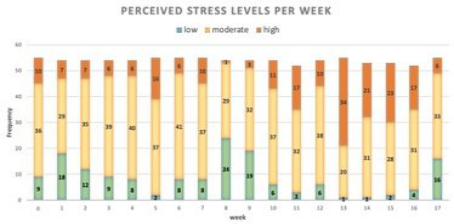
Lee et al. (2013) and AlAteeq et al. (2020). Figure 4 shows that most stu- dents reported moderate levels of perceived stress in all weeks except Week 13 when the national elections were held. Weeks 2, 8, 9, and 17, had higher fre- quencies of the low-stress level occurring on the first week of classes, Lenten and reading break, and after final exams week, respectively.
Table 1 shows the percentage of students who experienced each stress symptom. Two-thirds of the students lacked motivation or focus and felt overwhelmed. More than half of them reported sleep problems and fatigue. The average number of symptoms was lowest on weeks 8 and 9 during the break. The top 4 symptoms reported are shown to affect students’ behavior and academic performance.
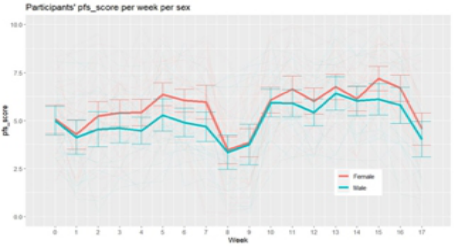
Perceived Fatigue. The students’ perceived fatigue was measured using the 12-item Piper Fatigue Scale (PFS) (Reeve et al., 2012), with the weekly mean scores shown in Figure 5. The overall PFS average score for the semester is 5.36 (rounded to 6), corresponding to moderate fatigue. Weeks 8 (M = 3.43) and 9 (M = 3.82) had the lowest PFS scores, between the mild and mode- rate categories. Like the perceived workload and stress, PFS scores during the Lenten (week 8) and reading (week 9) breaks were lower than the rest of the semester. Weeks 10, 11, 13, 14, 15, and 16 had average scores>6, correspon- ding to a severe fatigue level. High fatigue levels were experienced during the 2nd half of the semester. A one-way repeated measures ANOVA resulted in p < 0.0001, meaning there were weeks when the perceived fatigue was higher or lower than the others. A post hoc pairwise multiple comparison with the week 8 PFS score was done using Dunnett’s test in R, indicating that weeks 1, 17, and 9 were not significantly different at alpha = 0.05.
Students’ Perceived Workload, Stress, Fatigue and Performance 155
Figure 3: Weekly perceived stress scores: overall (top) and by sex (bottom).Figure 4: Weekly perceived stress scores by category.Table 1. Average percentage of students who experienced stress symptoms.
Table available in the original PDF paper.
Symptoms experienced Average % Symptoms experienced Average % Lack of motivation or focus 67.27% Stomach upset 17.68% Feeling overwhelmed 65.45% Sex drive change 7.37% Sleep problems 57.37% Chest pain 5.67% Fatigue 52.93% Drug/alcohol misuse 1.21% Exercising less often 38.08% Tobacco use 1.31% Irritability or anger 35.35% None 2.00% Sadness or depression 33.13% (Others) headache/migraine 0.6% Social withdrawal 18.28%
The reported PFS score for week 8 significantly differed from all other weeks with p-values <0.0001. Figure 5 shows that females reported higher PFS scores than males for most of the weeks during the semester. Based on a t-test, the results indicate a marginal significance with a p < 0.1, suppor- ting Kizhakkeveettil et al.’s (2017) findings on female students experiencing
156 Grepo
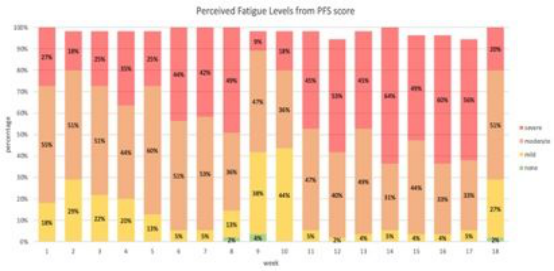
Figure 5: Weekly piper fatigue scale average scores: overall (left), by sex (right).Figure 6: Weekly piper fatigue scale scores by category.
higher fatigue than males. In Figure 6 shows that moderate fatigue was repor- ted during the first part of the semester. During weeks 8 and 9, the highest percentage of none to mild fatigue was reported, as students were not given tasks during this time. Towards the end of the semester, the students’ fatigue levels were mostly severe (more than half), except for weeks 12 and 17, with the latter occurring after the final exams.
Academic Performance. The students’ academic performance was measured (1) subjectively by rating on a scale of 1 (worst) to 10 (best) how they think they performed academically during each week and (2) by the general weigh- ted average (GWA) obtained at the end of the semester. The mean perceived
Students’ Perceived Workload, Stress, Fatigue and Performance 157
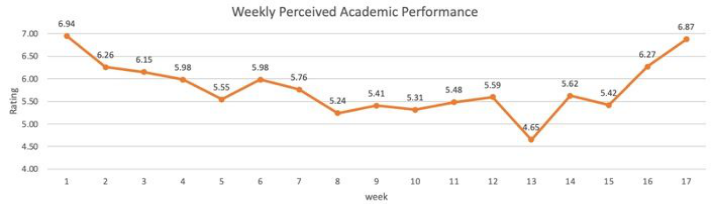
Figure 7: Weekly ratings of perceived academic performance.
academic performance was rated 5.79 (SD = 2), between worst and best. The highest-rated performance was on weeks 1 and 17, as shown in Figure 7 when classes had just started and after the final exams ended. Week 13 (natio- nal elections held) had the lowest perceived academic performance in which the students requested academic ease (break) to cope with the situation. A one-way repeated measures ANOVA resulted in p < .001, showing that the perceived academic performance between weeks differed. Using Dunnett’s test, with week 13 as the baseline, it was found that the students’ perceived academic performance on weeks 1, 2, 3, 4, 6, and 7 was significantly diffe- rent (p < .01) from that of week 13, with week 14 being marginally significant (p < .1). Those weeks when the average ratings were less than 5.6 were not significantly different from week 13.
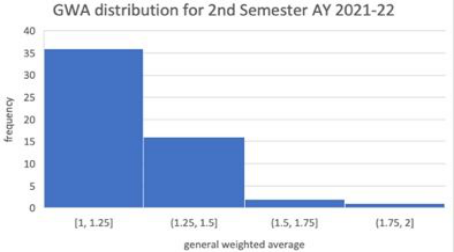
The mean GWA of the participants is 1.24 (SD = 0.18), with 1.00 being the highest on the grading scale. Figure 8 shows that the grades are generally very high, with 95% getting 1.5 and higher. The perceived academic performance was evaluated to determine whether it was a good measure and if it was correlated with the students’ GWA. A linear regression analysis resulted in a p < .001 with a positive coefficient, showing that a higher perceived academic performance is correlated to a higher GWA.
Relationships Between Variables. To determine whether the number of requi- rements and time spent on tasks are related to the perceived workload, perceived stress, and perceived fatigue, correlation and regression analyses were done. The number of requirements per week is significantly related to
Figure 8: Frequency distribution of the students’ general weighted average (GWA).
158 Grepo
levels of workload, stress, and fatigue experienced (p < .05). Only the number of hours allocated to academic tasks (p < .001) and social activities (p < .05) are significant to all three: perceived workload, stress, and fatigue. All other time spent on tasks was significant to at least 1 of the 3 variables. This study contributes to the existing literature by examining the relationship of other tasks (outside) academics to the perceived outcomes. This information is use- ful in understanding which specific activities affect the perceived workload, stress, and fatigue.
The relationship between perceived workload, perceived stress, and percei- ved fatigue was tested using linear regression. Results indicate that mental effort is not significant in perceived stress (p > .05), psychological stress load is significant (p < .001), while the time load is marginally significant with p = .06. The correlation between workload and stress is positive. An increase in the perceived workload score would result in an increase in the perceived stress score. The intercept is significant (p < .001) and positive, which shows the inherent stress experienced by students. All three dimen- sions of workload positively correlated with perceived fatigue (p < .001). Higher workload correlated with higher fatigue. Fan and Smith (2017) have shown a similar relationship in their study of the workplace setup. Other stu- dies indicated that workload is correlated with students’ stress (Yang et al., 2021; Smith, 2019), and that workload is correlated with physical and men- tal fatigue (Sy et al., 2022). The workload given to students, being relevant to stress and fatigue, must be evaluated.
Lastly, multiple linear regression was used to see how the perceived workload, stress, and fatigue relates to academic performance (outcome vari- able). The intercept, perceived stress, and perceived fatigue were significant (p < .001), while perceived workload was not. The intercept value (7.68) represents the baseline perceived academic performance (where 10 is best). Perceived stress and perceived fatigue, had −0.11 and −0.22 coefficients, respectively. As the perceived stress and fatigue increase, perceived performa- nce decreases. This model shows similar trend to previous studies: stress and fatigue affects performance (Palmer, 2013; Kizhakkeveettil et al., 2017). The effect of stress on performance during remote learning was reported by Caha- pay (2022). However, unlike Fan & Smith’s (2017) findings on the workplace, this study did not yield significance of the perceived workload to perceived academic performance. There may not be a direct link between the two, but rather, this may be mediated by perceived stress and perceived fatigue. When GWA was tested for correlation with the perceived workload, perceived stress and perceived fatigue, no significant relationship was found, similar to the study results of Almonte et al. (2021) for a group of students during the remote setup. This may be explained by the small variance in the GWA of the participants in the study, which may be further explored in future studies.
CONCLUSION
This study explored the students’ experiences in the remote setup through a repeated-measures study. Students reported moderate to high workload, stress, and fatigue during the semester. The levels of perceived workload,
Students’ Perceived Workload, Stress, Fatigue and Performance 159
stress, fatigue, and academic performance varied between weeks in the seme- ster. Sex, the number of tasks, and the hours spent on different tasks were significantly related to the perceived workload, perceived stress, and percei- ved fatigue. Female students generally reported higher levels of workload, stress, and fatigue than males. The number of tasks was correlated with each of the perceived outcomes. Finally, for hours spent on tasks, only the academic tasks and socializing were significant to all outcomes. The perceived workload was found to be positively correlated to both percei- ved stress and perceived fatigue. However, the perceived workload was not significant in perceived academic performance. Perceived academic per- formance was negatively correlated with perceived stress and perceived fatigue. The General Weighted Average was not correlated with any of the outcomes.
This study’s limitations are as follows: (1) it is mainly descriptive and exploratory. To further improve the analysis of the relationships betw- een variables, other statistical analysis methods can be used; (2) the results reported here contain the quantitative data collected. The qualita- tive results that include student coping mechanisms and other experiences are reported separately; (3) the participants were limited to one cohort of Industrial Engineering students only. In the future, this study can be expanded to include students from other colleges and other year levels. This can also be expanded to include both semesters of the academic year.
ACKNOWLEDGMENT
The author would like to acknowledge the Renato Bersales Matias Profes- sorial Chair in Industrial Engineering granted by Dr. Aura C. Matias to the author through the University of the Philippines Diliman College of Engineering.
REFERENCES
Alateeq, D. A., Aljhani, S., & Aleesa, D. (2020). PERCEIVED STRESS AMONG STUDENTS IN VIRTUAL CLASSROOMS DURING THE COVID-19 OUT- BREAK IN KSA. JOURNAL OF TAIBAH UNIVERSITY MEDICAL SCIE- NCES, 15(5), 398–403. Aldiabat, K., Matani, N., Le Navenec, C. (2014). Mental Health among Undergradu-
ate University Students: A Background Paper for Administrators, Educators and Healthcare Providers. Universal Journal of Public Health, 2(8), 209–214. Almonte, J., Badillo, E., Candelaria, K., Tadle, I., Villacorte, J., Galingan, R.
(2021) Proceedings of the International Conference on Industrial Engineering and Operations Management. Andreou E, Alexopoulos EC, Lionis C, Varvogli L, Gnardellis C, Chrousos GP, Darviri C. Perceived Stress Scale: reliability and validity study in Greece. Int J Envi- ron Res Public Health. 2011 Aug;8(8): 3287–98. doi: 10.3390/ijerph8083287. APA Dictionary of Psychology, URL: https://dictionary.apa.org/fatigue, accessed 03
October 2022. Bacon, D. R., & Bean, B. (2006). GPA in Research Studies: An Invaluable but Neglected Opportunity. Journal of Marketing Education, 28(1), 35–42.
160 Grepo
Britz J and Pappas E. (2010) Sources and Outlets of Stress among University Students: Correlations between Stress and Unhealthy Habits. URJHS, 9, 1. Cahapay, M. B., & Rotas, E. (2022). Remote Learning Stress, Adaptive Coping
Strategies, and Academic Performance of Filipino University Students amid COVID-19 Crisis. Computers and Children, 1(1). Canillo, G., Cantos, R., Catamio, J., Diola, D., Duque, E., Espiritu, E., Pantaleon, A. & Distor, J. (2022). PM is the Key: Perceived Stress and Mental Health as the Key Indicator of Wellbeing of Selected College Online Students in the Philippines During COVID-19 Pandemic. https://doi.org/10.5281/zenodo.6954884. De Vries J, Michielsen HJ, Van Heck GL (2003). Assessment of fatigue among
working people: a comparison of six questionnaires. Occupational and Environ- mental Medicine 2003; 60: i10-i15. Dy, Marison & Espiritu-Santo, Klarisse & Ferido, Melissa & Ria, Sanchez.
(2019). Stressors and Stress Responses of Filipino College Students. Retrieved from https://www.researchgate.net/publication/335600586_Stressors_and_Stress _Responses_of_Filipino_College_Students accessed 03 October, 2022. Fan, J., Smith, A. P. (2017). The Impact of Workload and Fatigue on Performance. In: Longo, L., Leva, M. (eds) Human Mental Workload: Models and Applications. H-WORKLOAD 2017. Communications in Computer and Information Science, vol. 726. Springer, Cham. https://doi.org/10.1007/978-3-319-61061-0_6. Jacobs, K., Hellman, M., Markowitz, J., Wuest, E. (2013). Workload. In: Gellman,
M. D., Turner, J. R. (eds) Encyclopedia of Behavioral Medicine. Springer, New York, NY. Kizhakkeveettil, A., Vosko, A. M., Brash, M., Ph, D., & Philips, M. A. (2017).
Perceived stress and fatigue among students in a doctor of chiropractic training program. The Journal of chiropractic education, 31(1), 8–13. https://doi.org/10. 7899/JCE-15-27. Koch, Aidan, “How Academic and Extracurricular Workload and Stress Impacts the Mental and Physical Health of College Students” (2018). Honors Theses. 165. Lee EH. Review of the psychometric evidence of the perceived stress scale. Asian Nurs Res (Korean Soc Nurs Sci). 2012 Dec;6(4): 121–7. doi: 10.1016/j.anr.2012.08.004. Epub 2012 Sep 18. PMID: 25031113. Lee, S. Y., Wuertz, C., Rogers, R., & Chen, Y. P. (2013). Stress and sleep disturbances
in female college students. American journal of health behavior, 37(6), 851–858. Mahdy MAA (2020) The Impact of COVID-19 Pandemic on the Academic Performance of Veterinary Medical Students. Front. Vet. Sci. 7:594261. Mosleh, S. M., Shudifat, R. M., Dalky, H. F. et al. (2022). Mental health, learning
behaviour and perceived fatigue among university students during the COVID-19 outbreak: a cross-sectional multicentric study in the UAE. BMC Psychol10, 47. Palmer, L. K. (2013). The Relationship between Stress, Fatigue, and Cognitive Functioning. College Student Journal, 47(2), 312–325. Reeve BB, Stover AM, Alfano CM, Smith AW, Ballard-Barbash R, Bernstein L, McTi-
ernan A, Baumgartner KB, Piper BF (2012). The Piper Fatigue Scale-12 (PFS-12): psychometric findings and item reduction in a cohort of breast cancer survivors. Breast Cancer Res Treat. 2012 Nov;136(1): 9–20. doi: 10.1007/s10549-012- 2212-4. Reid, G. B., & Nygren, T. E. (1988). The Subjective Workload Assessment Technique: A Scaling Procedure for Measuring Mental Workload. Advances in psychology, 52, 185–218.
Students’ Perceived Workload, Stress, Fatigue and Performance 161
Seedat S., Stein D., Jackson P., Heeringa S., Williams D., Myer L. Life stress and mental disorders in the South African stress and health study. SAMJ; (2009), 99 (5), 375–382. Smith, A. (2018). Cognitive Fatigue and the Wellbeing and Academic Attainment of
University Students. Journal of Education, Society and Behavioural Science, 24(2), 1–12. Smith, A. P. (2019). Student workload, wellbeing and academic attainment.
In Human Mental Workload: Models and Applications: Third International Symposium, H-WORKLOAD 2019, Rome, Italy, November 14–15, 2019, Proceedings 3 (pp. 35–47). Springer International Publishing. Son C, Hegde S, Smith A, Wang X, Sasangohar F. (2020), Effects of COVID- 19 on College Students’ Mental Health in the United States: Interview Survey Study, J Med Internet Res 2020;22(9): e21279, URL: https://www.jmir.org/2020/ 9/e21279. Sy, M., Irinea, M., Malabuyoc F., Sobrevilla, D., Gumasing, M. (2022) Effects of aca-
demic workload to the mental fatigue of students during online class, Proceedings of the International Conference on IEOM. World Health Organization (WHO), https://www.who.int/news-room/questionsand-answers/item/stress accessed 03 Oct 2022. Yang C, Chen A, Chen Y (2021) College students’ stress and health in the COVID-19
pandemic: The role of academic workload, separation from school, and fears of contagion. PLoS ONE 16(2): e0246676. https://doi.org/10.1371/journal.pone .0246676.
LISTED IN THE AHFE DIGITAL BOOKSTORE CATALOGUE
Explore the complete digital volume
Training, Education, and Learning Sciences
Read this individual research paper free through the original publisher, or explore the full digital proceedings book.
ISBN 978-1-958651-85-8
Explore this ISBN in the AHFE Bookstore ↗Listed in the July 2026 bookstore catalogue; search by ISBN to confirm current availability · Digital book purchase optional