Beth Atkinson, Emily Anania, Mitchell Tindall, Ryan Wohleber, Daniel Barber, Alicia Jordan, Jamie Lewis, Tyler Welden (2023). Applying Human Factors Principles and Analyses to Design an Instructional Display for Dynamic Breathing Threat Training. In: Human-Centered Design and User Experience. AHFE Open Access, vol. 114, pp. 1–10. https://doi.org/10.54941/ahfe1004215
As the U.S. Navy seeks to provide more comprehensive dynamic altitude breathing threats training, there is an opportunity to advance the instructional technology. Through human factors analyses, a user centered approach to display solutions was implemented. First, a critical review of the data relevant to this training informed designs for both real-time and after action review displays. Human factors professionals then conducted internal workshops to discuss display features and configurations that would increase instructor efficiency and effectiveness. Based on these requirements and design specification activities, a functional mock-up was engineered and integrated into a training simulator and data were collected as narratives from a larger training effectiveness evaluation to inform iterative design and development. Additionally, a small cohort of instructors provided heuristic-based feedback. These evaluation activities highlighted several advantages of using these displays over previous technology, and provided recommendations to system design updates that would increase display consistency and user efficiency.
The Naval Aviation Survival Training Program (NASTP) requires that per- sonnel who will be assigned to fly in naval aircraft to be provided training in a variety of areas that range from aeromedical factors of flight to survival procedures (Department of the Navy, 2020). As part of this requirement, trainees are exposed to curricula consisting of lectures, as well as dynamic hands-on and practical training devices and equipment. In recent years, the attention to physiological episodes across services has resulted in a num- ber of reviews that highlighted the need for adjustments in both training
and operational domains (National Aeronautics and Space Administration, 2020). While legacy training focused on hypoxia awareness and mitigation training, the requirement has been updated to include a broader range of dynamic altitude threats such as hyperventilation and hypocapnia (Depart- ment of the Navy, 2020). The naval survival training community is exploring the application of training solutions that address this requirement by deliver- ing experiences of restricted inhalation and restricted exhalation in addition to reduced oxygen. The objective is to provide dynamic breathing threat training at the Aviation Survival Training Centers (ASTCs) that address a range of threats posed by high altitude environments.
During dynamic breathing threat training for mask wearing aviators, a device delivers airflow to the trainee through a hose and aviation mask. His- torically, training focused solely on exposure to hypoxic hypoxia – or the reduction of oxygen in the airflow resulting from altitude increases – which has a negative impact on human physiology (Federal Aviation Adminis- tration, 2016). While the specific ways to expand training are still under evaluation for implementation, considerations include profiles (i.e., a time- based series of variable settings that deliver a specific training experience) in which features of the airflow such as flowrate and pressure and oxygen con- centration, are manipulated variables to replicate situations that may result in the experience of adverse physiological symptoms due to the onset of various conditions (see Department of the Navy, 2020 for list of conditions and symp- toms). This paradigm shift presents an opportunity to revisit instructional tools within the training environment. The unique nature of this high risk training requires careful consideration of factors that impact safety of trainees and capturing the data instructors may find beneficial to highlight learning objectives. While these schoolhouse considerations generally inform standard operating procedures and emergency response plans, similar considerations are necessary in designing instructional displays. This effort sought to iden- tify critical information to support instructors during real-time execution of training and through the debrief discussion post-training.
DISPLAY DATA CONSIDERATIONS Due to the nature of the training, instructors require access to information related to the training profile and individual physiological changes at a min- imum. Additionally, instructional personnel assigned to the ASTCs have a variety of experiences and expertise. This requires consideration for a variety of training data that can increase the effectiveness of diagnostic discussions.
Training Profile Data The first pieces of information that are critical to a display within this train- ing domain are data relevant to the training profile. The Flight Breathing Awareness Trainer (FBAT) delivers a training profile that has been approved and certified for use in training at ASTCs. During these profiles, instructors need to understand how the airflow is being adjusted by the system. As such, the display must provide data related to the simulated altitude, the peak air
Applying Human Factors Principles and Analyses to Design an Instructional Display 3
flow, and the pressure setting. An additional system parameter of interest is current time in the profile and elapsed time.
Trainee Physiological & Performance Data During a training session, instructors monitor student physiological changes, which are safety-critical data to be displayed. Adverse physiological condi- tions such as hypoxia have been extensively researched and demonstrated to result in impairment of cognitive, physical, and/or psychomotor abil- ities (Denison et al., 1966; Green & Morgan, 1985; Legg et al., 1989; Malle et al., 2013; Smith, 2008). Traditional physiological indicators used in training for identification of hypoxia onset and severity are blood oxygen saturation percentage (SpO2) and heart rate. Additionally, with the increased focus on alternative conditions such as hyperventilation and hypocapnia, instructor monitoring of breath rate provides another means for identifying physiological changes in students.
In addition to physiological changes, trainees are encouraged to report their symptoms and instructors track signs (instructor-observable changes to the trainee, e.g., cyanosis – bluish skin discoloration) of reduced oxygen in trainees. The motivation for tracking symptoms and signs during training is due to the wide variety of expected indicators (e.g., Cable, 2003; Pickard, 2002), as well as the idiosyncratic nature of adverse physiological symptoms (e.g., Johnston et al., 2012; Smith, 2008; Westerman, 2004). Additionally, research has indicated that with hypoxia, symptoms may shift over time, and thus symptoms experienced during training may change (Alagha et al., 2012). For these reasons, instructors require access to physiological symptom data for tracking and after-action review with students.
Trainees may also be asked to complete a realistic flying task using a simu- lator such as following a lead aircraft that is within the virtual environment. Integration with this virtual environment provides an opportunity to collect performance feedback in addition to physiological data points. To keep flight performance feedback simple for initial prototyping, data factors considered included altitude and airspeed.
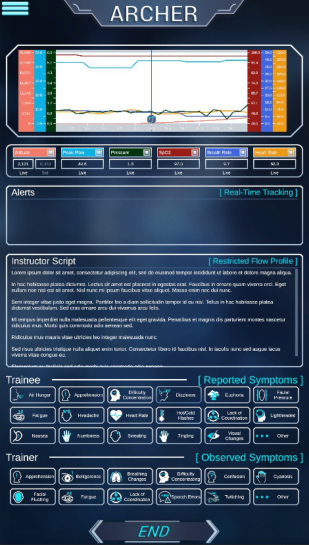
DESIGNING INSTRUCTIONAL INTERFACES The initial design of the system focused on two display types: 1) one for run-time that provides the instructor with data to understand the progres- sion of training profiles and trainee’s physiological responses (Figure 1, left), and 2) one for post-training that facilitates review of training objectives and individual’s performance (Figure 1, right).
Real-Time Training Display Design The display of system data – simulated altitude, peak flow of the system, and pressure setting – allows instructors to determine where they are within a pro- file, and therefore, what the trainee should be experiencing. To ensure that the instructor can identify any abnormalities in the system profile (e.g., if faced with power limitations, the device is unable to reach higher end set altitude
points), data displays included both the system set points (i.e., the current pro- file time-based variable setting, such as altitude) and the current live reading for those parameters. Similarly, instructors review current status of physi- ological data to determine how the profile settings are affecting the trainee and to monitor their safety. Highlighting these data points with stoplight-like colors when thresholds are crossed might assist instructors to identify when students enter a dangerous zone of physiological conditions. For example, when students become “clinically hypoxic” with a SpO2 value under 87%, the number should turn yellow, and when students reach the cut-off thresh- old for training, the number should turn red. Additionally, instructors are also alerted to low values through an audible alarm on the FBAT device.
Figure 1: Real-time (left) and post event debrief (right) instructor display mock-ups.
To increase the salience of these data points, instructors can also observe trends in these system and physiological data points through a graph. This display feature not only increases understanding of how data changes over time, but also provides a means to see interactions and relationships within the data. For example, during hypoxia training, when altitude increases (i.e., manipulated by decreasing the available oxygen percentage in the airflow) individual respond with an increase in heart rate and decrease in SpO2.
Due to the importance of monitoring trainees during training for safety purposes, an instructor alert feature was designed. The capability leverages automated tracking of significant trends in data points, critical thresholds, etc. that minimize instructor workload and increase ability to focus on
Applying Human Factors Principles and Analyses to Design an Instructional Display 5
trainees and instruction (e.g., a rapid increase of breath rate that marked a 15% change from baseline). At any point during the training, if an instructor is looking for information on critical status changes, this area of the interface provides a summary of relevant data without the need for interpretation.
While a qualification process exists to ensure all those certified as instruc- tors for any training device understand the device operation, training objec- tives, and safety procedures, the variety of instructor’s backgrounds results in nuanced differences in both teaching styles and the focus of diagnostic debrief discussions. As such, increasing standardization of debriefs and offer- ing instructional aids was a consideration for display data. Given that the training is relatively short (i.e., profiles take under 10 minutes), inclusion of a training script was considered to assist with the flow of training and to minimize individual differences that may exist due to experience levels. Additionally, this could serve as a review of training objectives for each of the dynamic breathing threat experience types to ensure that the instructor is reinforcing the specific symptoms and behavior reaction differences that trainees should be aware for the type of adverse physiological condition being experienced.
The final design element for the real-time display is a capability for instruc- tors to provide mark-ups to identify both trainee-reported symptoms and observer-identified signs of adverse physiological conditions. Instructors will see icons appear on the graph when they select symptoms and signs, allowing for a quick review of the order of symptoms experienced and physiological status at the time when symptoms appeared. This capability helps mitigate cognitive limitations and biases that may affect diagnostic debrief content post event.
Post Event Debrief Display Design The first primary display element for the post event debrief screen is a graph of system and physiological data throughout the duration of the pro- file. This adheres to heuristic guidance on consistency in display features for instructors, and is in close proximity with the current live system and physiological data. The graph, similar to the real-time display, provides an easy way to understand data trends over time as well as relationships (e.g., as pressure is increased by the system, trainees may experience decreases in breath rate to compensate). This screen can be easily shared with the trainee during debrief to facilitate a discussion of how they reacted to train- ing events. For this reason, the metric value windows provide a filter on and off checkbox that allows instructors to remove irrelevant or less interest- ing data to focus on the critical profile related information. Additionally, symptoms experienced or signs observed appear as markers on the graph at the time they were selected, allowing trainees to understand the order and progression of their individual physiological reactions to the situation. Finally, the continued monitoring of live data related to system and indi- vidual physiological changes allows instructors to maintain awareness of the trainee’s recovery and ensures they return to baseline before departing the training.
Following a structure parallel to the real-time display, the next design ele- ment of the post event display provides a summary of relevant measures. Similar to the instructor alerts, the data in this section of the display pro- vides the instructor and trainee with significant changes from baseline or initial data for the duration of the profile. Additionally, the next display element provides the details of the flight performance data trends. Specif- ically, through this effort basic flight metrics related to formation flight performance are calculated and displayed (e.g., deviation in altitude or air- speed from lead aircraft). Given the aviation backgrounds of typical trainees, discussing cognitive degradation in terms of flight performance puts the feed- back in a context that is relevant and demonstrates the potential significant impact of not mitigating adverse physiological symptoms when experienced.
The final two elements of the post-event display include event summary data and a replay capability. The summary data are intended to support instructors delivering individually tailored feedback through automated anal- ysis. For example, significant changes in physiological and behavioral perfor- mance from baseline to later points in the profile reinforce the trainee’s levels of impairment and individual factors that are most affected during training. Additionally, by using automated analysis that selects the data factors most relevant for a specific student, instructors can highlight the idiosyncratic and insidious nature of physiological changes. The final design element is a replay capability for a video feed that displays the trainee during the profile. Video review is recommended not only due to the potential training benefit, but also due to the potential short term memory lapses and cognitive impairments that may result from this type of training. That is, individuals may not remember what happened throughout the training event. Providing a replay allows for reflection on the intensity of the impacts (e.g., delays in response times or lack of response) as well as the effects that may not be recalled
USABILITY FEEDBACK ON PROTOTYPE DISPLAYS End user feedback was captured from both trainees and instructors to facil- itate understanding of the usability of the instructional interfaces. Feedback from trainees was captured during a training effectiveness evaluation involv- ing primarily ab initio trainees (i.e., Navy personnel who have not previously been through this type of training). Additionally, feedback was captured from instructors related to the real-time and post-event displays to provide an analysis of the system usability.
Respondents who were trainees (n = 59) provided open ended answers to three questions focused on aspects of the debriefing screen used by the instructors and researchers to discuss performance feedback. The first ques- tion asked was “What features of the debriefing screen did you like best?” Results identified two primary features that were most liked including 63% (n = 37) liking the physiological monitoring graph and 31% (n = 18) liking the flight performance tracking graph. No other answer yielded a feature with a greater than 10% response rate (i.e., no frequency count over 4). When asked “What features of the debriefing screen did you like least?” 10% (n = 6) of individuals indicated that there was no working video. While
Applying Human Factors Principles and Analyses to Design an Instructional Display 7
the display did provide a placeholder for video replay as noted previously, this was not a working feature during the training effectiveness evaluation resulting in some trainees mentioning that they would like to see video of their performance (i.e., “Pilot Cam View”). The final question asked trainees “How would you improve the debriefing screen?” The highest frequency responses at 10% (n = 6) each were a request for some type of eye track- ing data and a redesign to address color changes or making buttons larger. The desire for eye tracking data was likely driven by the use of eye tracking glasses as part of the study being conducted in parallel to the training effec- tiveness evaluation. The results for the debriefing screen were largely positive, with the two graphs taking the central focus. Dislikes were minor, focusing on aesthetics and lack of eye tracking, which was exploratory in nature, and represented a small percentage of the sample.
A small sample (n = 3) of usability feedback was also collected from instructors qualified to train dynamic altitude breathing threats at the ASTCs and who had participated as instructors in the parallel study, providing them with hands on use opportunities with both the real-time and post event dis- plays. This sample size falls within the recommended minimum of 3 and ideal of 5 evaluators to find on average 60-75% of usability problems in an inter- face (i.e., Nielsen, 1993, pg. 156). Instructor feedback was captured using an assessment tool based on design heuristics (Atkinson et al., 2015) that has been demonstrated to support the capture of end user usability feedback in several use cases (e.g., Rickel et al., 2020; Tindall & Atkinson, 2015).
Overall, instructor feedback provided high ratings related to Graphic Design & Aesthetics heuristic. Open ended feedback highlighted that the graphics and display data included in the interface was “very useful for instructors to debrief a student utilizing the metrics provided.” The consensus was that the display was easy to read and understand and felt “balanced.” While the instructors noted that “The graph is much larger and more user friendly than the graph displayed on the MOBD,” there were recommenda- tions to allow instructors to expand the chart to provide an even better view. Additionally, there was a note that “data could be simplified and stream- lined to show interactions between altitude and time vs. heartrate, SpO2, and breath rate.” One specific recommendation that highlighted these data points as “the most important metrics to debrief the student” implied the use of automated filtering to declutter the display based on type of dynamic breathing experience and subject matter expert identified priority data could help simplify the display.
Moderate ratings were assigned to heuristic categories including User Inter- action Control, Learnability, and Consistency. For User Interaction Control, instructors highlighted the ease of navigating the display but noted that some sections of the display were confusing. In review of those aspects identified (e.g., Metric Highlight), it is likely these were found problematic due to the placeholder nature of the data used to fill them versus the actual utility of a working capability. For this reason, future usability analyses once the system is fully implemented should focus on analysis of these sections. Additionally, one instructor found switching between touch and keyboard/mouse interac- tion with the system to be a challenge that should be revisited. With respect
to Learnability, instructors noted no formal training was provided but over- all the system was easy to learn due to the simplified and straightforward display. Additionally, it was noted that instructors with more hands on inter- face time reported higher overall learnability ratings than instructors who had relatively less hands on time with the system. Finally, Consistency was assigned a moderate rating. Generally, instructors noted that the relevant data visual presentation across dynamic breathing threat experiences and displays remained consistent (e.g., time, section layout); however, the primary incon- sistency identified was due to data integration issues between the FBAT and the instructor display.
Lowest ratings were related to User Efficiency, with feedback focused on clutter on the display and the graph. Recommendations were to increase fil- tering capabilities and remove unnecessary aspects of the display (e.g., script). Finally, Error Handling & Feedback and Help heuristics were marked as not applicable across instructors. For this reason, future design cycles and evaluations should consider these aspects of the interface and system.
CONCLUSION
Throughout this effort, there was careful consideration of the data that would increase the safety and effectiveness of Dynamic Altitude Breathing Threats Training. As a result, a prototype design for both real-time and post- event instructional displays were designed and refined to maximize the utility and intuitiveness of displays. However, as with any new display, there are opportunities to increase the usability when human factors analyses can be accomplished. For this reason, a collaborative testing process with instruc- tors and trainees who will use the system was implemented to understand the usability strengths and limitations.
The resulting display designs offer instructors a significant advance- ment over previous technology solutions for legacy training associated with hypoxia recognition and mitigation. Additionally, instructor feedback on the simplicity of the system and ease of learning are positive inputs on the prelimi- nary design. The most significant positive response was the importance of the feedback that the instructor debrief display provides; instructors noted that this data “will be extremely helpful to ensure standardization (inter-instructor reliability) of debriefs across the Naval Survival Training Institute (NSTI).” The recommendation focuses on continuing to develop the capability so that it is “specific to the students’ performance data or provides instructors with a checklist to follow in conjunction with utilizing the graph metrics to highlight the specific performance points.” This feedback in addition to the training effectiveness evaluation narratives demonstrates that the system design meets early objectives and through continued iteration and development will serve to increase safety and training effectiveness in the future.
ACKNOWLEDGMENT
The views of the authors expressed herein do not necessarily represent those of the U.S. Navy or Department of Defense (DoD). Presentation of
Applying Human Factors Principles and Analyses to Design an Instructional Display 9
this material does not constitute or imply its endorsement, recommenda- tion, or favoring by the DoD. This work was sponsored by the Office of Naval Research (ONR) Global TechSolutions program. The efforts described were accomplished with closer collaboration from the Naval Survival Train- ing Institute and NAS Pensacola Aviation Survival Training Center. Special thanks goes to the Naval Aerospace and Operational Physiologists, instruc- tors, and staff who supported data collection activities. NAWCTSD Public Release 23-ORL037 Distribution Statement A – Approved for public release; distribution is unlimited.
REFERENCES
Alagha, B., Ahmadbeigy, S., Moosavi, S. A. J., & Jalali, S. M. (2012). Hypoxia symptoms during altitude training in professional Iranian fighter pilots. Air Medical Journal, 31(1), 28–32. Atkinson, B. F., Tindall, M. J., Anania, E. C. (2019). The Development of a Hybrid
Approach to Usability Assessment: Leveraging a Heuristic Guidance Framework for End User Feedback. In: Ahram, T., Falcão, C. (eds) Advances in Usability, User Experience and Assistive Technology. AHFE 2018. Advances in Intelligent Systems and Computing, vol. 794. Springer, Cham. https://doi.org/10.1007/978- 3-319-94947-5_48 Cable, G. G. (2003). In-flight hypoxia incidents in military aircraft: causes and implications for training. Aviation, Space, and Environmental Medicine, 74(2), 169–172. Denison, D. M., Ledwith, F., & Poulton, E. C. (1966). Complex reaction times at sim-
ulated cabin altitudes of 5, 000 feet and 8, 000 feet. Aerospace Medicine, 37(10), 1010–1013. Department of the Navy. (2020, August 1). NATOPS General Flight and Operating Instructions Manual (DoD Publication no. CNAF M-3710.7). San Diego, CA: Commander Naval Air Forces Pacific. Federal Aviation Administration (2016). Introduction to Aviation Physiology.
Retrieved from: https://www.faa.gov/about/office_org/headquarters_offices/avs/ offices/aam/med_pilots/ps_training/ Green, R. G., & Morgan, D. R. (1985). The effects of mild hypoxia on a logical reasoning task. Aviation, space, and environmental medicine, 56(10), 1004–1008. Johnston, B. J., Iremonger, G. S., Hunt, S., Beattie, E. (2012). Hypoxia train-
ing: symptom replication in experienced military aircrew. Aviation, Space, and Environmental Medicine, 83, 962–967. Legg, Stephen, et al. (2012). Could mild hypoxia impair pilot decision making in emergencies?. Work: A Journal of Prevention, Assessment and Rehabilitation, 41, 198–203. Malle, C., Quinette, P., Laisney, M., Bourrilhon, C., Boissin, J., Desgranges, B.,
Eustache, F., & Piérard, C. (2013). Working memory impairment in pilots exposed to acute hypobaric hypoxia. Aviation, Space, and Environmental Medicine, 84, 773–779. National Aeronautics and Space Administration (2020). NASA Engineering and Safety Center Technical Assessment Report: Pilot Breathing Assessment (docu- ment #NESC-RP-18-01320) public version. Nielsen, J. (1993). Usability engineering. San Diego, CA: Academic Press. Pickard, J. S. (2002). The atmosphere and respiration. In: R. L. Dehart & J. R. Davies
(Eds) Fundamentals of Aerospace Medicine (3rd Edition). Philadelphia: Lippincott Williams and Wilkins, 19–38.
Rickel, E. A., Chaparro, B. S., Tindall, M. J., Wheeler Atkinson, B. F., & Anania, E. (2020). Demonstrating the need for usability assessment within software development standards. Proceedings of the 2020 Interservice/Industry Training, Simulation, and Education Conference. Smith, A. M. (2008). Hypoxia symptoms in military aircrew: Long term recall vs
acute experience in training. Aviation, Space, and Environmental Medicine, 79, 54–57. Tindall, M. J., & Atkinson, B. F. W. (2015). Assessing usability of a postmission reporting technology. In Stephanidis, C. (Ed.), HCI International 2015 - Posters’ Extended Abstracts, Communications in Computer and Information Science (Vol. 528, pp. 74–78). Springer, Cham. https://doi.org/10.1007/978-\ 3-319-21380-4_14 Westerman, R. A. (2004). Hypoxia familiarisation training by the reduced oxygen
breathing method. Aviation Medicine, 5, 11–15.
LISTED IN THE AHFE DIGITAL BOOKSTORE CATALOGUE
Explore the complete digital volume
Human-Centered Design and User Experience
Read this individual research paper free through the original publisher, or explore the full digital proceedings book.
ISBN 978-1-958651-90-2
Explore this ISBN in the AHFE Bookstore ↗Listed in the July 2026 bookstore catalogue; search by ISBN to confirm current availability · Digital book purchase optional