Hiroki Nakanishi, Yuichi Kurita (2024). Tactile Estimation of Surface Texture Based on Heightmap Image Features and Customer Attribute Information. In: Kansei Engineering. AHFE Open Access, vol. 145, pp. 28–35. https://doi.org/10.54941/ahfe1005138
In this study, we investigated whether the accuracy of tactile estimation of surface textures can be improved by considering the customer's attribute information. We transformed the texture into a heightmap image and used the image features as input for tactile estimation by machine learning. The results show that the accuracy of tactile estimation is statistically improved by taking into account the gender, risk preference, and personality of the subjects. This method is expected to be useful for designers to adjust products according to the customer and to improve product quality based on tactile sensation.
The surface texture of products affects not only the product’s appearance and functionality but also the product’s haptic sensation. Previous research examined how haptic surface texture affects users’ product evaluations, with demonstrations in diverse contexts such as automobile interiors (Yun et al., 2004) and cosmetic case textures (Ritnamkam et al., 2016). The satisfac- tion derived from such texture is termed Kansei Quality, highlighted as an extra value distinguishing the product from competitors. Product develop- ment based on tactile typically follows a design, prototype production, and tactile evaluation sequence, where participants evaluate the product to pro- vide feedback. However, prototyping and conducting tactile evaluation is both time-consuming and costly. Hence, a sensory engineering approach has been suggested to quantitatively estimate tactile sensation from 3D surface texture data during the design phase (Elkharraz et al., 2014).
Nevertheless, its tactile prediction methods and accuracy verification focus on all subjects’ average tactile evaluation values, thereby overlooking individual differences in tactile evaluation (Natsume et al., 2019). Effec- tive marketing strategies are developed by segmenting customers based on attribute information to target specific customer groups (Wendell, 1956). Pre- vious research found that varying the tactile sensations of smartphone cases influenced their pricing, revealing a correlation between customer attributes and pricing based on tactile evaluation (Kadoya et al., 2022). Therefore, this
Tactile Estimation of Surface Texture Based on Heightmap Image Features 29
study examines whether incorporating subjects’ demographics information and personalities can enhance the accuracy of tactile estimation from surface texture data compared to overall average evaluations, with the aim of pro- viding a valuable method for designers to adjust products according to the customer and to improve product quality based on tactile sensation.
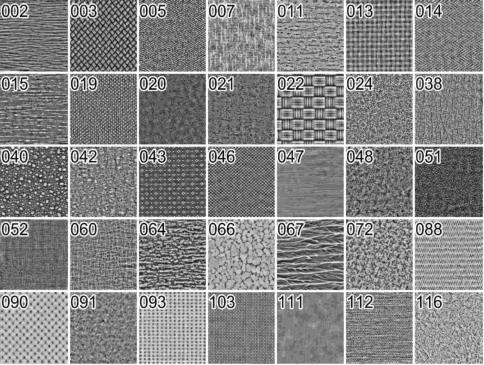
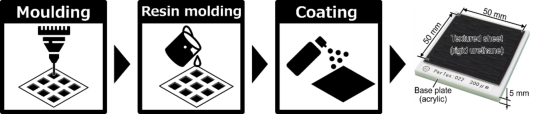
CREATION OF TEXTURE SAMPLE In this study, tactile samples were created using heightmap images. The heightmap image is an image where each pixel represents the height of a specific point on the surface, known as a data format that expresses sur- face texture shapes. We selected 35 heightmaps from the Pertex heightmap database (Halley, 2012) (see Figure 1). A total of 105 samples were fab- ricated by creating three different maximum height variations - 100, 200, and 300 µm - from 35 selected heightmaps, using rigid urethane material. The process involved creating silicone molds from the heightmaps, casting them with polyurethane resin, applying acrylic pigments to texture sheets, and attaching them to acrylic boards (see Figure 2). These samples were selected to accommodate experimental time constraints and encompass a diverse range of patterns. The texture samples do not pertain to any spe- cific product, as the aim is to ensure the estimation method’s applicability across various products.
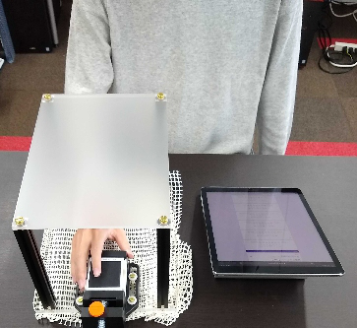
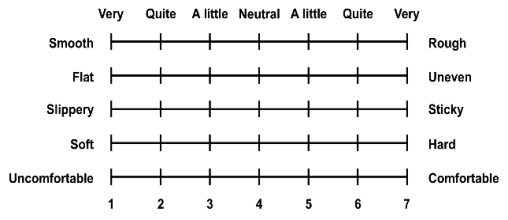
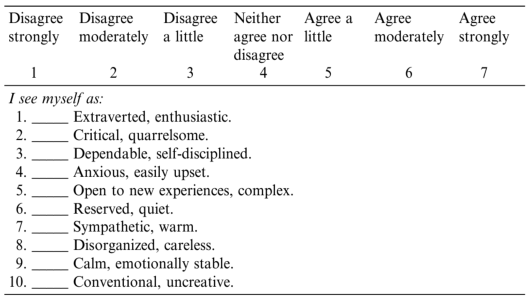
EVALUATION EXPERIMENT A tactile evaluation experiment was conducted with 16 healthy university students (nine male and seven female), averaging 22.9 ± 1.2 years old. In the evaluation task, participants freely explored the samples with their right index finger and utilized a 7-point Semantic Differential (SD) ques- tionnaire based on six pairs of adjectives on a tablet for evaluation (see Figure 3, 4). An opaque acrylic board was used to eliminate the influence of visual information, and the presentation order was randomized to counter- act order effects. Participants also answered a questionnaire covering gender as a demographic attribute, risk preference and personality as a psychologi- cal attribute. Personality traits were measured using the TIPI-J questionnaire (Oshio et al., 2012) (see Figure 5), which aims to assess the Big Five person- ality factors (Extraversion, Agreeableness, Conscientiousness, Neuroticism, Openness). These questions (see Table 1) were selected to obtain a wide range of responses from university students, referring to Kadoya’s study (Kadoya et al., 2022), which examined the impact of tactile sensations on pricing different smartphone cases and identified attribute information influencing pricing factors from the results.
Tactile Estimation of Surface Texture Based on Heightmap Image Features 31
Figure 5: TIPI (English version) (Gosling, 2003).Table 1. Attribute information questionnaire.
Table available in the original PDF paper.
Category Item Question Gender Please tell us your gender (Man/Woman).
Statistical Attributes Psychological Attributes Risk Preference When you usually go out, at what percentage of precipitation probability do you decide to bring an umbrella?
Personality Japanese version of The Ten-Item Personality Inven- tory (TIPI-J)
SEGMENTATION Based on the questionnaire results related to attributes, we determined the criteria for dividing the subjects (see Table 2). Regarding risk preference, as half of the participants answered 50%, we divided them into three segments based on this criterion. For personality, we divided participants into two segments based on the average values of each Big Five trait. To assess the appropriateness of the segments, we calculated Krippendorff’s alpha coeffi- cient (Krippendorff, 2011) as inter-rater reliability. Segments with coefficients below 0.2 were excluded from the analysis. The excluded segments are all of Smooth-Rough and some of Soft-Hard, where a slash is drawn in the following table (see Table 4).
Risk Preference Risk Lover : Precipitation Probability > 50% Risk Neutral : Precipitation Probability = 50% Risk Avoidance : Precipitation Probability < 50% Personality [Big Five] - High : Above Average [Big Five] - Low : Below Average
32 Nakanishi and Kurita
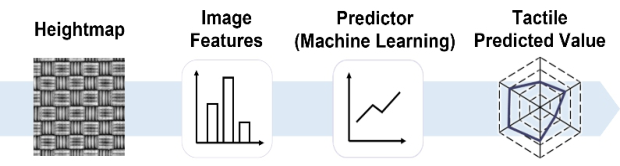
TACTILE ESTIMATION ACCURACY VERIFICATION We employed the method proposed by Elkharraz (Elkharraz et al., 2014) to create a tactile prediction model. This approach involves scaling the heightmap image to incorporate height information, extracting image fea- tures, and predicting tactile sensation using Partial Least Squares Regression (PLSR) to avoid multicollinearity (see Figure 6). The image features used for prediction shown in Table 3, and those definitions follow The Image Biomarker Standardisation Initiative (IBSI). We created models correspond- ing to each segment and evaluated their accuracy using Nested Leave Sample Out Cross-Validation. We performed parameter tuning through grid search with latent variables 1 to 30 for PLSR. To validate accuracy improvement through segmentation, we compared a conventional model using average tactile evaluations of all participants and a proposed model using only segment-specific subjects data. Mean Squared Error (MSE) served as the accuracy metric. Using the Wilcoxon signed-rank one-sided test, we identified statistically significant differences in the average MSE between the models, suggesting the effectiveness of considering subjects’ attributes in tactile pre- diction (see Table 4). The slashes within the table denote items excluded based on the inter-rater reliability as mentioned above.
First Oder Statistics Variance Skewness Kurtosis Uniformity Entropy Second order statics (GLCM features) Contrast Correlation Sum of Squares Inverse difference moment Sum variance Sum entropy Entropy Difference variance Difference entropy
Tactile Estimation of Surface Texture Based on Heightmap Image Features 33
DISCUSSION
The areas indicated by the red asterisks in Table 4 were found to improve the accuracy of tactile prediction by considering their attribute informa- tion. We discuss the areas where the effectiveness of the proposed method was remarkable. Considering gender significantly improved accuracy, par- ticularly in assessing the roughness of “Flat-Uneven”. In previous studies, differences in tactile evaluation between men and women have been found, and it has been due to the density of neural arrangement caused by differ- ences in hand size between the genders (Peters et al., 2009). Flat-Uneven corresponds to macro-roughness, a sensation felt just by putting a finger on a surface. The fact that we could account for differences in tactile sensa- tion caused by finger size between men and women may have contributed to the improved prediction accuracy in this study. Considering risk pref- erences significantly improved accuracy, particularly in assessing the sense of friction “Slippery-Sticky”. In a previous study (Kadoya et al., 2022), a relationship between risk preference and tactile preference for smart- phone cases was found, which was speculated to be due to the frictional sensation being related to the safety of the product by making it easier to hold and harder to drop. Although we did not limit the target prod- ucts in this study, it is possible that the subjects acquired specific tactile senses based on their risk preferences in their daily lives and that their evaluation of the friction senses was consistent across risk preferences. Per- sonality traits improved prediction accuracy in some items, affirming the validity of segmentation based on the Big Five traits. Previous studies have suggested that extraversion and activity in the primary somatosensory cor- tex, an area of the cerebral cortex that processes pain and touch, may be involved (Michael, 2012). However, the relationship between personality and haptic perception is largely unexplored. This study found that Consci- entiousness, Neuroticism, and Openness improved the prediction accuracy of several tactile adjectives. As a whole, this study helped us to explore new possibilities in the relationship between personality and tactile sensa- tion, which has not been studied much so far, and showed the effectiveness of predicting tactile sensation based on the subject’s personality. Though some segment differences do not show up, increasing the number of partici- pants could establish optimal prediction criteria or consider various attribute combinations.
Conscientiousness High * Low * Neuroticism High Low *
Openness High Low **
CONCLUSION
This study proposed a method for predicting tactile sensations based on the observer’s demographic and personality parameters. As a result, it was found that incorporating attribute information into the predictive model improved the accuracy of tactile predictions for some specific adjective items. Based on this study’s method, designers can create product designs that cater to individual needs and preferences.
REFERENCES
Elkharraz, G., S. Thumfart, D. Akay, C. Eitzinger, and B. Henson. (2014). “Making Tactile Textures with Predefined Affective Properties”, IEEE Transactions on Affective Computing 5 (1): 57–70. Gosling, S. D. Rentfrow, P. J and Swann, W. B. (2003). “A very brief measure of the
big-five personality domains”, Journal of Research in Personality, 37(6):504–528. Halley, F. (2012). “Perceptually relevant browsing environments for large texture databases”. Kadoya, Y. Khan, M. S. R. Watanapongvanich, S. Fukada, M. Kurita, Y. Takahashi,
M. Machida, H. Yarimizu, K. Kimura, N. Sakurai, H. Nakamura, K and Ebara, R. (2022). “Consumers’ willingness to pay for tactile impressions: A study using smartphone covers”, IEEE Access, 10:85180–85188. Krippendorff, K. (2011). “Computing krippendorff’s alpha reliability”. Michael, Schaefer. Hans-Jochen, Heinze and Michael Rotte. (2012). “Touch and personality: Extraversion predicts somatosensory brain response”, NeuroImage, vol. 62, no. 1, pp. 432–438. Natsume, M. Tanaka, Y and Kappers, A. M. L. (2019). “Individual differences in
cognitive processing for roughness rating of fine and coarse textures”, PLOS ONE, 14(1):1–16.
Tactile Estimation of Surface Texture Based on Heightmap Image Features 35
Oshio, S. Abe, S and Pino, C. (2012). “An attempt to create a japanese version of the ten item personality inventory (tipi-j)”, The Japanese Journal of Personality, 21(1):40–52. Peters, R. M. Hackeman, E and Goldreich, D. (2009). “Diminutive digits discern del-
icate details: Fingertip size and the sex difference in tactile spatial acuity”, Journal of Neuroscience, 29(50):15756–15761. Ritnamkam, S and Chavalkul, Y. (2016). “The influence of textured surfaces of cosmetic packaging on consumers’ feelings”, Environment-Behaviour Proceedings Journal, 1(3):123–131. Wendell R, Smith. (1956), “Product differentiation and market segmentation as
alternative marketing strategies”, Journal of Marketing, vol. 21, no. 1, pp. 3–8 Yun, M. H. You, H. Geum, W and Kong, D. (2004). “Affective evaluation of vehicle interior craftsmanship: Systematic checklists for touch/feel quality of surface- covering material”, Proceedings of the Human Factors and Ergonomics Society Annual Meeting, 48(6):971–975.
LISTED IN THE AHFE DIGITAL BOOKSTORE CATALOGUE
Explore the complete digital volume
Kansei Engineering
Read this individual research paper free through the original publisher, or explore the full digital proceedings book.
ISBN 978-1-964867-21-2
Explore this ISBN in the AHFE Bookstore ↗Listed in the July 2026 bookstore catalogue; search by ISBN to confirm current availability · Digital book purchase optional