Huang Fei-Hui (2024). Analyzing the Factors Influencing Scooter Usage and Safety Among Young Riders in Taiwan. In: Human Factors in Design, Engineering, and Computing. AHFE Open Access, vol. 159, pp. 2096–2103. https://doi.org/10.54941/ahfe1005777
Approximately 1.24 million people die every year on the world’s roads, and another 20 to 50 million sustain nonfatal injuries as a result of road traffic crashes (WHO, 2013). Unfortunately, this number has not changed significantly over the past 10 years. Worldwide, traffic accidents are the leading cause of death for people aged 15-29 years and the ninth leading cause of death across all age groups (WHO, 2015). According to the World Health Organization (WHO, 2005), motor vehicle accidents are the second most frequent cause of death for individuals aged 5-29 years, and projections indicate that these figures will increase by about 65 percent over the next 20 years unless new commitments to prevention are made (WHO, 2004). In Taiwan, statistics from the Directorate General of Highways indicate that in 2020, there were 14.97 million licensed scooter riders, among whom approximately 1.42 million were young people aged 18 to 25, representing nearly 10% of the total. A significant number of young individuals are involved in scooter accidents. Data from 2020 show that among the fatalities within 30 days of road traffic accidents, 293 were scooter riders aged 18-24 (including those riding large scooters). The age group 18-19 exhibits the highest fatality rates from scooter accidents. Additionally, the injury rate for individuals aged 18-29 is three times higher than for other age groups. The highest incidence of scooter accidents occurs among students and young professionals. This study aims to explore potential alternative transportation options for young people and their demand for such alternatives. We plan to conduct a quantitative survey among students aged 18-24 to understand their perceptions and attitudes towards transportation modes, their experiences with scooter use, and their satisfaction levels. We aim to collect at least 100 and up to 500 valid questionnaires for statistical analysis. The results will provide insights into the primary reasons young people in Taiwan use scooters as a means of transportation and identify potential demands for alternative transportation methods or enhanced safety designs for scooter riding. Ultimately, the goal is to propose suggestions for improving road traffic safety for scooter riders.
In 1997, the Swedish Parliament adopted Vision Zero, an ambitious traffic safety initiative aimed at eliminating fatalities and serious injuries within the road transportation system. Despite this commitment, approximately 1.24 million people die annually on the world’s roads, with another 20 to 50 million sustaining nonfatal injuries due to road traffic crashes (WHO, 2013). Unfortunately, this number has not changed significantly over the past decade, indicating that while traffic safety remains a long-term focus, effective methods to achieve this goal are still elusive.
A U.S. national survey revealed that over 80 percent of respondents believe accidents are preventable, though fewer view them as predictable or within human control (Girasek, 2015). Despite road traffic injuries being a leading cause of death for many years, the WHO emphasizes that most traffic incidents are both predictable and preventable (WHO, 2015). Similarly, the Centers for Disease Control and Prevention (CDC) recognizes “improved global road safety” as a significant public health achievement (Satterwhite et al., 2011). Accordingly, Vision Zero asserts that system designers are ultimately responsible for the design, management, and operation of the road transport system, sharing responsibility for its overall
Analyzing the Factors Influencing Scooter Usage and Safety Among Young Riders 2097
safety. Road users are expected to adhere to the rules established by these designers. If users fail to comply due to lack of knowledge, acceptance, or ability, or if injuries occur, system designers must implement additional measures to prevent fatalities or serious injuries (Fahlquist, 2006).
Globally, traffic accidents are the leading cause of death for people aged 15–29 years and the ninth leading cause of death across all age groups (WHO, 2015). According to the World Health Organization (WHO, 2005), motor vehicle accidents are the second most frequent cause of death for individuals aged 5–29 years, with projections indicating a 65 percent increase in these figures over the next 20 years unless new prevention measures are adopted (WHO, 2004). Public transportation by train or bus is generally safer than travel by car, and increasing public use of these modes can enhance overall safety, even if this improvement is not always reflected in the fatalities per mile driven.
In Taiwan, a 2022 survey on public transportation usage revealed that the market share for public transportation was 14.3%. The market share for private motor vehicles remained steady at 72.3%, while non-motorized vehicles (including walking, cycling, and electric scooters) accounted for the remainder. Among various modes of transportation used for daily trips in 2022, scooters ranked highest at 45.8%, followed by private cars at 25.0%, walking at 10.0%, bus services at 6.0%, and rail transport at 5.5%. Furthermore, statistics from the Taiwanese Directorate General of Highways indicate that in 2020, there were 14.97 million licensed scooter riders, with approximately 1.42 million being young people aged 18 to 25, representing nearly 10% of the total. A significant number of young individuals are involved in scooter accidents. Data from 2020 show that among road traffic fatalities within 30 days of an accident, 293 were scooter riders aged 18- 24, including those on large scooters or motorcycles. The age group 18–19 exhibits the highest fatality rates from scooter accidents. Additionally, the injury rate for individuals aged 18–29 is three times higher than for other age groups, with the highest incidence of scooter accidents occurring among students and young professionals.
IMPORTANCE-PERFORMANCE ANALYSIS FOR SCOOTER PRODUCT AND SERVICE DESIGN The safety and satisfaction of scooter riders have become increasingly important areas of focus in transportation research, particularly given the high usage rates and accident statistics associated with this mode of transport. To address these concerns, this study applies Importance- Performance Analysis (IPA) as a valuable tool for assessing the performance and importance of various attributes related to scooter products and services. This section reviews the literature on the application of IPA in product and service design.
IPA is a widely recognized research technique originally developed as a marketing tool to evaluate and guide management strategies (Martilla & James, 1977). Over time, its application has expanded into various fields, including product and service design. The primary goal of IPA is to diagnose
2098 Huang
the performance of different product or service attributes while facilitating data interpretation and offering practical management recommendations (Dwyer et al., 2012). By identifying critical attributes—both strengths and weaknesses—IPA provides insights into which areas managers should focus on (Abalo et al., 2007). This prioritization aids in the optimal allocation of resources to enhance and maintain customer satisfaction.
The dominant model for assessing customer satisfaction is based on the disconfirmation of expectations paradigm (Matzler et al., 2004). According to this model, satisfaction occurs when perceived performance exceeds expectations (positive disconfirmation), while dissatisfaction arises when expectations exceed perceived performance (negative disconfirmation). IPA itself functions as an expectation-disconfirmation model, assessing customer satisfaction as a function of both the importance (or expectations) and performance of various product or service attributes (Martilla & James, 1977). IPA combines measures of perceived performance and importance into a two-dimensional plot, facilitating data interpretation. This plot categorizes attributes into four quadrants, each representing different priorities for resource allocation (Martilla & James, 1977). These quadrants are typically labeled as ‘Keep Up the Good Work’ (Q1), ‘Possible Overkill’ (Q2), ‘Low Priority’ (Q3), and ‘Concentrate Here’ (Q4).
Q1: Keep Up the Good Work - Represents major strengths and potential competitive advantages. Attributes in this quadrant are performing well and warrant continued investment.
Q2: Possible Overkill - Contains attributes that are of low importance but are performing strongly, indicating the potential for resource inefficiency that could be reallocated more effectively.
Q3: Low Priority - Attributes here are not performing well but are also of low importance to customers/travelers. Managers should not prioritize these attributes as they represent minor weaknesses.
Q4: Concentrate Here - The most critical quadrant, representing major weaknesses and threats to competitiveness. Attributes in this quadrant are underperforming and should be the highest priority for investment.
In the context of my research on motorcycle products and services, IPA will serve as a crucial tool for analyzing traveler feedback on design attributes. By mapping out which aspects of the products and services are most important to travelers and how well they perform, this analysis will provide actionable insights into where resources should be allocated to improve traveler satisfaction and competitiveness.
METHODS
To assess the traveler experience with scooter usage, a quantitative survey based on the IPA approach was conducted. Convenience sampling was used to select young travelers (aged 18–29) for the study. Participants provided personal information (such as gender and age) with anonymization ensured for research ethics. They also shared their reasons for going out (through
Analyzing the Factors Influencing Scooter Usage and Safety Among Young Riders 2099
a multiple-choice format) and their primary, secondary, and tertiary modes of daily transportation. Additionally, participants rated their experiences of riding or being a passenger on a scooter using a 7-point Likert scale, evaluating five dimensions: practicality, convenience, cost, environmental considerations, and traffic safety. The aim was to gain insights into the factors influencing their choice to use a scooter and to understand the perceived advantages and disadvantages of riding private scooters or e-scooters.
RESULTS
In this study, a total of 150 valid questionnaires were collected from travelers, comprising 80 males and 70 females. The age distribution is as follows: 2.7% are under 18 years old, 9.3% are between 18 and 20 years old, 46.7% are between 20 and 25 years old, and 41.3% are between 26 and 30 years old. The most common reasons for travel are commuting (86%), leisure travel (48%), and shopping/errands (45%). Business trips (29%), leisure/exercise (25%), medical needs (13%), and visiting family/friends (12%) are less frequent (see Table 1). Table 2 presents the distribution of various modes of transportation categorized into primary, secondary, and tertiary modes. Public transportation is the most frequently used primary mode (70 respondents), followed by private scooters (59 respondents). For secondary modes, walking is the most common (35 respondents), with private scooters and public transportation also notable. In the tertiary category, walking is predominant (56 respondents), with bicycles and shared vehicles also represented. Private cars and other modes have minimal representation across all categories.
Table 1. Demographic characteristics and reasons for going out.
Table available in the original PDF paper.
Category Items N % Gender Male 80 53.3% Female 70 46.7% Age
Under 18 4 2.7% 18–20 14 9.3% 20–25 70 46.7% 26–30 62 41.3% Reasons for going out Commuting 129 86% Travel 72 48% Shopping/Errands 68 45% Business Trips 44 29% Leisure/Exercise 37 25% Medical Needs 19 13% Visiting Family/Friends 18 12%
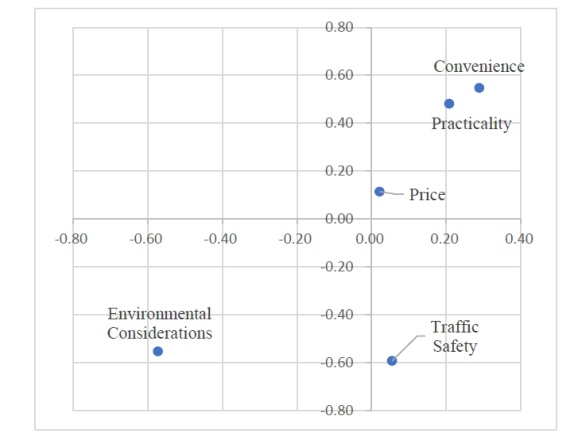
The IPA results, as shown in Figure 1, indicate that the dimensions of Practicality, Convenience, and Price are characterized by high performance
2100 Huang
and significant importance. This suggests that these three factors are considered major strengths of scooters by travelers. Maintaining high levels in these dimensions is likely to ensure continued traveler support for scooters as a mode of transportation. Conversely, travelers perceive the dimension of Environmental Considerations as a low priority, with both low performance and low importance. This attribute does not significantly impact their satisfaction and should not be a primary focus. Meanwhile, Traffic Safety remains a low-performance but high-importance area, indicating that participants believe the most crucial improvement needed for scooters is enhancing road safety.
Table 2. Respondents’ preferred modes of transportation: primary, secondary, and tertiary choices.
Notes: Primary mode refers to the most commonly used transportation method. Secondary Mode refers to the second most commonly used transportation method. Tertiary Mode refers to the third most commonly used transportation method. “–” indicates no data or negligible usage for that category.
Analyzing the Factors Influencing Scooter Usage and Safety Among Young Riders 2101
DISCUSSION
This study employed a subjective measurement approach to assess factors influencing scooter usage and safety among young riders (under 30 years old) in Taiwan. The analysis utilized Importance-Performance Analysis (IPA) specifically on scooter usage to evaluate five dimensions: practicality, convenience, price, environmental considerations, and traffic safety.
The findings indicate that respondents primarily rely on public transportation and private scooters for their transportation needs. Secondary modes include walking and shared vehicles, with bicycles as a tertiary option. The primary motivations for going out include commuting for work or study, leisure activities, and shopping/errands. This pattern suggests that short- distance travel is predominant among the under-30 age group, and scooters are favored for their convenience and speed, especially for time-sensitive trips. Despite the availability of more environmentally friendly alternatives, the preference for fuel-powered scooters remains high among young riders.
Further analysis of the strengths and weaknesses of scooters, based on the IPA results, reveals that the primary advantages of scooter usage lie in their practicality, convenience, and affordability. These factors are crucial in meeting the daily transportation needs of young riders. The practicality and ease of use of scooters, combined with their competitive pricing, contribute significantly to their widespread adoption. However, the study also highlights the relatively low adoption of electric scooters, indicating an area for potential improvement in promoting more sustainable transportation options. To enhance scooter safety and promote a shift towards more environmentally friendly transportation options, several strategies should be considered:
Enhance Convenience Features in Public Transportation: The study suggests that young riders prioritize convenience, which is a key factor in their preference for scooters. To reduce scooter usage, public transportation must improve in terms of convenience and practicality. Integrating various transportation modes and offering real-time updates can help make public transport more attractive to this demographic. Enhancing the overall user experience and reducing wait times are also critical.
Adjust Pricing Strategies: Competitive pricing is another reason why scooters are favored by young riders. To encourage a shift towards public or environmentally friendly transportation, it is crucial to ensure that these alternatives are priced competitively and provide clear financial benefits. Adjusting pricing strategies could make public transportation or electric scooters more appealing.
Raise Awareness About Environmental and Safety Concerns: Environmental and safety considerations are often overlooked by young scooter riders. Therefore, targeted marketing strategies should focus on educating this demographic about the environmental impact and safety risks associated with fuel-powered scooters. By providing clear and compelling information, young riders may be more inclined to consider alternative modes of transportation that are safer and more sustainable.
2102 Huang
Improve Traffic Safety for Scooters: Traffic safety is a major concern among young riders, and the study underscores the need for improved safety measures in scooter design and infrastructure. Enhancing the safety features of scooters and emphasizing the relative safety of public transportation could be effective strategies in reducing scooter-related accidents and encouraging a shift towards safer transportation options.
CONCLUSION
This study emphasizes the use of IPA for evaluating scooter products and services among young travelers. The analysis reveals that while scooters are favored for their practicality, convenience, and affordability, there is a gap in their environmental impact and traffic safety. The findings suggest that, despite a general preference for environmentally friendly transportation, private scooters remain a prevalent choice due to their perceived benefits in functionality and cost. To address these challenges, several strategies are recommended: enhancing the convenience of public transportation, adjusting pricing strategies to make alternatives more appealing, raising awareness about the environmental impact of scooter use, and improving traffic safety. Implementing these strategies can help policymakers and transportation planners better align transportation options with user needs and environmental goals, potentially improving public safety and sustainability. Future research should focus on evaluating the effectiveness of these strategies in real-world settings and exploring additional factors influencing transportation choices among young travelers.
ACKNOWLEDGMENT
The authors would like to acknowledge the financial support provided by the National Science and Technology Council (NSTC) of Taiwan under Grant No. NSTC 113-2221-E-161-003.
REFERENCES
Abalo, J., Varela, J., & Manzano, V. (2007). Importance values for Importance– Performance Analysis: A formula for spreading out values derived from preference rankings. Journal of Business Research, 60(2), 115–121. Dwyer, L., Gill, A., & Seetaram, N. (Eds.). (2012). Handbook of research methods
in tourism: Quantitative and qualitative approaches. Edward Elgar Publishing. Fahlquist, J. N. (2006). Responsibility ascriptions and vision zero. Accident Analysis & Prevention, 38(6), 1113–1118. Girasek, D. C. (2015). How members of the public interpret the word accident. Injury
prevention, 21(3), 205–210. Martilla, J. A., & James, J. C. (1977). Importance-performance analysis. Journal of marketing, 41(1), 77–79. Matzler, K., Bailom, F., Hinterhuber, H. H., Renzl, B., & Pichler, J. (2004). The asymmetric relationship between attribute-level performance and overall customer satisfaction: a reconsideration of the importance–performance analysis. Industrial marketing management, 33(4), 271–277.
Analyzing the Factors Influencing Scooter Usage and Safety Among Young Riders 2103
Satterwhite, C. L., Gottlieb, S. L., Romaguera, R., Bolan, G., Burstein, G., Schuler, C., & Popovic, T. (2011). CDC Grand Rounds: Chlamydia prevention: challenges and strategies for reducing disease burden and sequelae. JAMA: Journal of the American Medical Association, 305(17). WHO/UNICEF Joint Water Supply, & Sanitation Monitoring Programme. (2015). Progress on sanitation and drinking water: 2015 update and MDG assessment. World Health Organization. World Health Organization, & Global Buruli Ulcer Initiative. (2004). Report of the
7th WHO Advisory Group Meeting on Buruli Ulcer: 8–11 March 2004, WHO headquarters, Geneva, Switzerland (No. WHO/CDS/CPE/GBUI/2004.9). World Health Organization. World Health Organization. (2005). The World Health Report 2005: Make every mother and child count. World Health Organization. World Health Organization. (2013). WHO traditional medicine strategy: 2014–2023. World Health Organization. World Health Organization. (2015). World report on ageing and health. World
Health Organization.
LISTED IN THE AHFE DIGITAL BOOKSTORE CATALOGUE
Explore the complete digital volume
Human Factors in Design, Engineering, and Computing
Read this individual research paper free through the original publisher, or explore the full digital proceedings book.
ISBN 978-1-964867-35-9
Explore this ISBN in the AHFE Bookstore ↗Listed in the July 2026 bookstore catalogue; search by ISBN to confirm current availability · Digital book purchase optional