Francesco Deiana, James Jackson, Cristina Periago, Elena Castro (2024). Assessing Driver Engagement in Assisted Driving: Insights From Real Driving Test, Focus Groups and Driving Simulator Tests. Enhancing Safe Driving to Contribute to Future Safety Regulations and Support the Automotive Industry. In: Human Factors in Design, Engineering, and Computing. AHFE Open Access, vol. 159, pp. 2127–2139. https://doi.org/10.54941/ahfe1005781
Publisher statistics will load when you open Metrics.
AHFE OPEN ACCESS OPEN ACCESS CONFERENCE PROCEEDINGS PAPER
Assessing Driver Engagement in Assisted Driving: Insights From Real Driving Test, Focus Groups and Driving Simulator Tests. Enhancing Safe Driving to Contribute to Future Safety Regulations and Support the Automotive Industry
Automated driving assistance systems (ADAS) have become increasingly prevalent in consumer vehicles, particularly at L2 level, offering various degrees of safety and comfort. However, many concerns arise regarding driver attention and engagement, as drivers may not fully understand the system limitations and their continued responsibility for vehicle control. For this reason, driver engagement is a topic of significant interest in the context of ADAS development. The European Commission is already working on future regulations regarding the integration of advanced L2 systems from a safe driving perspective, as is the NHTSA in the US. Driver engagement is included in the EuroNCAP 2030 roadmap and is also being considered as one of the criteria for the assessment of Smart Cockpit according to C-ICAP (2023). This work introduces a methodology aimed at evaluating driver engagement, which combines proving ground testing, focus groups, and dynamic driving simulator testing. Proving ground testing combines subjective metrics such as mental workload and trust, together with objective measures like Time to Collision (TTC). Results indicate differences in driver engagement between medium and advanced level 2 systems, with participants showing higher trust and lower mental workload in advanced L2 systems. Focus groups highlight generational differences in perceptions of ADAS, with younger participants demonstrating higher trust and acceptance. Also, situational awareness emerges as an important factor for a proper engagement. The upcoming driving simulator phase seeks to validate these findings in a controlled environment, integrating physiological measures and eye-tracking. Future steps include conducting cross-cultural studies to capture diverse driving habits and preferences.
Automated driving systems assistance systems (ADAS) have become increasingly prevalent in consumer vehicles, particularly at level 2 classification. These systems offer safety and comfort advantages by automating driving tasks to varying degrees. The Society of Automotive Engineers (SAE) has established six levels of automation, ranging from level 0 where the human driver has full responsibility, to levels 4 and 5 where the system takes complete control of driving. Level 0 corresponds to the full responsibility of the human driver, levels 1, 2 and 3 imply different degrees of shared responsibility between both parties and, finally, levels 4 and 5 place the system as the sole responsible for all aspects of driving (Brookhuis et al., 2009). Concerns have arisen regarding driver inattention and inappropriate behavior when using level 2 systems, as drivers may not fully understand the system limitations and continue to be responsible for vehicle control. While using L1 the driver maintains complete control over the vehicle, actively managing speed, following distance, and trajectory while remaining vigilant to respond to unexpected events in the environment (CATARC, 2023). However, in partially automated vehicles, the driver’s role transits from active controller to passive monitor. The driver is asked with monitoring both the vehicle’s behavior and the driving environment, particularly for specific cases that may necessitate immediate manual intervention. Research indicates that individuals often face challenges when monitoring tasks involving unexpected events, leading to safety concerns about the transition from active control to passive monitoring (CATARC, 2023). These attentional shifts can hinder the timely processing of responses to safety-critical stimuli, such as roadway hazards (Euro NCAP, 2020). Considering these elements is essential for designing driver assistance systems that consider human tendencies and help the driver maintain an appropriate level of focus based on the assistance level provided by the vehicle at that specific moment. Factors such as vehicle instructions, user interface, and system warnings influence the driver’s comprehension of the necessary attention level. The challenge of developing ADAS is to ensure that drivers remain adequately engaged in the driving process, regardless of the automation level.
ASSESSING DRIVER ENGAGEMENT According to Stanton (2016), driver engagement refers to the measure of the degree to which drivers actively participate in the driving task, characterized by their ability to recognize and react to potential hazards promptly and appropriately.
Peters and Mattes (2015) offer a more specific definition, emphasizing the cognitive factor and level of involvement of the driver. They define driver engagement as the extent to which the driver is mentally and physically engaged in the driving task, combining attention, focus, and involvement.
Driver engagement has gained attention in recent years within the realm of driver safety research, becoming a pivotal area of interest within the context of ADAS, as reflected in the EuroNCAP 2030 vision (Jian et al., 2000).
Assessing Driver Engagement in Assisted Driving Insights From Real Driving Test 2129
Additionally, it is recognized as a key criterion for assessing Smart Cockpit technologies according to C-ICAP (2023).
This paper outlines the development and ongoing validation of a methodology by the human factors team at Applus IDIADA, which involves a three-phase process: proving ground testing, implementation, and monitoring of results through focus groups, alongside development and implementation in a simulation context.
Integrating proving ground testing, simulation testing, and focus groups gives a comprehensive validation of the methodology. Proving ground testing allows replication of real-world scenarios in a controlled environment, gathering insights into the driver, system performance and behavior. Simulation testing complements this by exploring a wider range of scenarios and conditions. It enables thorough evaluation of the methodology’s robustness and adaptability across diverse driving environments, hazards and cognitive/visual tasks.
Additionally, incorporating focus groups facilitates gathering qualitative feedback and insights from end-users, aimed, also, at identifying methodological issues and refining the methodology in the next phases.
Evaluation methods for assessing driver engagement in advanced driver assistance systems could include various approaches, including self- report, behavioural, performance, and physiological measures. Due to the complexity of the experiment’s three-phase nature, the methods and metrics used will be described alongside specific parts of the experiment.
OBJECTIVES This study aims to describe the iterative driver engagement evaluation methodology developed by IDIADA. It outlines a three-phase iterative process: testing at a proving ground from 2022 to 2023, conducting focus group sessions in late 2023, and planning a future iterative phase at the end of 2024, presenting the methodology to be applied.
Proving Ground Testing In the first phase, the data collection process was centered on examining driver engagement with the vehicle and the assigned task, employing a combination of subjective and objective metrics to evaluate the driver’s performance and responsiveness in emergency scenarios. This paper will summarize the methodology and findings of the previously published study (Onwuegbuzie et al., 2009).
Focus Groups After conducting the track experiment, N*3 focus groups were arranged to review the experience and collect qualitative data. The goal was to blend participants from the initial phase with newcomers to collect insights.
The reasons for choosing focus groups include:
Limited literature on naïve drivers’ perceptions of ADAS functions prompted the need for deeper exploration.
Methodological triangulation enables a thorough investigation of drivers’ views and offered a follow-up for initial participants.
Data and insights gathered are instrumental in prioritizing and shaping future project phases, following an iterative bottom-up approach.
Driving Simulator Testing Simulator testing offers advantages by incorporating additional tasks and refinements not feasible in on-track testing due to safety constraints. In this paper, we present the methodology developed for use in driving simulator driver engagement testing, scheduled for 2024, with the aim of enhancing its robustness and applicability. Drawing from lessons learned in the first two phases of on-track experimentation and feedback received through focus groups, this methodology includes the ad-hoc creation of a scenario that adequately represents real-world driving conditions, similar to the initial test track used in the experiment, additional cognitive and visual – attentive tasks for the driver and the collection of further data through eye tracking and physiological sensors measuring respiration and heart rate.
PROVING GROUND TESTING Metrics
Subjective metrics like mental workload and trust play a significant role in evaluating driver engagement. There is not a universally accepted definition of mental workload, although some are more widely accepted than others. Brookhuis et al. (2009) defines Mental workload as the “amount of mental effort or cognitive resources that an individual must expend in order to perform a task or set of tasks”. The multi-dimensional conceptualization of mental workload, based on core psychometric properties, has received extensive citations and usage in mental workload research, serving as the foundation for the IWS scale—a recognized tool for measuring mental workload (Peters and Mattes, 2015). Similarly, the definition of trust proposed by Lee and See (2004) has gained widespread acceptance in the human factors literature related to driver attention, having been extensively cited and validated: “trust is an attitude that will help an individual achieve their goals in a situation characterized by uncertainty and vulnerability, which has been shown to play a role in influencing operators’ strategies toward the use of automation”. Trust is known to play an important role in how drivers use ADAS and their level of disengagement from driving tasks.
Objective metrics, in the context of evaluating driver engagement, are measures or evaluation criteria that are based on observable and quantifiable data including speed, acceleration, braking, steering behaviour and vehicle performance indicators. This study employs Time To Collision (TTC) as an objective metric to assess the performance of ADAS systems. As Ozbay et al. (2008) TTC measures the “time it would take for a following vehicle to collide with a leading one if movement characteristics remain unchanged. It can also be explained as the time needed to avoid a collision by applying certain countermeasures”. For specific TTC calculation, former studies generally used the relative distance D (m) between the two vehicles
Assessing Driver Engagement in Assisted Driving Insights From Real Driving Test 2131
divided by their relative speed 1V (m/s) and formulated TTC as follows [Equation (1)]:
Equation reproduced from the original PDF.
Participants Sample This study recruited 39 participants who were non-professional drivers, with 75% having no prior experience with partial driving automation and 25% having prior experience. An equal distribution of 20 males and 20 females was included, with ages ranging from 21 to 58 to reflect the average age of drivers in Spain.
Vehicle Instrumentation Two vehicles were selected for comparison based on their EuroNCAP safety assistance ratings to assess their level of engagement. The chosen vehicles included a 2020 Volkswagen Golf 8, representing a medium level 2 vehicle, and a 2020 Tesla Model 3, representing an advanced level 2 vehicle. Both vehicles were equipped with identical sensors and measurement devices to ensure accurate comparisons. Specifically, the vehicles were outfitted with the Vector Kit, which captures data from the test vehicle bus CAN and other CAN signals, the RT Range for precise geolocation, velocity, acceleration, and lateral acceleration to analyze steering dynamics and three video cameras (forward- facing, rear-facing dashboard/environment).
Test Procedure The sample has been divided into two in-between groups of 20 and 19 participants, each driving one of the two vehicles (Golf 8, L2 and Testa L2 advanced).
The objective was to identify any differences in the engagement level in the two car models.
Before the test, all participants were asked to complete the DSQ questionnaire, French et al. (1993) in order to identify their driving style. The questionnaire included items related to various aspects of driving style, such as speed, calmness, social resistance, focus, planning and deviance.
Upon arrival at the testing facility, participants received a briefing from a Human Factors expert. The briefing covered the study’s procedure, vehicle characteristics and functionality, safety measures and data protection. Participants also completed an ad- hoc questionnaire to assess their emotional state.
Drivers rated their confidence in the system to the co-driver using two scales, the Integrated Workload Scale (IWS) (Jian et al., 2000). and the Trust in Automated System Survey (TASS) (Simon et al., 2012), to the participant at regular 5-minute intervals. The IWS, assessed the participant’s mental workload in different scenarios using a 9- point scale. The TASS,developed by Jian et al. (2000) evaluated the level of trust between humans and machines on a scale from 0% to 100%.
Additionally, objective metrics of driver reaction time in emergency scenarios were analysed, including video recordings, Time to Collision (TTC) response and vehicle trajectory using GPS.
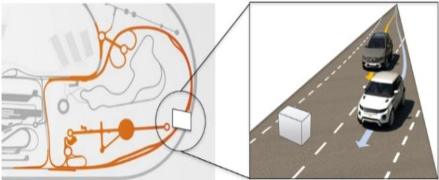
After receiving a description of system functions, participants were instructed to drive on a test track in a continuous highway scenario, with longitudinal and lateral driver assistance functions active while following another vehicle. A critical event was then introduced, simulating an obstacle in the lane that required the driver’s response to avoid. During the penultimate lap, an obstacle was unexpectedly placed in the middle of the lane without prior warning to the participants. As illustrated in Figure I, and to make it invisible for the participants, the obstacle was placed after a bend and hidden by the lead vehicle. This event was designed to simulate a real- world emergency situation, so the lead vehicle executed a cut-out manoeuvre 15 meters before the obstacle. Participants were then required to react to this unexpected event while driving with the assistance systems enabled, depending on their level of attention and engagement with the system at that particular moment.
In the post-test phase, participants underwent a brief, semi- structured interview to gather their subjective feedback and impressions regarding their driving test experience. The interview aimed to collect additional data, including their suggestions, perceptions of system reliability after the critical event (obstacle avoidance test) and suggestions for improving the methodology.
Figure 1: Cut - out manouver.
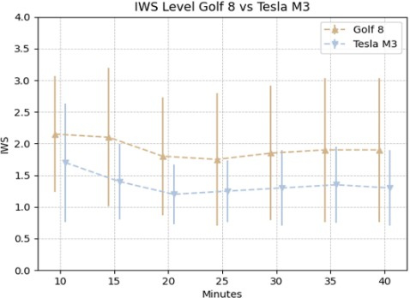
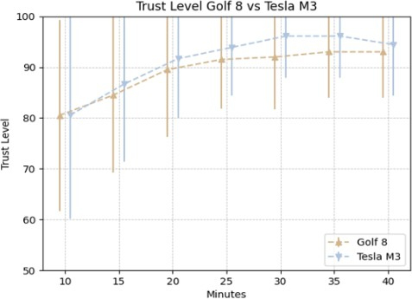
Proving Ground Results The initial round of testing involving the previously mentioned 39 participants was successfully conducted. The collected data were compared between the Golf 8 and the Tesla Model 3, to highlight any variations in the level of engagement with L2 medium and advanced systems. Regarding the subjective data, the levels of workload (IWS) and trust were analysed, with positive results shown in Figure 2 and 3, comparing the Golf 8 and Tesla Model 3. Figure II displays the average level of mental workload, as measured by the IWS, for participants in the Golf 8 and Tesla Model 3, with vertical lines indicating the standard deviation.
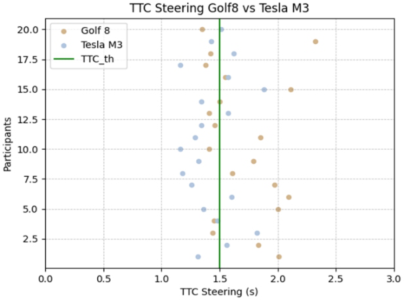
Similarly, Figure 3 shows the trust levels reported by participants for both car models. The target used as a static obstacle had a speed of 0 km/h, while the test car’s speed ranged around 60 km/h, depending on the user case. By applying Equation (1) to the data collected from different participants,
Assessing Driver Engagement in Assisted Driving Insights From Real Driving Test 2133
differences in Time to Collision (TTC) between the Golf 8 and Tesla Model 3 were identified and illustrated in Figure 4.
Figure 2: IWS levels, Golf 8 vs Tesla M3.Figure 3: TASS level Golf 8 vs Tesla M3.Figure 4: TTC steering Golf 8 vs Tesla M3.
The analysis of subjective and objective metrics related to the mental workload perceived by drivers and the level of trust revealed differences between the two types of L2 systems. For what concerns subjective data, as represented in Figures 2 and 3, perceived mental workload is low and trust level is high in the two sistems. None of the participants reported a mental workload level above 5 and the minimum average trust level for both systems was 80%. However, it is possible to underline interesting differences between the two systems. The vehicle equipped with a medium L2 system has higher mental workload value (max. mean value 2,10 – min. mean value 1,75) in the whole test than the vehicle equipped with an L2 advanced system (max. mean value 1,75 – min. mean value 1,2). According to the results, participants perceived a higher level of trust in the vehicle equipped with the advanced L2 System. More specifically, L2 advance vehicle has a max. mean value of 96,1% while the other vehicle has a max. mean value of 93%. Minimum mean value is almost the same in both vehicles (80,6% for L2 advanced and 80,5 for L2 medium). The time-to-collision (TTC) values for the two vehicles showed significant differences. In the advanced L2 vehicle, 60% of participants had a TTC value below the threshold of 1.5 seconds. In contrast, only 45% of participants in the L2 medium vehicle had a TTC below the threshold. These results suggest that the type of L2 system used (advanced or medium) may influence a driver’s reaction time and ability to take control of the vehicle to redirect the maneuver.
FOCUS GROUP Zammuner defines the focus group as a qualitative data collection method, based on a group discussion from which emerge data with regards to a topic that the researcher is interested in investigating in depth. It is difficult to trace a single definition in literature, but the researchers agree in defining it as a “discussion involving from 4 to 12 people who, assisted by a moderator, discuss a topic in a permissive and informal environment”. Focus groups, as a method of empirical qualitative research, play a central role in this study by enabling an in-depth exploration of drivers’ perspectives on system operations and their interactions with the platform to gain a comprehensive understanding of their views and behaviors.
Sample Each focus group included 8 participants, with a recruitment strategy tailored to the following specific criteria: 50% gender distribution, age range between 20 and 60 years old, 50% of people with knowledge of ADAS systems, and 50% of people who have already participated in the first phase of the experiment.
Procedure The three focus groups took place between November and December 2023 in Barcelona, with a total participation of 24 people. The sessions lasted approximately three hours each and were structured as follows:
Assessing Driver Engagement in Assisted Driving Insights From Real Driving Test 2135
Presentations and Ice-Breaking: This phase aimed to break the ice and strategically divide participants into those who had attended the previous phase and those who had not, categorized as “novices” and “experts”.
Training: Brief training on ADAS systems and driver engagement using explanatory videos. Explanation of the pilot test on the track involving the “experts”.
Role Playing: participants who had not attended were asked to put themselves in the shoes of those who had experience with the initial phase. Novices were given the opportunity to ask “experts” for information and insights.
Group Discussion: Following the establishment of a common knowledge base through training and comparison between novices and experts, a facilitated group discussion was held on the usage of ADAS systems and their perception, frequency of use, experience, trust and factors influencing trust, mobility patterns, impact on our lifestyles, risks and safety, towards autonomous driving, ethical considerations, advantages and disadvantages.
Data Analysis Transcript-based analysis is widely recognized as the most robust method for analyzing qualitative data (Yarritu et al., 2014). In this study, we employed principles of qualitative content analysis to analyse the transcripts of focus group discussions. Adopting a bottom-up approach, we developed categories using both inductive and deductive methods (Yarritu et al., 2014). Despite generating a significant volume of qualitative data, much of which was tangential to the topic of driver engagement, only the most pertinent data has been summarized.
Results
Perceived Trust: In general, across all three groups, there is an interesting difference between the “younger audience” (aged between 20 and 45) and the older participants. The younger individuals show high levels of trust in ADAS systems, sharing positive experiences about themselves and their acquaintances, and in some cases, stating they cannot do without them. Conversely, the older participants show significant reluctance towards these systems, considering them unhelpful, overly distracting and dangerous. A commonly shared theme is the ‘unlearning’ of driving skills due to habit, reliance and dependence on systems such as Adaptive Cruise Control (ACC), Lane Keeping Assist (LKA), Automatic Emergency Braking (AEB), Forward Collision Warning (FCW) and Lane Departure Warning (LDW). The most extreme participants deactivate all systems upon starting the vehicle. All participants have in common, based on their own experience, the perceived risk of losing concentration due to overconfidence. Younger participants declare a higher level of potential trust in vehicles popularly considered more modern (e.g., Tesla), while the older audience seems to favor more traditional vehicles. The causes of this difference seem to involve factors such as brand image, cockpit design, and driving experience.
Situational Awareness: A notable theme that emerges “bottom- up” from the discussion is that of situational awareness. According to Stanton (2016), situational awareness is the perception of elements in the environment within a volume of time and space. The ability for some vehicles to create a “virtual” representation of their own vehicle in space is considered extremely relevant by younger participants. They argue that this visualization provides an understanding of their positioning and the surrounding environment, thus contributing to a proper situational awareness during driving. Additionally, the presence of hazard detection and warning systems, including detection and warning alerts, cannot be underestimated as they further enhance the driver’s awareness and safety while on the road.
Proving Ground Experience and “Illusion of Control”: Analyzing the data from the initial phase alongside the “experts”, highlights that the level of engagement was, in some cases, so high that it led to a decrease in perceived control. For instance, some individuals may have experienced the “illusion of control” [18], mistakenly believing they were actively braking when, in fact, it was the vehicle’s automatic braking system responding to the situation. This phenomenon underscores the relation between high engagement levels and perceived control. It is influenced, in addition to personal characteristics, by factors such as the level of understanding of assistance systems which in turn leads to a lack of awareness of the vehicle’s capabilities. Putting themselves in the shoes of those who participated in the experiment, the majority of “novice” participants stated that they would have felt more comfortable and secure with the L2 advanced system than with the L2. While the participants familiar with ADAS systems perceive the experiment’s narrative as an extremely “normal” situation, those unfamiliar declare that they would certainly have collided with the obstacle, finding it hard to believe in the possibility that the vehicle would do it for them.
A Generational Gap: An interesting aspect that emerged from our analysis concerns the generational difference among participants. While younger individuals perceive advanced driving assistance systems as an extension and enhancement of their cognitive abilities, older participants view them as a limitation. This generational disparity reflects broader societal attitudes towards technological innovation and poses a challenge that goes beyond simple driver engagement metrics.
Proving Ground Testing Perceived Limitations: A common limitation that emerged is the potential biases introduced by expectations. Some individuals may have entered the experiment with preconceived ideas or expectations about certain outcomes, which could have influenced their reactions and perceptions. Several of them have indeed stated they “expected something to happen at any moment.” Additionally, the presence of a co-pilot during the experiment may have induced a sense of security or reassurance among participants, potentially altering their perceptions of risk and responses.
Advantages, Acceptance, and Needs: Advantages mentioned by most participants include improved comfort and safety, assistance for less skilled drivers or those with specific physical limitations, perception of reducing human error in driving, perceived comfort and reduced workload. Overall, all participants share the need that technology should be designed to adapt
Assessing Driver Engagement in Assisted Driving Insights From Real Driving Test 2137
to and assist drivers of all ages. It should be as unobtrusive as possible and convey the idea that it is aiding rather than limiting or bothering them, regardless of the level of assistance and the type of vehicle they are driving. For what concerns driver engagement, the discussion highlights the importance of a system that keeps individuals adequately alert and does not disturb them. In other words, it should seamlessly integrate into the driving process while providing assistance. To conclude, some participants shared a reflection and concern about the fear of technological failure or collapse, expressing the belief, in some cases perceived as an awareness, that not all possible situations during driving or an accident can be anticipated and programmed.
DRIVING SIMULATOR STUDY The driving simulator study is planned to be conducted in China, involving local external participants to add a multicultural perspective to the previous phases conducted in Europe.
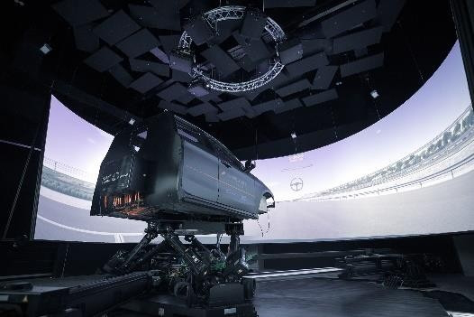
The study testing platform is the VI-grade dynamic simulator DiM250 (Figure 5), which utilizes a mobile platform with nine electronically actuators for dynamic movements and slides on air bearings for rigidity and reliability. The system projects high- definition images onto a 9-meter conical screen using five coordinated high-power projectors for an immersive virtual experience.
ADAS L2 functions such as LKA, ACC, AEB and FCW are going to be implemented to replicate a L2 automated vehicle equivalent to the ones used in the previous phase of the study.
An interface is being developed to integrate L2 functions and provide basic feedback and interaction with the ADAS systems for drivers.
Experiment Procedure The methodology employed will mirror that of the initial phase, leveraging the safety benefits and customizable nature of the simulation environment, which also ensures the creation of a more intricate and challenging methodology for participants. During the test, participants will assess their trust in the system and their mental workload, mirroring the first phase.
Additionally, objective metrics of driver reaction time in emergency scenarios will be gathered, along with physiological data related to heart rate and respiration, as well as eye-tracking data. Using a simulated scenario based on the test track used in the previous phase, drivers will navigate a highway with a minimum of two lanes, with ADAS functions deactivated for the first 10 minutes and activated for the remaining 40 minutes. Throughout the driving task, participants will engage in various activities, including driving-related tasks such as encountering vulnerable road users or executing take-over maneuvers, as well as non-driving tasks such as interacting with the infotainment system or a phone. Like the previous test, a critical event will be introduced, simulating an obstacle in the lane that requires the driver’s response to avoid, replicating a real-world emergency situation. This
maneuver involves the lead vehicle executing a cut-out maneuver 15 meters before the obstacle.
Data Collection During the initial phase of the track experiment, a comprehensive data collection process will be conducted, encompassing objective and subjective metrics. This will involve the integration of VI- grade software into the simulator for the collection of steering and directional data, assessment of time to collision and evaluation of perceived mental workload and trust using TASS and IWS scales.
Additionally, physiological responses such as heart rate variability will be monitored using EEG and respiration sensors from Opensignals to examine their correlation with individuals’ perceptions. Furthermore, the Eye Tracking System by Eyemotions will be employed to analyze drivers’ focus, situational awareness, eye movements, gaze patterns, frequency of environmental and dashboard scanning, as well as their responsiveness to hazards.
Figure 5: ICPG DIM 250 driving simulator.
CONCLUSION AND NEXT STEPS The methodology described in this article is still under development, but what has been implemented so far has proven effective for evaluating driver engagement and gathering insights directly from individual opinions. An adaptation of this methodology suitable for driving simulator testing is currently being developed for implementation in China in 2024. This will contribute to advancing the study, providing new insights and valuable findings, including potential cultural differences in driving habits and reactions to critical events. Future steps include replicating the test track environment on proving grounds with different vehicle types, expanding the study and methodology to other cultures, and transferring the project to the United States for a comparative analysis across Europe, China and the United States. This will enhance our understanding of driver behavior in an
Assessing Driver Engagement in Assisted Driving Insights From Real Driving Test 2139
increasingly automated vehicle landscape and inform safety measures for the application and implementation of autonomous vehicles.
REFERENCES
Brookhuis, K. A., van Driel, C. J., Hof, T., van Arem, B., & Hoedemaeker, M. (2009).
Driving with a congestion assistant; mental workload and acceptance. Applied Ergonomics, 40(6), 1019–1025. CATARC, China intelligent-connected Car Assessment Programme (version 1.1) (2023). [Online] Available: https://www.safetywissen.com/object/B04/B04.gc w73876 36l5hnmuzse00254fyl8sy63829037054/safetywissen. Euro NCAP, 2030 vision, (2020). [Online] Available: https://cdn.euroncap.com/med
ia/74468/euro-ncap- roadmap-vision-2030.pdf. French, D. J., West, r. J., Elander, j., & wilding, j. M. (1993). Decision-making style, driving style, and self-reported involvement in road traffic accidents. Ergonomics, 36(6), 627–644. Gilotta, S., Deiana, F., (2019). Creative Focus Group as an Instrument to Evaluate
Work Related Stress. In Proceedings of the 20th Congress of the International Ergonomics Association (IEA 2018) Volume II: Safety and Health, Slips, Trips and Falls 20 (pp. 75–84). Springer International Publishing. Jian, J. Y., Bisantz, A. M., & Drury, C. G. (2000). Foundations for an Empirically Determined Scale of Trust in Automated Systems. International Journal of Cognitive Ergonomics, 4(1), 53–71. Lee, J. D., & See, K. A. (2004). Trust in Automation: Designing for Appropriate
Reliance. Human Factors: The Journal of the Human Factors and Ergonomics Society, 46(1), 50–80. Onwuegbuzie, A. J., Dickinson, W. B., Leech, N. L., & Zoran, A. G. (2009). A qualitative framework for collecting and analyzing data in focus group research. International journal of qualitative methods, 8(3), 1–21. Ozbay, K., Yang, H., Bartin, B., & Mudigonda, S. (2008). Derivation and Validation
of New Simulation-Based Surrogate Safety Measure. Transportation Research. Record: Journal of the Transportation Research Board, 2083(1), 105–113. Peters, J., & Mattes, K. (2015). How driver engagement and inattention lead to accidents. Journal of Safety Research, 56, 79–87). Pickup, L., Wilson, J. R., Norris, B. J., Mitchell, L., & Morrisroe, G. (2005). The
Integrated Workload Scale (IWS): a new self-report tool to assess railway signaller workload. Applied Ergonomics, 36(6), 681–693. Roig, Adrià, Deiana F., Jackson J., (2023). Driver Engagement. En 27th International Technical Conference on the Enhanced Safety of Vehicles (ESV) National Highway Traffic Safety Administration. Stanton, N. A., Salmon, P. M., Walker, G. H., Baber, C., & Jenkins, D. P. (2013). A
review of driver engagement and distraction. Ergonomics, 56(9), 1453–1469. Stanton, N. A. (2016). Distributed situation awareness. Theoretical Issues in Ergonomics Science, 17(1), 1–7. Simon Y W Li, Farah Magrabi, Enrico Coiera, (2012). A systematic review of the
psychological literature on interruption and its patient safety implications, Journal of the American Medical Informatics Association, Volume 19, Issue 1, Pages 6–12. Wolfe, J., Horowitz, T. S., Kenner, N., Hyle, M., & Vasan, N. (2005). How fast can you change your mind? The speed of top- down guidance in visual search. Vision Research, 45(16), 2021–2034. Yarritu, Ion, Helena Matute, and Miguel A. Vadillo (2014). “Illusion of control.”
Experimental psychology.
LISTED IN THE AHFE DIGITAL BOOKSTORE CATALOGUE
Explore the complete digital volume
Human Factors in Design, Engineering, and Computing
Read this individual research paper free through the original publisher, or explore the full digital proceedings book.
ISBN 978-1-964867-35-9
Explore this ISBN in the AHFE Bookstore ↗Listed in the July 2026 bookstore catalogue; search by ISBN to confirm current availability · Digital book purchase optional