Vanessa Nasr, Maryam Zahabi (2024). Development of A Single Usability Metric that Accounts for Accessibility (SUMA). In: Human Factors in Design, Engineering, and Computing. AHFE Open Access, vol. 159, pp. 889–896. https://doi.org/10.54941/ahfe1005655
Various technology tools have been designed to aid person(s) with disabilities (PWD). However, no wholistic, standardized method exists that evaluates usability with a focus on accessibility of apps. The objective of this study was to develop a model to assess app usability with a single usability metric that accounts for accessibility (SUMA). The model includes both subjective and objective usability measures to create a comprehensive view of usability and considers accessibility metrics to ensure interfaces are inclusive for PWD. SUMA combines all measures into a singular score, so it is easily interpretable and comparable to other interfaces since previous studies tended to prefer singular score questionnaires. Seven metrics are selected based on their relevance to website and app design as well as inclusivity considerations for PWD including efficiency, effectiveness, satisfaction, accessibility, learnability, flexibility, and memorability. This paper focuses on the development of SUMA and explains the next steps to finalize the model. This includes reducing model dimensionality through a principal component analysis (PCA) of user testing data from an indoor navigation app designed for PWD. Examples of the final model and Excel package are shown based on the pilot data. The results of PCA yielded a model with reduced dimensionality while maintaining a desirable amount of dataset variability.
About 26% of American adults and 15% of the world’s population live with at least one disability (CDC, 2019; WHO, 2021). A disability refers to “any condition of the body or mind (impairment) that makes it more difficult for the person with the condition to do certain activities (activity limitation) and interact with the world around them (participation restrictions)” (CDC, 2024). Disabilities can negatively impact a person’s ability to perform instrumental activities of daily living (IADLs). IADLs include activities that go beyond basic care but are necessary for independent living (e.g., cooking, transportation) (Edemekong et al., 2017; Lincoln & Gladman, 1992). People become dependent on others when they are unable to complete IADLs independently (Edemekong et al., 2017). IADL inabilities result from physical and mental disabilities that negatively impact a person’s ability to complete tasks such as transportation (Edemekong et al., 2017). To
help reduce these challenges, assistive technologies have been developed and implemented to help improve disabled person’s everyday lives (CDC, 2020). However, to ensure these technologies are helpful in aiding PWD, it is important to consider their usability. Additionally, accessibility is an important consideration of usability to ensure design is inclusive for PWD (Waddell et al., 2003). More specifically, website accessibility has been described as designing so that PWD can “equally perceive, understand, navigate, and interact” with technologies (W3C, 2016).
However, these is a lack of comprehensive usability models that consider accessibility measures. Several studies were found that created questionnaire- based usability evaluation methods. Zaharias and Poylymenakou (2009) developed a questionnaire-based usability evaluation that combines human computer interaction and e-learning parameters. This questionnaire is specific to the e-learning field and not directly applicable to other software. Lin et al. (1997) also proposed a questionnaire-based usability method based on human factors principles. The questionnaire, Purdue Usability Testing Questionnaire (PUTQ), supports a straightforward approach for measuring and comparing usability of software but the results are limited to subjective evaluations. Demers et al. (2002) developed the Quebec User Evaluation of Satisfaction with Assistive Technology (QUEST 2.0). This model measures satisfaction for assistive technology through measures such as physical attributes like the weight and dimensions of the product which might not be relevant to other technologies such as mobile phones.
Some previous studies have developed more comprehensive usability frameworks. Blakstad et al. (2010) developed a usability toolbox called USEtool to evaluate building usability. USEtool uses a combination of usability methods and measures including interviews, questionnaires, walkthroughs, and focus groups. The results of this testing is context dependent and cannot be generalized. Maly et al. (2010) created a usability tool for indoor navigation apps for blind and visually impaired users. This tool takes inputs from a task log from the navigation app, direction of user, task times, think aloud, and notes from the observer. From this analysis, usability issues were revealed but there was not a conclusion if the app’s usability was acceptable. Daniels et al. (2007) created a comprehensive usability model for clinical monitoring technology that collected data from measures such as think aloud, self-reporting logs, and questionnaires. While various measures were collected, it was not clear how to combine these measures for a complete picture of clinical monitoring technologies.
Developing a comprehensive model of app and website usability that considers accessibility measures could be applicable to various domains. This paper explores the usability model with indoor navigation apps because various smartphone apps have been developed to aid PWD while navigating indoors (e.g., Ganz et al., 2012). The output of this study presents the Single Usability Metric that Accounts for Accessibility (SUMA) that considers important usability metrics for interfaces to be inclusive. SUMA is a comprehensive usability evaluation approach which includes both subjective and objective measures.
Development of a Single Usability Metric That Accounts for Accessibility (SUMA) 891
DEVELOPING A SINGLE USABILITY METRIC THAT ACCOUNTS FOR ACCESSIBILITY Model Development
Previous studies presented usability methods that only include subjective measures, do not provide easily interpretable results, and/or are industry specific. However, Sauro and Kindlund (2005) developed a model that addressed these limitations of previous studies by creating a single, standardized, and summated usability metric (SUM). SUM combined subjective and objective measures of usability from the American National Standards Institute (ANSI) and the International Organization for Standardization (ISO) and outputs a single usability score. The model’s inputs are diverse and cover important usability metrics: efficiency, effectiveness, and satisfaction. Additionally, the output is easily interpretable as it is a singular score and can be used to compare to other studies’ SUM scores. However, SUM only considered four usability measures related to website design, excluding considerations for accessibility measures. Based on the advantages of this method and to address its limitations by focusing on inclusive design, this study uses the basis of SUM to create a model focused on app usability measures, SUMA. Similar to Sauro and Kindlund (2005), while developing SUMA, principal component analysis (PCA) will be used to reduce data redundancy while increasing dataset variability.
Model Dimensions Model dimensions are selected based on their relevance to apps and website usability testing as well as accessibility considerations. The selected metrics are efficiency, effectiveness, satisfaction, accessibility, learnability, flexibility, and memorability. Each of these usability metrics and their importance are shown in Table 1. Additionally, how each metric will be measured is shown below and made up of a combination of 13 subjective and objective measures to effectively assess usability (Dumas, 2002).
Table 1. Usability model and metrics.
Table available in the original PDF paper.
Usability Metrics Definitions Measures Efficiency How quickly a user can complete tasks once the interface is learned (Nielsen, 2012) Time on task (Sauro & Kindlund, 2005) Effectiveness How accurate and complete users accomplish goals using the interface (ANSI, 2001)
Completion rates and errors (Sauro & Kindlund, 2005) Satisfaction The user’s attitude towards the interface (Bevan et al., 2015)
Questionnaire (Sauro & Kindlund, 2005) Accessibility How the interface meets the needs of users with varying abilities (Bevan et al., 2015)
Questionnaire that measures perceivability, operability, understandability, and robustness (Developed based on Caldwell et al. (2008)) Learnability Degree to which users can accomplish tasks with no experience with the interface (Nielsen, 2012)
Number of steps before mastery, number of hints (Leung et al., 2010; Tahir & Arif, 2015) Flexibility Allows the user to complete the task using a variety of methods (Laubheimer, 2020)
Questionnaire (Tahir & Arif, 2015) Memorability Ease with which a user can remember how to use the interface (Weichbroth, 2020)
Recognition and recall rates (Gatsou et al., 2012)
892 Nasr and Zahabi
FINALIZING MODEL THROUGH DIMENSIONALITY REDUCTION PCA was selected because it is a statistical method used to reduce data dimensionality while retaining a desired amount of the dataset’s variation (Jolliffe, 2002). All model measures can be combined for PCA since they are a combination of continuous, ordinal, and binary data (Sauro & Kindlund, 2005). PCA was selected over other methods such as Factor Analysis because it provides the smallest number of components while Factor Analysis aims to reveal data structure (Jolliffe, 2002). By using PCA, the model will be improved by minimizing random error and removing redundant data (Sauro & Kindlund, 2005).
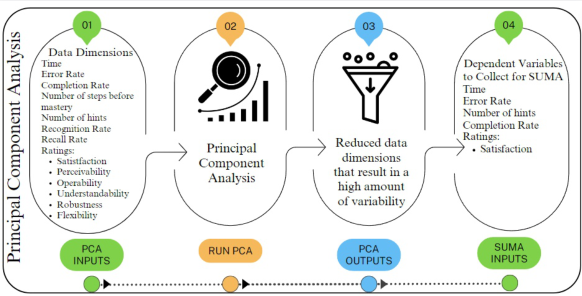
Generally, PCA can be broken down into five steps. First, the raw data must be standardized so numbers on different scales can be compared. Second, each measure is compared to each other to create covariance matrixes. Third, PCA produces eigenvalues and their corresponding eigenvector. Fourth, the principal component(s) (PC) are created and then selected. PC values represent the eigenvectors and their corresponding eigenvalues, where the first PC has the highest eigenvalue, and the last one has the lowest. Researchers then decide which PCs to keep based on three criteria: (1) Kaiser’s Rule; (2) Scree Plot Test; and (3) cumulative variance. Fifth, the dimensionality of the data is reduced by looking at the variable weights for all the included PCs. A variable is selected to stay in the final dataset based on how much it contributes to the included PC. Steps 1 through 3 of the PCA process are completed in R-studio. Steps 4 and 5 will be decided by the researcher using the outputs from the code. After this analysis is completed, the updated usability model will have reduced dimensionality and result in a similar output as the example shown in Figure 1.
Figure 1: Example of PCA process and output usability model.
Final SUMA Model Package Once the reduced model dimensions are determined, the model will be coded in an Excel package for future studies to easily calculate SUMA. The Excel package includes a macro written in Visual Basic for Applications (VBA) that
Development of a Single Usability Metric That Accounts for Accessibility (SUMA) 893
will calculate SUMA with the touch of a button. Before running the macro, the researcher will input their data and fill out a pairwise comparison to determine the weight of importance of the included dimensions (similar to the procedure used in NASA-Task Load Index (Hart, 2006)). Researchers will fill out this portion to determine the model dimensions that are more important for their final design to achieve. When it is activated, the macro will calculate the standardized average for all variables, account for each variable’s weight, and output a single usability score.
Final SUMA Model Example From Pilot Study This section provides an example of what the final SUMA score may be composed of based on pilot data. Eight participants (age: M= 39.6 yrs.; SD= 24.0 yrs.), four males and four females, were recruited. The pilot test consisted of participants completing 8 different scenarios using an indoor navigation app designed for PWD. All measures shown in Table 1 were collected via researcher notes, video recording, and questionnaires. The PCA results from the pilot data yielded five usability measures that could be collected to account for about 59% of the dataset’s variability, therefore reducing the dataset from 13 dimensions. Next, weights for each dimension were found through a pairwise comparison, as shown in Figure 2. Then, the Excel sheet was populated with the pilot data, information was provided about standardizing the data, and then the button was selected. The macro took all inputs and calculated the SUMA score displayed in Figure 2 using Equation 1.
Figure 2: Example of the finalized model: pairwise selection (left); raw data and final SUMA score (right).
Equation 1: Example of SUMA score calculation Model Validation
The development of the model accounted for usability dimensions from previous studies and included accessibility measures. The included measures embody all usability measures from previous research and accessibility guidelines and therefore satisfies content validity. Additionally, all included measures have been used to investigate usability in previous research therefore, meeting construct validity (Middleton, 2023). Last, criterion
894 Nasr and Zahabi
validity can be investigated in the next step to measure how well SUMA captures usability.
NEXT STEPS To finalize the dimensionality reduced model, 56 PWD will be recruited, and each will complete eight different scenarios which will result in 448 cases of all collected measures. The sample size was estimated to meet the minimum number of data points needed for PCA based on the number of dimensions (Lund Laerd, 2018). Once the final model is determined, the Excel package will be made publicly available online. The final SUMA model will include a comprehensive usability measure that accounts for measures of accessibility to ensure inclusive design.
CONCLUSION
SUMA is a usability model that aims to collect measures for app usability and accessibility to ensure technologies are inclusive of PWD. This paper explains the need of such a usability model, details the development of the model, and the next steps to finalize it. SUMA is comprised of measures for efficiency, effectiveness, satisfaction, accessibility, learnability, flexibility, and memorability. To reduce redundancy within the model, PCA will be conducted to improve the efficiency of using SUMA. Using the results from PCA will yield a subset of measures that future usability evaluations should collect to calculate their SUMA score. Such analysis will allow studies to compare their usability scores to other interfaces with a more comprehensive view of usability. The next phase of this project will include a published model so other studies can easily test their app and website usability.
ACKNOWLEDGMENT
Funding for this research was provided by the National Science Foundation (NSF) (No. 1951864). Its contents are solely the authors’ responsibility and do not necessarily represent the official views of the NSF.
REFERENCES
ANSI. (2001). Common industry format for usability test reports. Bevan, N., Carter, J., & Harker, S. (2015). ISO 9241–11 revised: What have we learnt about usability since 1998? Human-Computer Interaction: Design and Evaluation: 17th International Conference, HCI International 2015, Los Angeles, CA, USA, August 2-7, 2015, Proceedings, Part I 17. Blakstad, S. H., Olsson, N., Hansen, G. K., & Knudsen, W. (2010). Usability mapping
tool. CIB Publication. Caldwell, B., Cooper, M., Reid, L. G., & Vanderheiden, G. (2008). Web content accessibility guidelines 2.0. W3C Recommendation, 11. CDC. (2019). Disability impacts all of us infographic. Centers for Disease Control
and Prevention. Retrieved June 11, 2022 from https://www.cdc.gov/ncbddd/disab ilityandhealth/infographic-disability-impacts-all.html
Development of a Single Usability Metric That Accounts for Accessibility (SUMA) 895
CDC. (2020). Disability and health - People with disabilities. Centers for Disease Control and Prevention. Retrieved June 11, 2022 from https://www.cdc.gov/ncbd dd/disabilityandhealth/people.html CDC. (2024). Disability & Health Overview. Centers for Disease Control and
Prevention. Retrieved May 16 from https://www.cdc.gov/ncbddd/disabilityandhe alth/disability.html#:~:text=What%20is%20disability%3F,around%20them% 20(participation%20restrictions). Daniels, J., Fels, S., Kushniruk, A., Lim, J., & Ansermino, J. M. (2007). A framework for evaluating usability of clinical monitoring technology. Journal of clinical monitoring and computing, 21, 323–330. Demers, L., Weiss-Lambrou, R., & Ska, B. (2002). The Quebec User Evaluation
of Satisfaction with Assistive Technology (QUEST 2.0): an overview and recent progress. Technology and Disability, 14(3), 101–105. Dumas, J. S. (2002). User-based evaluations. In The human-computer interaction handbook: fundamentals, evolving technologies and emerging applications (pp. 1093–1117). Edemekong, P. F., Bomgaars, D. L., & Levy, S. B. (2017). Activities of daily living
(ADLs). Europe PMC. Ganz, A., Schafer, J., Puleo, E., Wilson, C., & Robertson, M. (2012). Quantitative and qualitative evaluation of PERCEPT indoor navigation system for visually impaired users. 2012 Annual International Conference of the IEEE Engineering in Medicine and Biology Society, Gatsou, C., Politis, A., & Zevgolis, D. (2012). The Importance of Mobile Interface
Icons on User Interaction. Int. J. Comput. Sci. Appl., 9(3), 92–107. Hart, S. G. (2006). NASA-task load index (NASA-TLX); 20 years later. Proceedings of the human factors and ergonomics society annual meeting, Jolliffe, I. T. (2002). Principal component analysis for special types of data. Springer. Laerd. (2018). Principal Components Analysis (PCA) using SPSS Statistics. Laerd
Statistics. https://statistics.laerd.com/spss-tutorials/principal-components-analysi s-pca-using-spss-statistics.php Laubheimer, P. (2020). Flexibility and Efficiency of Use (Usability Heuristic #7).
Nielsen Norman Group. https://www.nngroup.com/articles/flexibility-efficiency- heuristic/ Leung, R., Findlater, L., McGrenere, J., Graf, P., & Yang, J. (2010). Multi-layered interfaces to improve older adults’ initial learnability of mobile applications. ACM Transactions on Accessible Computing (TACCESS), 3(1), 1–30. Lin, H. X., Choong, Y.-Y., & Salvendy, G. (1997). A proposed index of usability:
a method for comparing the relative usability of different software systems. Behaviour & information technology, 16(4-5), 267–277. Lincoln, N. B., & Gladman, J. R. (1992). The extended activities of daily living scale: a further validation. Disability and rehabilitation, 14(1), 41–43. Maly, I., Mikovec, Z., & Vystrcil, J. (2010). Interactive analytical tool for usability
analysis of mobile indoor navigation application. 3rd International Conference on Human System Interaction. Middleton, F. (2023). The 4 Types of Validity in Research | Definitions & Examples.
Scribbr. https://www.scribbr.com/methodology/types-of-validity/ Nielsen, J. (2012). Usability 101: Introduction to usability. Sauro, J., & Kindlund, E. (2005). A method to standardize usability metrics into a single score. Proceedings of the SIGCHI Conference on Human Factors in Computing Systems.
896 Nasr and Zahabi
Tahir, R., & Arif, F. (2015). A measurement model based on usability metrics for mobile learning user interface for children. The International Journal of E-Learning and Educational Technologies in the Digital Media, 1(1), 16–31. W3C. (2016). Accessibility, Usability, and Inclusion. Web Accessibility Initiative
WAI. https://www.w3.org/WAI/fundamentals/accessibility-usability-inclusion/ Waddell, C., Regan, B., Henry, S. L., Burks, M. R., Thatcher, J., Urban, M. D., & Bohman, P. (2003). Constructing accessible web sites. Apress. Weichbroth, P. (2020). Usability of mobile applications: a systematic literature study.
Ieee Access, 8, 55563–55577. WHO. (2021). Disability and health. World Health Organization. Retrieved June 11, 2022 from https://www.who.int/news-room/fact-sheets/detail/disability- and-health Zaharias, P., & Poylymenakou, A. (2009). Developing a usability evaluation method
for e-learning applications: Beyond functional usability. Intl. Journal of Human– Computer Interaction, 25(1), 75–98.
LISTED IN THE AHFE DIGITAL BOOKSTORE CATALOGUE
Explore the complete digital volume
Human Factors in Design, Engineering, and Computing
Read this individual research paper free through the original publisher, or explore the full digital proceedings book.
ISBN 978-1-964867-35-9
Explore this ISBN in the AHFE Bookstore ↗Listed in the July 2026 bookstore catalogue; search by ISBN to confirm current availability · Digital book purchase optional