James Benneyan, Michael Rosenblatt, Basma Bargal, Jasper Su, Aman Bafna, Arya Akre, Korben Wong, Aishwarya Arvind (2025). Development and Usability of Tools to Improve Hospital Resiliency to Capacity Surges. In: Human Factors in Design, Engineering, and Computing. AHFE Open Access, vol. 199, pp. 1699–1709. https://doi.org/10.54941/ahfe1006981
Hospital capacity surges significantly affect nearly all hospitals under both routine and severe conditions ranging from seasonal flu, unpredictable admission spikes, local emergencies, and epidemics such as Covid. The inability to resiliently anticipate and adapt to these events can seriously strain bed, staff, and equipment availability, with significant associated impacts on patient care. We describe ongoing work to iteratively develop and improve usable analytic tools to help hospitals better and more resiliently predict and manage capacity surges. These models accurately project future day-to-day unit-specific room, equipment, and staff demand and shortfalls, self-tuning to any given hospital and surge pattern on a rolling basis, with re-sults displayed in intuitive and actionable manners. A key motivation is that such models, if well-designed for end-users, can help hospitals pre-emptively anticipate, prepare, and adapt appropriately locally, a fundamental concept of resiliency engineering. Participatory design, human factors, and usability analysis thus were used throughout this work to continuously improve the model’s features, interface, accuracy, and utility. Resulting functionality, model logic, and interface improvements are described, including 12%-62% improvements in all usability scores (ease of use, cognitive effort, layout navigation, time to complete, results interpretability) and 61%-95% improvements in accuracy.
The Covid pandemic placed enormous strain on hospital bed capacity, staff, and supplies. More routinely, hospitals face smaller but similar surge challenges on a regular basis - such as due to seasonal flu, staff shortages, local outbreaks, and other events - but lack effective tools to anticipate and manage emerging capacity needs and make critical operational decisions. Consequently, this often results in incident command or crisis management conditions, possibly including makeshift rooming, sub-optimal staffing or personal protection equipment, or rationing of limited resources. Influenza
and respiratory illnesses, for example, often fill ICU beds to their limit, necessitating admission, rooming, and equipment management decisions. Any surge, moreover, can be unpredictable, differ by magnitude and duration, affect different units differently, and continuously change – further exacerbating hospital resiliency to best adapt to manage these dynamics.
While Covid has waned for now, the general problem of strained capacities remains ubiquitous, with broad agreement that future epidemics will occur and better preparedness is needed for managing both routine and extreme surges (Frueh, 2020). Among other needs, better real-time methods are needed to anticipate needs and shortages to allow earlier pre-emptive mitigation. While SEIR-type models are increasingly used, most are at the more macro than granular level needed to help address facility-specific decisions, and not designed for easy use by hospital personnel. To address these gaps, we developed several hospital surge capacity models that predict facility- and unit-specific admissions, adapt to real-time changes in infection trajectories, estimate day-to-day capacity, demand, and shortages (rooms, equipment, staff), and self-tune to any given hospital on a rolling basis.
Hospital Surges and Consequences The impacts of routine through extreme surges, and the importance of appropriate adaptations, can be significant. In the extreme, global and regional epidemics profoundly strain healthcare capacity, with hospitals struggling to adapt to continuously changing conditions and maintain safe operating conditions, often resulting in bed, staff, and supply shortages, makeshift policies, infected staff, and care concerns. While our models are not intended only for such extreme events, they are an important use case. During the early years of Covid, for example, hospitals recurrently experienced dramatic surges in ICU and medical unit patients, under-staffed beds, durable and personal protection equipment (PPE) shortages, increased off-unit rooming and patient transfers (3-fold), and delayed or denied care for other patients (Christopher et al., 2020; Emanuel et al., 2020; Raney et al., 2020). Off-unit patients have poorer outcomes, under-staffing and fatigue increase medication, procedural, and documentation errors, and ventilated patient outcomes are better if cared for by intensive care specialists. An estimated 10–20% of all SARS-CoV-2 infections in 2020 were for healthcare workers, with a ∼3-fold increased risk of positive tests over the general community and 16–24% prevalence in New York and Long Island. Non- outbreak patients, additionally, often had their primary care, elective, or specialty care deferred either to minimize exposure, save capacity, or due to no inpatient or emergency department space available, with some urgent patients (both outbreak and non-outbreak) dying at home or in ambulances (Erol et al., 2020; Porter et al., 2021; Weinstein et al., 2020).
Resiliency Engineering A key objective of our models is to enable hospitals to pre-emptively adapt by modelling future capacity issues, rather than (more typically) react primarily
Development and Usability of Tools to Improve Hospital Resiliency to Capacity Surges 1701
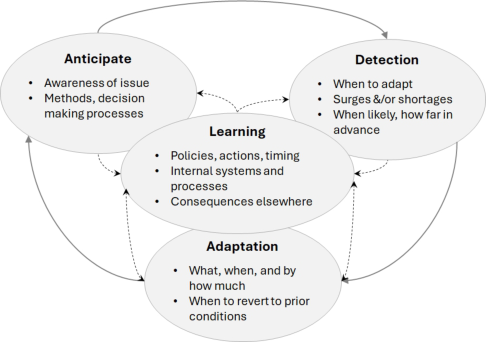
after surges or shortages occur. This type of anticipation and adaptation, in fact, are hallmarks of system resiliency and “safety-2” principles (Fairbanks et al., 2014). A fundamental concept in resiliency engineering is to develop systems that better enable four key abilities for appropriately managing unanticipated or emerging events, namely anticipation, detection, adaptation, and learning, with system failures or consequences partly due to not appropriately adapting in a given situation (Figure 1). Examples include supply chains adapting to delays or disruptions to still deliver needed items on time, air travel adapting to everyday deviations from schedules by adjusting flight speeds or gate times, and emergency departments minimizing hallway boarding by enabling inpatient bed managers to modify discharge processes based on ED status.
Figure 1: Overall resiliency engineering framework, including cultural and operational capabilities to anticipate emerging issues, detect when they occur, appropriately adapt to mitigate their impact, and learn about how to operationalize overall effective resiliency locally.
In our context, models such as described here can help a hospital anticipate, prepare, and adapt in advance of otherwise crisis management conditions, rather than scramble after the fact. Under routine conditions (e.g. winter surge), an illustrative example is a hospital with a 5-bed endoscopy unit that can be converted to temporary ICU space for influenza-A patients, although with the consequence of delayed procedures and with the need to have sufficient time for rescheduling, patient prep, room preparation, and other logistics. An additional important concept in resiliency engineering is that of appropriately adapting – e.g. in appropriate manners, at appropriate times, by appropriate amounts – to minimize consequences both of the emerging situation and impacts elsewhere in the system. For example, anticipating when to convert repurposed space back to its original use is equally important to minimize delayed care and other impacts.
In more extreme contexts such as during Covid, adaptation examples included using lobbies and tents for medical beds, conversion of medical beds and PICUs for adult ICU space, improvised PPE (91% hospitals reported shortages), inpatient care coverage by primary care physicians and retirees, and rationing policies for limited ventilators, dialysis equipment,
and medications. For example, multiple states built field hospitals to accommodate patient surges, New York repurposed 200 school nurses to NYC hospitals, UCLA Medical Center reported >175 infected healthcare workers, and Northwell Health and others developed policies to allocate limited ventilators including sharing pumps between patients (Mostaghami et al., 2020; Priyanka, 2021; Antommaria et al., 2020). In subsequent years, follow-on surges caused similar shortages, overfull ICUs, and rationed care, with many primary care, preventative, and specialty visits as resources were shifted.
In both types of applications, predictive models of the type described here can help address key questions to enable greater resiliency (Table 1). These questions and capabilities, based on user input, informed model development and refinement throughout our work, with the overall objective to provide early signalling of future concerns for a hospital to make such operational day-today decisions as PPE and supply needs, opening ICU space, modifying admission thresholds, allocation of dwindling supplies and medications, invoking makeshift PPE and equipment policies, and so on. Model development towards these aims occurred iteratively over time, starting with a basic minimum prototype with limited functionality, and evolving based on feedback, use experiences, and learnings. Over two dozen alpha and beta model versions were produced, piloted, and distributed (with many more informal iterations in the process), and remains an ongoing process.
Table 1: Envisioned model uses and potential analyses to address hospital needs and resiliency engineering principles.
Table available in the original PDF paper.
Anticipate Detect Adapt Learn When to convert other space to ICU, isolation, or other needed beds How to better prepare or improve policies for future routine or extreme surges How to predict when surge conditions are likely to occur in the future
When will demand for ICU care or equipment (ventilators, dialysis, etc) exceed capacity When will PPE/other supplies get dangerously low
What logistics are needed, who makes decisions, how are these communicated
When to decant, defer, or transfer non-outbreak patients to other facilities
When to invoke makeshift equipment or staffing levels and policies
Do usable tools exist that are easy to use and meet hospital needs
When will staffing needs be unable to be met, how many will be unavailable due to exposure
When to expedite supply replenishments or share resources between facilities
When to enlist primary care providers, retired caregivers, and others
Are needed inputs and data available, or if not how will these be estimated
When to transition policies or space back to original uses or levels
When to modify nurse-to-patient ratios, assigned personnel types, and other staffing policies
What are impacts of changes in hospital admission and bed management criteria Continued
Development and Usability of Tools to Improve Hospital Resiliency to Capacity Surges 1703
Table 1: Continued Anticipate Detect Adapt Learn
Table available in the original PDF paper.
How certain are forecasts, and how wide are their probability intervals
What are appropriate amounts given uncertainties and assumptions
How share resources across hospitals or build resiliency regionally
How fast can hospital make useful responses, how much advance alert of emerging issues is needed
HOSPITAL SURGE CAPACITY MODEL Model Overview
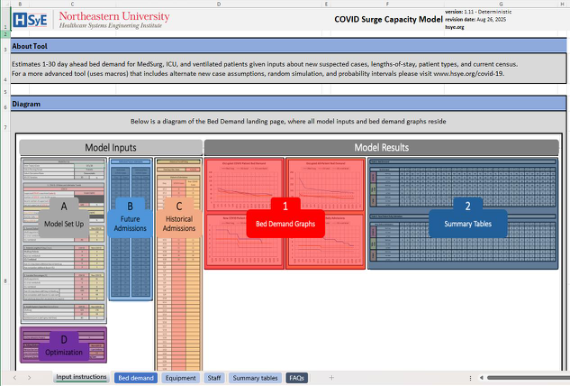
The initial model was implemented with an Excel spreadsheet front-end for familiarity and ease of use, organized into separate worksheet tabs for bed demand, PPE consumption, staffing needs and exposure, accuracy analysis, and input instructions (Figure 2). Calculations are computed in the background or on hidden sheets, with results displayed both tabularly and graphically as run charts over time, formatted for 8.5x11 printing to facilitate daily bed huddles, surge management meetings, and so on. Operationally, the user enters various hospital and population specific information including historical lengths of stay for regular and ICU units, admission rates by unit type and patient type, transfer percentages, ventilator and other equipment use rates, staffing ratios, and exposure rates. Options for estimating admissions for outbreak and regular patients are selected under drop down menus, i.e. doubling rates, local estimates, external epidemic model projections, or curve fitting to historical data.
Figure 2: Illustration of hospital capacity model (excel-based version).
All inputs can be user-specified, based on comparative benchmarks from other tool users, or automatically calibrated by the model (once or on a continual daily basis) to most accurately compute an indicated measure (e.g.,
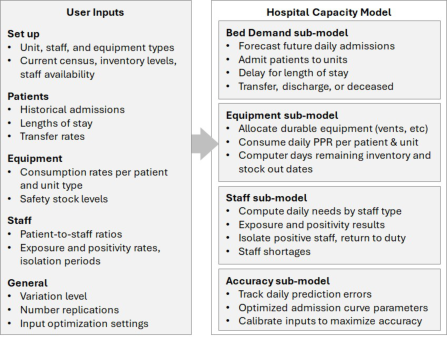
ICU bed demand 4 days ahead, N95 mask stock out dates, staff exposures and unavailability 7 days ahead, etc). The model then computes 1-to-30 day ahead unit, staff, and equipment needs via a combination of mathematical, forecasting, and computer simulation logic, including probability intervals on all results accounting for user-specified randomness in admission volumes, unit placement, lengths of stay, internal transfers, staffing, equipment use per patient, and mortality (Figure 3). Since these can all vary in practice, this functionality can help a hospital visualize the range of possible futures that might occur to develop a sense for the likely range of scenarios they will experience.
Figure 3: Summary of model inputs, logic, sub-models, and calibration.
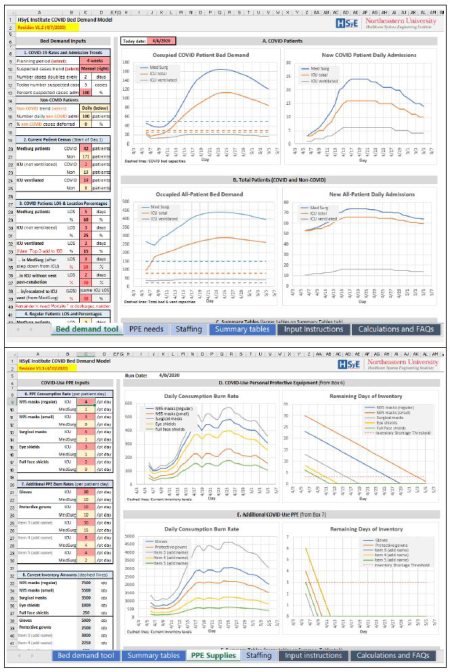
Examples of model output are shown in Figure 4, showing 4-week ahead day-to-day unit-specific bed, staff, and equipment demand, availability, and shortages. Based on user input, two tool versions were developed, one that is entirely macro- free and one that requires macros (coded in Visual Basic) to be enabled, because some organizations may not allow enabling macros, with the latter including more extensive simulation, self- calibration, and admission curve fitting capabilities; the standard macro-free tool however provides most functionality that most users would typically use. Further details on model logic, inputs, and calculations can be found in Benneyan et al. (2020). Additionally, the tool has since been expanded to a more generalized python-based online tool to allow easier access, improved interface design, much faster analysis, and input and results benchmarking with similar hospitals. Current versions of all models are freely available on our website or directly from the authors.
TOOL USABILITY AND UTILITY Participatory design, human factors, and usability analysis methods were used throughout the development process to continuously improve model features, accuracy, interface, and utility. This included a formal usability analysis, including development of a representative standard task, subject
Development and Usability of Tools to Improve Hospital Resiliency to Capacity Surges 1705
observation, cognitive task load assessment (modified from the NASA task load index (TLX) and other instruments), thematic analysis of interviews, and extensive testing under a range of routine through severe surge assumptions. The tools were downloaded by healthcare systems in all 50 states and internationally, providing a rich opportunity for feedback, data, and focus group input. Example improvements over multiple cycles are described below, resulting in 35%–62% increases in key usability scores (ease of use, cognitive effort, time to complete, foraging) and 61%–95% in overall accuracy, with key themes including layout and navigation, instruction wording, results interpretability, visual clarity, and run time difficulties.
Figure 4: Illustration of model results, showing (a) anticipated bed demand by unit and patient type and (b) staffing needs, unavailable/sick staff, and equipment consumption rates and stockout dates.
Usability Analysis During initial tool prototyping, multiple iterations of wireframe layouts, mock-ups, and beta versions were developed and iteratively refined. Four rounds of formal usability studies were conducted, each resulting in numerous improvements. The standard task asked users to open the tool, modify inputs, run specific conditions, record demand for beds, staff, and equipment, determine 95% predictive intervals on results, and optimize
accuracy. Participant tool navigation, actions, and difficulties were observed via conventional “talk throughs” and a post-study questionnaire, also probing for improvement suggestions. Observations focused on ease of use, participant questions, completion times, accuracy, and use or navigation errors. Questionnaire probes were based on a combination of tool usability, task burden, and NASA TLX questions and included ease of use, time pressure, cognitive challenges, understandability, frustration, as well as open-ended questions to elicit other comments and suggestions, resulting in numerous (> 100) usability, wording, layout, and feature recommendations.
All results were reviewed and discussed by the research team, thematically summarized, prioritized, and addressed with tool revisions (Table 2). Examples include more intuitive layouts and navigation, clearer instructions and user guides, simplification of clutter, results interpretation and confusion, clearer wording, location, color and line style coding, more intuitive input prompts and menu structures, expanded new admission options, and automatic saving of results from past runs, resulting in 8%–35% improvements (12%–62% for the online tool) in nearly all usability metrics (Table 3). Further usability work subsequently focused on identified issues that improved the least (e.g., use difficulty, understandability, user errors) versus the most (greatly reduced cognitive, mental, and time demands).
Table 2: Examples of primary usability feedback, themes, and how addressed.
Table available in the original PDF paper.
Issues Identified Representative Comments Improvements Made
Restructured interface for better recognition
Layout Navigation Overwhleming interface, especially for first time users
Standardized terminology and color coding
Instructions Langauge Need for concise explanations
Simplified text in pop-up forms to improve understanding
Simplifed figures with clearer layout
Results Interpretation Dificulty reading results graphs and tables
Reduced clutter and improved color contrasts
Standardized title terms and dimensions
Visual Clarity Chart labels and titles unclear
Enlarged font size Continued
Development and Usability of Tools to Improve Hospital Resiliency to Capacity Surges 1707
Table 2: Continued Issues Identified Representative Comments Improvements Made
Table available in the original PDF paper.
Tool Running Problems Difficulty in adjusting all settings manually
Add features to autocheck necessary settings
Locked sheets to limit user errors
Bug crashes Tool errors when switching between curve fit types
Corrected bugs causing logic crashes when changing curve types
Simulation display errors Inconsistencies with higher number of replications
Corrected issues causing some simulation results to not display correctly
Table 3: Example of usability study results showing significant improvement in most metrics.
Table available in the original PDF paper.
Mental Demand Hurried
Iteration Difficult to Complete
How Long to complete
Understand Results or Rush Pace
Task Accomplished
Frustration or Stress 1: Not, 10: Easy Minutes 1: Not, 10: Fully 1: Low, 10: Very 1: Not, 10: Very 1: Not, 10: Very 1: Low, 10: Very
1 Min 4 20 4 2 2 2 1 Max 8.5 65 8.5 9 6 8 8 Mean 6 46.4 6.6 6.3 4.6 4.9 4.1 2 Min 5 35 5 6 3 6 7 Max 6 35 5 7 3 6 4 Mean 5.5 35 5 6.5 3 6 5.5 Improvement 8.33% 24.56% (-24.24%) (-3.17%) 34.78% 22.45% (-34.15%) p 0.07 0.05 0.39 0.45 0.05 0.12 0.24
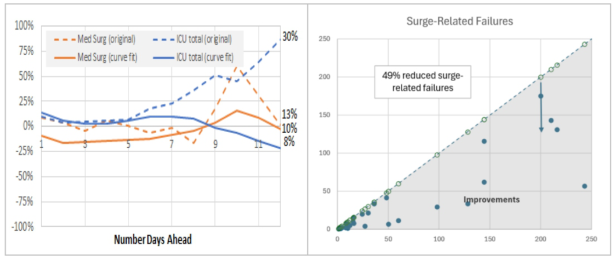
Accuracy and Resiliency Impact We also conducted extensive analysis of improved tool accuracy across data from varied time periods and hospitals (academic, community, rural), as well as preliminary analysis of the impacts on surge resiliency. This resulted in adding an automatic accuracy analysis feature to the tool that can help users learn over time about input assumptions and how far into the future results are reliable enough to act on. Many test and simulation cases, after input calibration, were roughly 90% accurate across the first 14–17 days, then decaying to roughly 70%–80% accuracy for further out weeks (Figure 5a). Health systems also reported 85–95% accuracy in actual practice for bed demand 1-to-5 days into the future, using their best estimates for historical lengths-of-stay, admission units, and other inputs.
More recently, net impacts on hospital resiliency are being estimated via a combination of qualitative hospital feedback, computer simulation of varied surges with and without tool use, and systems science methods such as failure modes and effects analysis (FMEA) and resiliency assessment grid (RAG) analyses (Hollnagel, 2017; DeRosier, 2002), adapted to this context. While still preliminary, results to-date suggest 42%–49% improvements in resiliency RAG scores and reduced failure FMEA scores from appropriately
adapting (Figure 5b). Extensive simulation and RAG analysis results will be reported in later manuscripts and are available from the author.
Figure 5: Examples of improved (a) model accuracy by 61–95% after input calibration and logic revisions and (b) surge resiliency (appropriate adaptations) by 49% from using tool.
SUMMARY Well-designed predictive tools such as described here can help hospitals be more resilient to both routine and extreme capacity surges by enabling basic resiliency engineering principles. Such tools, however, are only useful if they are easy to use, intuitive, and developed with end-users in mind. Use of participatory design, usability, and human factors principles here helped produce accurate user-facing tools that can help hospitals more resiliently anticipate and adapt to emerging surges and associated bed, equipment, and staff capacity issues. Ongoing related work is studying how such models are used in actual practice, the model adoption process, types of resulting actions taken, barriers to use, and user perceptions of utility, accuracy, and model-based decision-making.
ACKNOWLEDGEMENT
This research was supported by the Agency for Healthcare Research and Quality, grant R01HS028458. The authors also thank hospitals that provided feedback and data to help improve tool features, usability, utility, and accuracy.
REFERENCES
Antommaria, A., Gibb, T. S., McGuire, A. L., et al. (2020). “Ventilator triage policies during the COVID-19 pandemic at US hospitals associated with members of the association of bioethics program directors,” Annals of Internal Medicine, 173(3): 188–194. Benneyan, J. C., et al (2020). Hospital Surge Capacity Bed, Equipment, and Staff
Demand Planning Model, Northeastern University, available at www.hsye.org. Christopher, D. J., Isaac, B. T., Rupali, P., Thangakunam, B. (2020). “Healthcare preparedness and healthcare worker protection in COVID-19 pandemic,” Lung India, 37(3): 238–245.
Development and Usability of Tools to Improve Hospital Resiliency to Capacity Surges 1709
Emanuel, E. J., Persad, G., Upshur, R., et al. (2020). “Fair allocation of scarce medical resources in the time of Covid-19,” New England Journal of Medicine, 382(21): 2049–2055. Erol, M. K., Kayıkçıo˘glu, M., Kılıçkap, M., et al. (2020). “Treatment delays and in-
hospital outcomes in acute myocardial infarction during the COVID-19 pandemic: A nationwide study,” Anatolian Journal of Cardiology, 24(5):334. Fairbanks, R. J., Wears, R. L., Woods, D. D., et al. (2014). “Resilience and resilience engineering in health care,” Joint Commission Journal on Quality, 40(8): 376–383. Frueh S. (2020). Preparing for Future Pandemics: Using lessons from the current
crisis to improve future responses. National Academy of Engineering. Hollnagel E. (2017). RAG–the resilience analysis grid. In: Resilience Engineering in Practice. CRC Press, 275–296. Mostaghimi, A., Antonini, M. J., Plana, D., et al. (2020). “Regulatory and safety
considerations in deploying a locally fabricated, reusable face shield in a hospital responding to the COVID-19 pandemic,” Med. 1(1): 139–151. e134. Porter, A., Brown, C. C., Tilford, J. M., et al. (2121). “Association of the COVID-19 pandemic and dying at home due to ischemic heart disease,” Preventive Medicine, 153:106818. Priyanka, D. M. (2021). Field hospitals play vital role as COVID surge continues.
Boston Globe. 01/24/2021. Ranney, M. L., Griffeth, V., Jha, A. K. (2020). “Critical supply shortages - the need for ventilators and personal protective equipment during the Covid-19 Pandemic,” New England Journal of Medicine, 382(18): e41. Weinstein, E., Ragazzoni, L., Burkle, F., Allen, M., Hogan, D., Della Corte, F. (2020).
“Delayed primary and specialty care: The coronavirus disease–2019 pandemic second wave,” Disaster Medicine Public Health Preparedness, 14(3): e19-e21.
LISTED IN THE AHFE DIGITAL BOOKSTORE CATALOGUE
Explore the complete digital volume
Human Factors in Design, Engineering, and Computing
Read this individual research paper free through the original publisher, or explore the full digital proceedings book.
ISBN 978-1-964867-75-5
Explore this ISBN in the AHFE Bookstore ↗Listed in the July 2026 bookstore catalogue; search by ISBN to confirm current availability · Digital book purchase optional