Maya Pablos, Richie Hibbs, Todd Knight, Josh Wozniak, Cameron Wilcox, Lindsey Mcintire, John McIntire, Caleb Jensen, Daniel Jensen (2025). Development and Integration of a Wearable Biometric Sensor Suite for Assessing Physical and Cognitive State. In: Human Factors in Design, Engineering, and Computing. AHFE Open Access, vol. 199, pp. 250–260. https://doi.org/10.54941/ahfe1006837
This work describes how a human-centered design process was implemented for development of a system of wearable technology that can be used to assess a person’s physical and/or cognitive state. The system is comprised of a suite of biological measurement devices. Variables measured include numerous heart rate variables, temperature, respiration, oxygen saturation and numerous brain wave patterns. Some, but not all, of the sensors used in the system are commercial off the shelf (COTS) sensors. Two sensos in particular were developed in house and have distinctive capabilities not found in COTS sensors. The first of these non-COTS sensors is very small and has the capability to deliver oxygen saturation and full waveform heart rate data. The full heart rate data allows the system to track an individual’s heart rate characteristics over time and use that individual’s data to set markers that may be correlated to changes in physical or cognitive state. The second of these non-COTS sensors is a head band that has the capability to measure certain brain wave patterns. The suite of sensors is integrated into a combination of a wearable athletic shirt and the head band. Each sensor has been calibrated and shown to have good accuracy and precision. The system’s different biological variables are displayed via an app that was developed as part of the research. The person wearing the sensor suite can use the app to view different biological data at any point in time and compare that data with their individual averages. Common measures of distribution of the biological data such as maximums, minimums and standard deviation are available and can provide insights into current physical and cognitive state. The sensor suite has been found to be relatively comfortable to wear. Initial tests validate that the sensors react in a predictable manner to external inputs intended to create heightened levels of fear or anxiety. Initial hypotheses have been developed for correlating the variety of data gathered by the system with an individual’s physical and mental well-being. The system can be used in the future to develop data algorithms that are individualized to the particular wearer, taking the different sensor outputs and correlating them with physical and cognitive states to inform users and possibly even recommend health improvement strategies. The work was sponsored and co-lead by the Air Force Research Lab. The work was accomplished as part of a design project embedded in the Westmont College engineering program.
User-centered design processes employ methods that focus on the user’s needs and behaviour with the product under consideration. In this paper, we will describe our development of a wearable biometric sensor system that is used to access personalized physical and cognitive/mental health data. Our development process employed the user-centered design process called Design Innovation (DI) (Wood et al., 2023; Jensen et al., 2025). DI leads
Development and Integration of a Wearable Biometric Sensor Suite 251
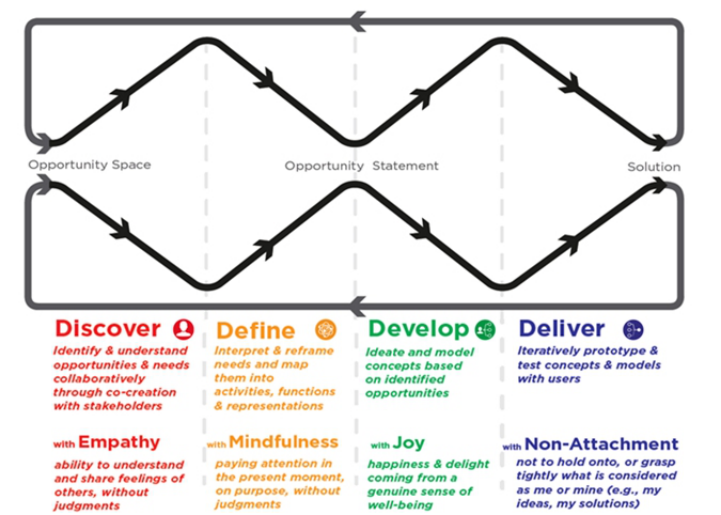
product designers through four major design process steps as is illustrated in Figure 1. The four steps are called the 4 Ds – Discover, Define, Develop and Deliver. Each of the four steps in the DI process employs a variety of different design methods (DM). The DMs are orchestrated tasks that the design team accomplishes to complete that step in the DI process. The first D, Discover, entails engagement with the stakeholders. The focus is on empathy in order for the design team to understand both explicit and implicit needs of the different stakeholders. These needs can be organized using a DM called Affinity Grouping. The second D, Define, uses systems engineering techniques such as functional decomposition and persona development to interpret the information gathered in the Discover phase. This step often ends with the development of the core opportunity statement that drives the design work. The third D, Develop, implements numerous ideation DM including mind mapping and C-Sketch rotational drawing to generate potential ideas for addressing the opportunity statement. The fourth D, Deliver, provides DM for prototyping, analysis and testing strategies as well as creation of other project deliverables such as design pitches and design documentation.
Figure 1: 4D design process (Wood et al., 2023).
Interviews with primary stakeholders, as well as background literature reviews, taught us that there is still much to be learned in terms of the correlation between biometric data, physical state and mental state. Research and interviews with former military personnel revealed that while many servicemen and women experience stress and associated negative mental health trends, they may not choose to discuss such topics openly for fear of repercussions. At the same time, failure to receive help often results in
injuries, lowered performance, failed missions, or poorer mental health. This phenomenon is an issue in the military, and other strenuous jobs, that deserves to be addressed. Our contribution was to assist by designing a device with the ability to monitor physical state and correlate this with cognitive states and mental health.
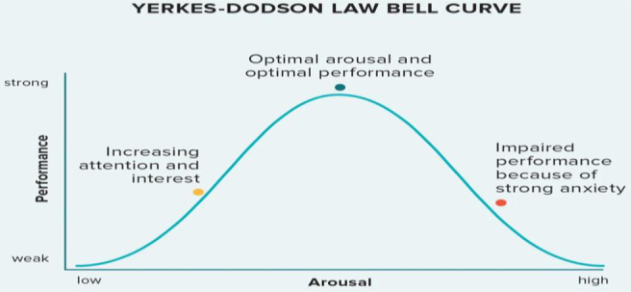
Figure 2: Yerkes-Dodson law bell curve, note peak performance occurs with medium arousal/stress (Corbett, 2015).
The correlation between stress, mental health, and performance is seen in the Yerkes-Dodson Law (Corbett, 2015). This phenomenon is illustrated by a bell curve, where the optimal stress level for optimal performance is at its apex. As an individual strives to perform at maximum capacity, he/she is helped by their stress level up until a certain point. After this point he/she will begin to experience excessive levels of stress, which results in cognitive deficiencies and which lowers performance ability.
FOUNDATIONS FROM OTHER RESEARCHERS A review of the literature shows that others have endeavoured to integrate multiple sensors into an overall system (Mahato et al., 2024; Hozumi et al., 2021; Tang et al., 2025). Some of these systems use novel small flexible sensors designed for wearable use. Some integrate AI to process the data. While these researchers combine the sensors into a wearable system, optimizing sensor placement to ensure the most accurate readings is often compromised with the desire to make the wearable comfortable and small. Other researchers have made progress on personalization of the biometric data (Islam and Washington, 2023). In addition, progress has been made toward understanding the relationship between a variety of biometric data and states of cognitive or mental health (Xu et al., 2024; Kargarandehkordi et al., 2025). Still, there remains open ended questions concerning development and use of a system that has multiple sensors integrated into a wearable. This is especially
Development and Integration of a Wearable Biometric Sensor Suite 253
true when determining where sensors are positioned for optimal data collection and when the data is setup for correlation with cognitive and mental health. Our work is intended to provide progress in these areas.
DESIGN INNOVATION STEP #1: DISCOVER In order to create a product that satisfies the majority of users, we interviewed people who are potential users. In addition, we gathered information from subject matter experts in areas such as: cognitive psychology, kinesiology, wearables, IoT, microelectronics and the military. We call all of these groups our stakeholders. In total, we interviewed more than 30 individuals that specialized in these various fields.
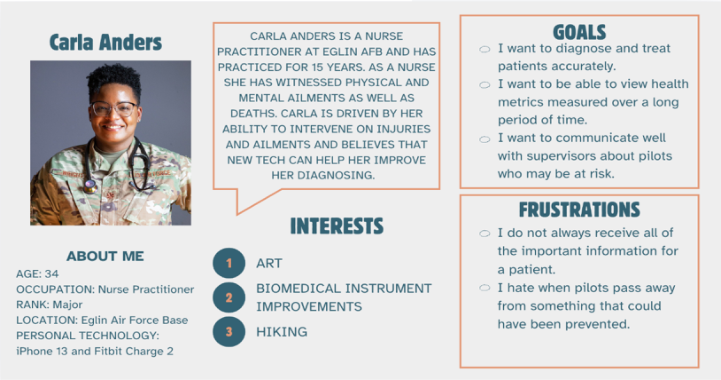
We used the results of our interactions to create four personas. These are fictional characters who represent our main stakeholder groups in terms of their responsibilities, goals, frustrations, and needs. We effectively designed our wearable system for them. An example of a persona is given in Figure 3.
Figure 3: A snapshot of Carla Anders, an Air Force medic persona.
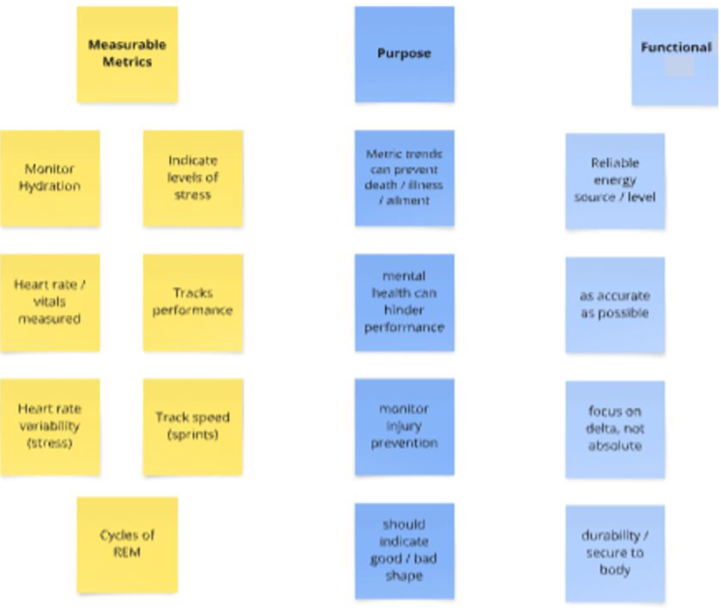
We also organized all of the stakeholders’ information from interviews and background research into an affinity diagram. An affinity diagram is a physical clustering method used to help categorize complex sets of information. Specifically, we listed each relevant piece of information garnered from our stakeholder interaction on individual sticky notes, and then looked for overarching categories into which we could group the stakeholder data. The result–with category names as the single squares at the top of each column–is given in Figure 4.
Figure 4: A partial affinity diagram, with categories in columns.
DESIGN INNOVATION STEP #2: DEFINE The “Define” step of the DI process involves using systems engineering processes to better understand and organize the stakeholder data. Functions represent tangible things which our system must do, while characteristics are desired aspects of the system within the functional category. See Table 1.
Table 1: Example function-characteristic groups for the system.
Table available in the original PDF paper.
Function Characteristic #1 Characteristic #2 Provide vitals Heart rate Respiration rate Utilize data Provides visualization of trends in data
Alerts user when in danger zone Ensures safety Provides non-distracting form of feedback
Notifies to prevent life-threatening events Maintains accuracy Implements precise sensors
Stays reliable during operation These function-characteristic groups enabled us to define essential things our product must do and also to define specific ways in which it must do them. For example, the device must “utilize data” in such a way that shows trends and provides alerts; and the system should “ensure safety” by providing feedback to users in a non-intrusive way, as it notifies them of important data relevant to their health or well-being.
Development and Integration of a Wearable Biometric Sensor Suite 255
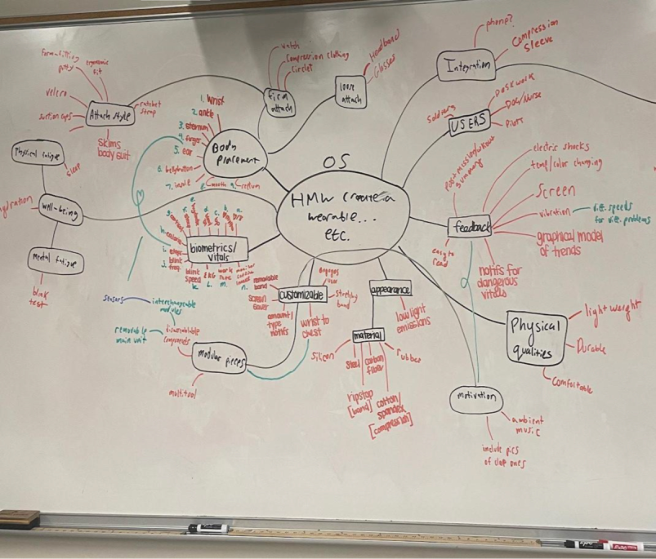
DESIGN INNOVATION STEP #3: DEVELOP During the Develop phase, our team used a variety of DI methods to assist in our ideation development process. One of the most helpful was mind- mapping. A mind map is a shared visuo-spatial tool for rapid ideation where the opportunity statement (core problem statement) is at the center of a large space, and then different solutions to the statement are brainstormed by the team. Mind maps are a way to record, expand, and organize brainstorming sessions that significantly increases the quantity and quality of ideation output. Many studies record a 100% increase in the quantity of ideas generated through mind mapping versus recording ideas as a simple bulleted list (Wood et al., 2023). Categories and subcategories of ideation concepts naturally emerge as the mind map is produced, often leading to additional ideas, productive areas of further exploration, and insights on how disparate ideas might be meaningfully connected, combined or otherwise related. Note that the mind map should have actionable or implementable solutions as the outermost nodes. A variety of unique conceptual categories emerged from this process, as shown below in Figure 5.
Figure 5: Group mind map (note that the opportunity statement is in the middle and various categories & potential ideas branch off of it).
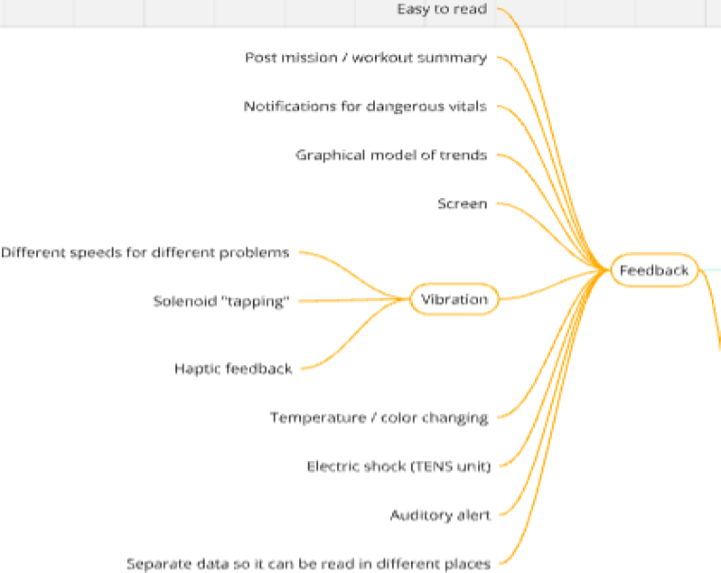
Figure 6 shows a portion of the digitized mind map where solutions are proposed in the category of device feedback. This allowed the team to record, iterate, think about, and explore the many different ways their system might
provide feedback to users. For instance, vibrational feedback might be used, with the realization that different vibrational coding schemes (speed, tapping, etc.) could be utilized to impart more complex information to users than simple on/off alerts. Note that this is only one of many categories in the overall mind map and that each major branch often led to sub-branches and sub-sub-branches that explored different concepts or ideas in more detail.
Figure 6: A branch of our mind map pertaining to possible sources of sensor feedback.
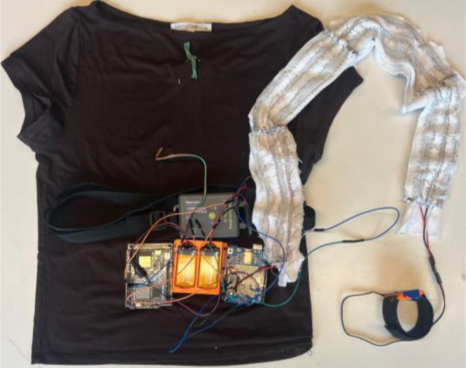
DESIGN INNOVATION STEP #4: DELIVER Within our “Deliver” stage, our team worked to rapidly prototype, analyse, and test the ideas we formulated in our “Develop” stage. Based on initial testing and incorporating stakeholder feedback, we downselected to a system incorporated into an athletic shirt. The shirt provided a way to position the different sensors in optimal locations for accurate measurements and to do so in a single wearable unit. The system measured 4 biometric variables: 1) heart rate (at the top of the sternum), 2) temperature (on left armpit, under shirt), 3) respiration rate (measured in gray box under sternum), and 4) Heart Rate Variability (HRV) (via device on left wrist). The wearable system is shown in Figure 7. Two Arduino boards and a battery box are sewn into the shirt just under the respiration rate sensor. The HRV sensor is connected to one of the boards via strips of conductive fabric (white and gray, left arm).
Development and Integration of a Wearable Biometric Sensor Suite 257
Figure 7: The wearable biometric measurement system prototype.
The Commercial Off The Shelf (COTS) Respiration Belt was purchased from Vernier Science Education (Vernier, 2025). The belt used Bluetooth connections with an Arduino UNO R4 WiFi ABX00087 board. We used an additional Arduino board with wired capabilities which was connected to all the other sensors. This required sending data over a serial communication line between the two boards which connects to the App we developed to analyse and visualize the data.
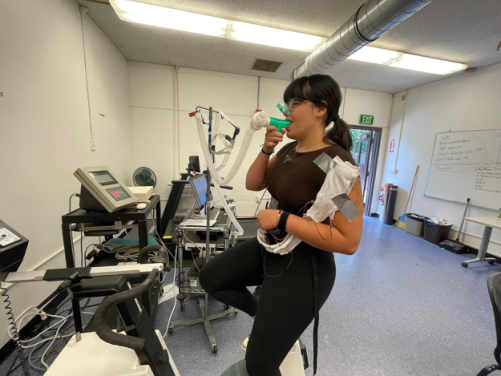
We verified respiration rate data using Westmont College’s biomechanics laboratory equipment [Figure 8]. The user was instructed to ride a stationary bike while breathing through a respiration mask from a metabolic cart system. Simultaneously, respiration changes were recorded by the metabolic cart system and our App. The values given by our device (shown on our App) deviated by a maximum of 2 breaths per minute when compared to the lab’s respiration machine.
Figure 8: Respiration test to verify accuracy of our integrated respiration rate sensor.
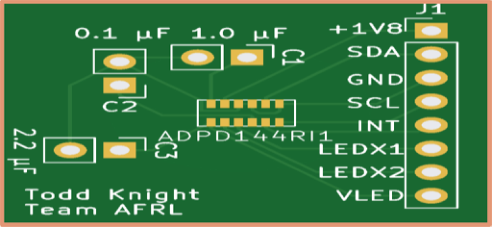
Two of our sensors analysed the heart rate of the user. For this we initially used an Analog Device ADPD144RI which, although capable, is also quite large. Therefore, we designed a very small custom breakout Printer Circuit Board (see Figure 9). This solution is excellent from a size perspective, but it is quite difficult to work with as soldering on a board this small is very difficult. Our final solution was to use a DFRobot SEN0203, which is still larger than we would prefer in a wearable system, but gives both a digital output of heart rate and an analogue output of the raw waveform from which our App can compute HRV.
Figure 9: A top view of the tiny custom breakout PCB.
We implemented two DFRobot sensors in the prototype which are used in two different places: one is affixed to the user’s sternum through the shirt and is used to measure heart rate, and the other is placed on the wrist and measures HRV. The output signal from the HRV sensor is quite noisy, so it is first passed through a low-pass filter with a cutoff frequency of about 10 Hz. A moving average over the last 16 samples is then applied to further smooth the signal. As a result, the signal is cleaned up sufficiently to have the peaks detected by calculating when the slope (derivative) of the waveform changes from positive to negative. The HRV itself is then calculated by taking the root mean square of successive differences (RMSSD) of the RR (between the peaks) time. The RMSSD averages over the current and previous four samples to obtain a value for HRV.
Biometric verification of HR and HRV was accomplished by comparing the prototype’s reading on our App with those given by an Oura Ring (a COTS wearable device) (Ouraring, 2025). We tested the wrist device and the torso device at the same time, and analysed changes in heart rate and heart rate variability (HRV). We tested HR and HRV in both normal user circumstances (resting, walking etc.) and also in a case where the user was intentionally startled. The system registered this “startled” state accurately. In all cases, the output from our system and the Oura ring where within ± 5 bpm.
Temperature measurements were done with a COTS sensor from LilyPad (SparkFun Electronics, 2025). The sensor is located under the arm as this provides the best location for external mimicking of core body temperature. Validation of the LilyPad device was accomplished by comparing its data with a standard hospital temperature measuring system. Accuracy of the LilyPad device was determined to be +/−0.5 F0.
Development and Integration of a Wearable Biometric Sensor Suite 259
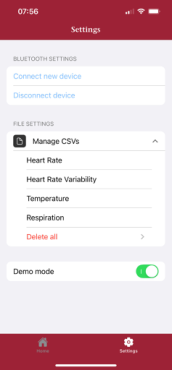
The final piece of our system is our central data collection App (Figure 10) which provides a place to store and analyse all of our biometric data. The App uses React Native for the interface and Expo to compile the App for smartphone use. The App uses Bluetooth Low Energy (BLE) to communicate with our central Arduino (located on the wearable shirt) and collect the biometric data. The data is stored in a CSV file which can be exported for further analysis. The App displays historical biometric data, grouped by days for each sensor. It can also display live streaming of all the data. Finally, the App can notify the user if certain combinations of biometric data indicate that they are experiencing significant stress levels. We implemented push notifications as a starting point and believe that the App’s use for personalized health monitoring is significant.
Figure 10: Project’s the data acquisition app.
CONCLUSION
A system with a set of biometric sensors integrated into a wearable has been developed. The choice of sensors and their placement on the body has been chosen based on research and stakeholder feedback to provide the best combination of comfort and sensor data accuracy. The biometric data measured includes four variables: 1) heart rate, 2) temperature, 3) respiration rate, and 4) Heart Rate Variability (HRV) all of which are integrated into an athletic shirt. The intension of the system is to provide an opportunity to study the correlations between different biometric data and states of cognitive or mental health. To facilitate that purpose, an App was developed that collects all the biometric data and provides opportunities for analysis of the personalized data. Each sensor, as well as the App, has been tested and shown to provide data that is reliable. Initial testing to show correlation between the biometric markers and cognitive state has been very positive. We believe that the system can be used to further explore these correlations.
ACKNOWLEDGMENT
The authors would like to acknowledge the sponsorship of the Air Force Research Lab in this work. This work was accomplished in the context of a Senior Capstone Engineering Design project at Westmont College. The design team from Westmont worked collaboratively with a design team from the University of Colorado at Denver that developed a brainwave scanning device to augment the other biometric data.
REFERENCES
https://ouraring.com/ - accessed 19 Aug, 2025. Gravity: PPG Heart Rate Monitor Sensor for Arduino (Analog/Digital) - DFRobot – accessed 19 Aug, 2025. LilyPad Temperature Sensor - SparkFun Electronics – accessed 19 Aug 2025. Go Direct® Respiration Belt - Vernier – accessed 19 Aug 2025. Corbett, Martin (2015–08-10). “From law to folklore: work stress and the Yerkes-
Dodson Law”. Journal of Managerial Psychology.30 (6): 741–752. doi: 10.1108/ jmp-03–2013-0085. ISSN 0268–3946. Hozumi, S., Honda, S., Aerie, T., Akita, S., Takei, K. (2021). Multimodal Wearable Sensor Sheet for Health-Related Chemical and Physical Monitoring. ACS Sensors, 6(5), pp. 1918–1924. Islam, T., Washington, P. (2023). Personalization of Stress Mobile Sensing using Self-
Supervised Learning. arXiv. https://arxiv.org/abs/2308.02731, accessed 23 Aug 2025. Jensen, D., Reich, G., Shen, N., Vanderhyde, L., Knight, T., Rogers, M., Rapola, M., Artificial Intelligence & Engineering Design: How AI Impacts a Suite of Design Innovation Methods, Proceedings of the American Society for Engineering Education Annual Conference, Montreal, CA, June, 2025. Kargarandehkordi, A., Li, S., Lin, K., Philips, K., Benzo, R., Washington, P.
(2025). Fusing Wearable Biosensors with Artificial Intelligence for Mental Health Monitoring: A Systematic Review. Biosensors, 15(4), p. 202. Mahato, K., Saha, T., Ding, S., Sandhu, S., Chang, A., Wang, J. (2024). Hybrid multimodal wearable sensors for comprehensive health monitoring. Nature Electronics, 7, pp. 735–750. Tang, J., He, Z., Zhang, M., Geng, W., Zhou, C., Shi, W., Shi, Y., Wang, Y. (2025).
T-Ring: A Smart Ring Platform for Multimodal Physiological and Behavioral Sensing. arXiv. https://arxiv.org/abs/2508.00778, accessed 23 Aug 2025. Wood, K., Lauff, C., Hui, W. Y., See, A., Raviselvam, S., Collopy, A., Jensen, D., Tweeo, K., Png, S., Swee, A., Design Innovation Methodology Handbook – Embedding Design in Organisations, Second Edition, Published by the Design Innovation Team, DesignZ Centre, Singapore University of Technology and Design, ISBN 78–981-18–7593-9, doi: https://doi.org/10.59977/VQPH8086, 2023. Xu, G., Qin, R., Zheng, Z., Shi, Y. (2024). An Adaptive System for Wearable Devices
to Detect Stress Using Physiological Signals. arXiv. https://arxiv.org/abs/2407. 15252, accessed 23 Aug 2025.
LISTED IN THE AHFE DIGITAL BOOKSTORE CATALOGUE
Explore the complete digital volume
Human Factors in Design, Engineering, and Computing
Read this individual research paper free through the original publisher, or explore the full digital proceedings book.
ISBN 978-1-964867-75-5
Explore this ISBN in the AHFE Bookstore ↗Listed in the July 2026 bookstore catalogue; search by ISBN to confirm current availability · Digital book purchase optional