Christopher Burns, Sarah Fletcher, Apostolis Papavasileiou, Themis Anastasiou, George Michalos, Sotiris Makris (2025). Exploring Usability And User-experience Metrics With A Novel AR App In The MASTERLY Project. In: Human Factors in Design, Engineering, and Computing. AHFE Open Access, vol. 199, pp. 63–72. https://doi.org/10.54941/ahfe1006818
1 Cranfield University, College Rd, Wharley End, Bedford, MK43 0AL, United Kingdom ↗
2 Laboratory for Manufacturing Systems & Automation (LMS), Department of Mechanical Engineering and Aeronautics, University Campus Rio, Patras 26504, Greece ↗
The present study describes an initial user-experience (UX) evaluation of prototype augmented reality (AR) interface which interacts with a novel industrial human-robot collaborative system. Seventeen participants with varying levels of experience with AR systems at the University of Patras development site were guided through the system’s functions before completing a short manual assembly task directed by the AR system. Participants evaluated their experience via a questionnaire comprising standardised psychometrics (NASA TLX, UEQ, mCSE, SUS, and the Ten-Item Personality inventory or TiPi), while additional questions permitted free responses regarding trust in the system, utility, and user preferences. Two final items investigated aesthetic and functional aspects of the visual interface, and the overall ease of first-time usage. Using correlation, we examined expected consistencies across different UX metrics and a short-form personality inventory. Initial findings from the survey are reported on the overall state of the UX, and modifications to the survey for future use in the MASTERLY project’s other use-cases. Participants reported widely positive interactions, and their responses also provided suggestions well improvements to the final questionnaire for subsequent testing.
User experiences, software and hardware usability and their associated testing methods have become increasingly vital in modern product development in all forms (Sagar & Saha 2017) and have become defined in evolving IEEE standards (e.g. IEEE std. 610.12-1990). These varied measures serve as tools and techniques for the evaluation of the quality and usability of user interfaces, software and hardware, and has eventually resulted in the broader field of user experience, or UX – a relatively newer extension of the field of psychometrics (Lewis 2015). User experience has become a key feature of work in almost all systems where humans interact with technology and especially products, where enhanced usability can increase product revenues by 10-35% (Bertoa, Troya and Vallecillo 2005). The human
factors component of the MASTERLY project has concentrated on evaluating user acceptance and operator experience with these technologies. In January 2025, an initial study employed a mixed-method questionnaire combining quantitative and qualitative measures to assess user experience with an early prototype of the industrial assembly system. This evaluation will also serve as a template for assessing the remaining use cases. An additional research interest was the inclusion of a short personality assessment, focusing on Openness to Experience (e.g. McCrae & Sutin, 2009), to explore potential correlations with usability scores and attitudes toward novel technologies.
The MASTERLY project covers three industrial use cases: aeronautics, logistics, and assembly. This study focuses on assembly, where operators build electronic panels with numerous components. The solution combines a mobile robot (AGV) with a robotic arm and custom gripper, managed by back-end software. Humans and robots collaborate to place parts and retrieve extras as needed. An AR headset provides visual overlays for component selection and placement, offering two modes: detailed training for novices and simplified guidance for experienced users. This flexibility supports frequent design changes. Assembly typically takes over an hour, starting with a pre-selected kit but often requiring additional items. MASTERLY aims to reduce effort, improve accuracy, and enhance adaptability.At the current stage of development, only the virtual reality (VR) interface representing the operator’s interaction with the assembly process has been implemented. This simulated environment allows early evaluation of system usability before full hardware integration. The VR prototype replicates the planned workspace, enabling participants to experience task flow, interface layout, and interaction feedback under controlled conditions.
In January 2025, a pilot study was conducted to evaluate the usability and user experience of this VR interface. A mixed-method questionnaire combined quantitative and qualitative measures to assess perceived ease of use, task clarity, and overall acceptance. To explore individual differences in interaction attitudes, a brief personality measure (the Ten Item Personality Inventory (TIPI) was included) was also included. The aim of the present study is to pilot and validate the procedure for manufacturing operator testing within the MASTERLY project by assessing the usability and user experience of the VR-based prototype interface, which will serve as a methodological foundation for subsequent evaluations of the complete system.
METHODS
This study was conducted as a single mixed-methods session using qualitative and quantitative psychometric survey instruments, with the main aim being to assess the utility of the methods themselves rather than the strict efficacy of the MASTERLY prototypes at this stage. Ethical approval was obtained using Cranfield University’s CURES system under reference CURES/24227/2025.
Participants Participants were volunteers drawn from an engineering class module at the University of Patras including both students and research staff. Complete
Exploring Usability and User-Experience Metrics With a Novel AR App 65
data was available from 17 male participants, comprising nine individuals aged 18-25, six individuals aged 25-30, and two individuals aged 30-35. All participants were fluent in English.
Materials
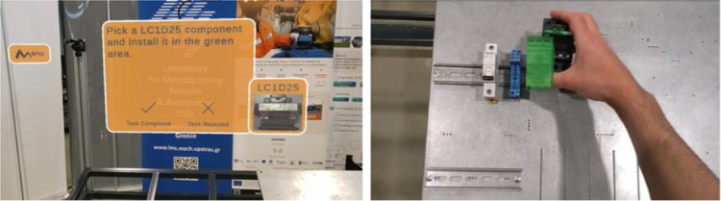
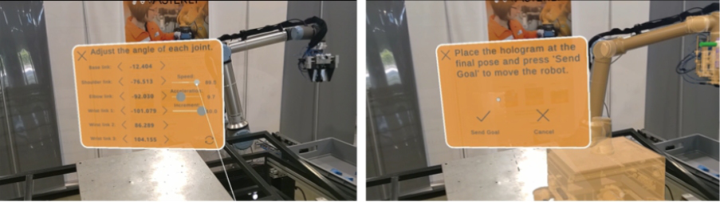
Participants accessed prototype hardware and software from the MASTERLY project, using custom AR software running on a Microsoft Hololens 2 headset to control a robot arm. The wireless headset streams AR visuals from a PC, weighs 566 g, and has a 1440×936 resolution. The AR software operated a custom gripper for handling electronic components. Interaction relied on hand-tracking gestures similar to mobile taps and pinches. Figures 1 and 2 show sample imagery.
Figure 1: Examples of the imagery displayed using the “inexperienced user” mode, where images of each component and its fitting location on the panel are presented to the user. The user manually acknowledges each component in turn before fitting.Figure 2: Two methods of manually programming the arm and gripper, using either specification of individual joint angles to adjust the arm’s position, or by virtually grasping and posing the arm in position.
Participants completed a questionnaire via Qualtrics’ XM online platform (https://www.qualtrics.com) comprising demographic information, the NASA TLX (Hart, Staveland, & Lowell 1988), the UEQ (Laugwitz, Held & Schrepp, 2008), the mCSE Scale (Laver, Ratcliffe, & Crotty, 2012), the SUS (Brooke 1986), and the TiPi personality inventory (Gosling, Rentfrow & Swann, 2003). Additional questions allowed free responses on the participant’s experience of the system’s trust and prospective usefulness. Participants were additionally asked about their level of experience in using
AR or VR technologies; in future samples sizes, this could allow the creation of sub-groups for comparisons. Question items used a Likert-type scale unless free text responses were required.
Procedure Testing took place the University of Patras engineering department. Participants were introduced to the system by members of the development team. The interaction with the system comprised:
Participants calibrated the headset using a QR code, then familiarized themselves with the Hololens’ own wrist-mounted menu. They assembled components on the backplate in two modes: inexperienced user, which displayed images and AR overlays for precise placement, and experienced user, which provided brief text prompts. Finally, they manipulated the robot arm both manually and virtually, adjusting joint angles to guide positioning (Figure 3). As the system was not yet complete at the time of testing, some stages were manually activated in turn by the development team whilst the participant viewed the interactive prompts from inside the Hololens headset. Each session required approximately 20 minutes of interaction time, after which each participant was given a QR code to the questionnaire to evaluate their experience. A Cranfield researcher was in attendance to answer any questions regarding the content or consent aspects of the questionnaire. Cranfield University’s adherence to GDPR and ethical principles were explained to participants before they began the questionnaire. Participants had the option to view the questionnaire in Greek or English, and typically chose English. Participants were free to ask any questions about their participation or the methods at the end of the session.
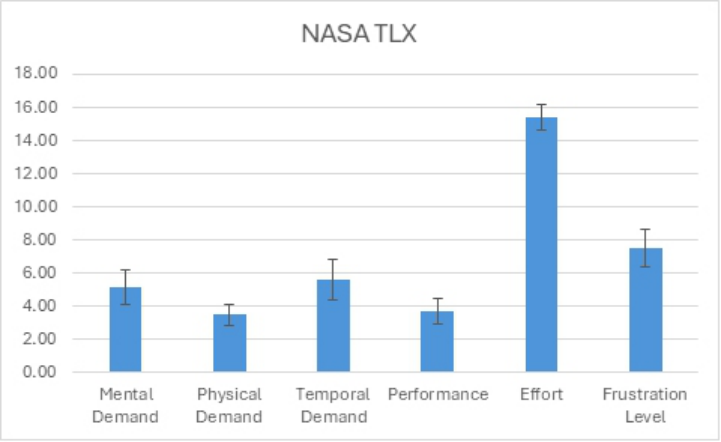
Figure 3: Mean ratings for NASA TLX factors (+./- SEM).
Exploring Usability and User-Experience Metrics With a Novel AR App 67
RESULTS
Numerical and statistical data were analysed using Microsoft Excel and SPSS Statistics (v29.0.1.0(171)). Primary themes were identidfied from the qualitative responses via Microsoft’s CoPilot generative AI (Microsoft, ht tps://m365.cloud.microsoft/chat) and checked for accuracy by the primary author.
NASA TLX User ratings for the AR interactions across the TLX’s six dimensions were broadly favourable, with mean ranks for all factors except Personal Satisfaction scoring less than half the maximum rating. As a single instance of ordinal self-report data, Friedman’s Chi and Wilcoxon tests were used for analysis. A main effect across all factors was present (χ2 (5) = 38.502, p <.001), with Personal Satisfaction being rated more highly than all other factors. These effects are detailed in Table 1, and illustrated graphically in Figure 3.
Table 1: Post-hoc comparisons for NASA TLX, Bonferroni corrected for multiple comparisons.
Table available in the original PDF paper.
Factor Comparison Significance
Wilcoxon Z
0.001
–3.577 Personal Satis. vs. Mental Demand
0.001
–3.625 Personal Satis. vs. Physical Demand
0.001
–3.436 Personal Satis. vs. Temporal Demand –3.626 Personal Satis. vs. Effort 0.001 –3.260 Personal Satis. vs. Frustration 0.001
System Usability Scores Scores for SUS usability ratings were similarly high, with a median score of 80, and the 75th percentile at 87.5. Although SUS scores can possess relatively little inherent context, higher scores reflect better usability ratings, and Bangor, Kortum and Miller (2008) describe median SUS scores above 70 as “acceptable”, while Damyanov et al. (2024) describe such scores as “A-grade” or “Good”.
Modified Computer Self-Efficacy Scores (mcSES) Participants were generally confident of their abilities in broad use of modern technology, with a mean mCSES score of 8.57 and low dispersal of scores around the mean (SD = 1.42).
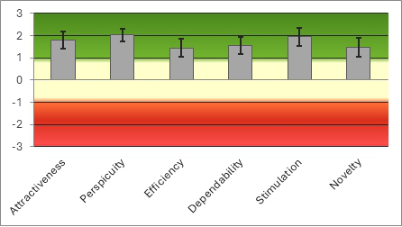
User Experience Questionnaire Scores The UEQ’s automated scoring recommended the removal of two participants due to low internal consistency in their scores. After removal, mean UEQ
scores remained within the acceptable/favourable range (highlighted by the green band in Figure 4), with scores for Perspicuity (i.e. general ease of use, and ease of learning how to use the system) showing the highest ratings (See Table 2 and Figure 4).
Figure 4: Visual descriptives from the UEQ automated scoring.
Correlations Among Measures and Ratings with TiPi Scores Correlations among the state measures and Openness scores from the TiPi inventory produced only a single significant correlation with NASA TLX scores for Temporal Demand (r = −.536, p <.027) from the entire group of N = 17. It was hoped that scores across the domains of the other psychometrics described thus far would show significant correlations with openness to experience scores from the Ten Item Personality Inventory (i.e. as participants were experiencing novel interactions with similarly novel hardware and software), but the single correlation presented with the NASA TLX is conceptually difficult to explain and potentially spurious.
Qualitative Responses Participants’ responses to the four qualitative questions analysed thematically using Microsoft’s CoPilot AI, and were manually checked for accuracy and consistency by reference to the original quotations.
User Feedback Themes for Trust Participants generally trusted the system, giving positive feedback and citing transparency and predictable outcomes despite some minor prototype
Exploring Usability and User-Experience Metrics With a Novel AR App 69
glitches (e.g., calibration issues causing visual elements to appear off-screen). Trust was reinforced by direct feedback and clear robot visibility: “I trusted it because I had direct feedback… I had a clear view of the physical world.” Usability and intuitive design were praised: “Very responsive and easy to use” and “The software was very well integrated…”. Instructional clarity was another theme, with users valuing step-by-step guidance: “Instructions were clear and not complicated” and “The system sufficiently guided me…”. Reliability was also noted: “Because it works correctly” and “The system was responsive to my inputs.”
User Feedback Themes for Perceived Usefulness Participants felt the system mainly benefits less-experienced users by visually guiding tasks, making it a strong training tool. It was seen as “useful in manufacturing systems; helps learn new tasks; relevant to robotics research.” Clear instructions and visual cues reduced errors and effort: “Clear instructions for newcomers; reduces errors; easier for inexperienced workers.” Users praised the interface and guidance: “Easy access to controls; clear visualization; responsive AR interface.” Training potential was emphasized: “Excellent for training; helps understand processes; useful for learning new tasks.” Some suggested improvements: “Needs further improvements; could make tasks easier with enhancements.”
User Feedback Themes for “Least Liked” Aspects of UI Participants identified several flaws and suggested improvements. Many comments focused on UI adjustments, such as moving buttons to offset gesture-tracking inaccuracies. Users noted AR systems are uncomfortable for long wear due to physical strain and bulky headsets: “It is required to bend slightly to track the part that I had grasped for the assembly” and “Wearing the device for long periods of time can become uncomfortable.” Others mentioned ergonomics: “AR applications in general can be ’non ergonomic’ if used for a very long period of time” and “Sometimes I had to position my head/POV in a specific way for the system to work.”. UI issues included sliders and button placement: “The slider use to control the robot arm,” “The system’s close button for the end effector,” and “Maybe some buttons I wanted to be closer.” Visual concerns involved “The brightness of the panels” and “Difficult interaction with small UI elements such as the sliders.” Gesture recognition and camera tracking were also criticized: “The recognition of the camera when I clicked in the application,” and “The control and tracking of my hands could be better.”. Positive feedback highlighted error prevention: “I liked that it warned me when I picked the wrong component” and “The system can guide the tasks required by the job and inform me when I forgot something.”.
User Feedback Themes for “Most Liked” Aspects of the UI Participants valued the interface’s flexibility and real-world visualization of component placement, noting it was especially helpful for less-experienced operators. Users praised its intuitive design and customization: “Highly
intuitive and customizable to where I want things to be in my field of view” and “Large and easy-to-read interfaces and UI elements. Simplicity and intuitiveness.” Visual guidance was highlighted: “The visual assistance on where I should put the component” and “The visualization of how to perform the next assembly tasks.” Manual robot control was appreciated: “That I felt I could accurately control the robot with just my hand movements.” Innovative features and graphics earned positive remarks: “The innovation and the increased graphics. Also I appreciated the action-response on app” and “The clear instruction and user interface, the innovative AR graphics and seamless integration with the robot.” Finally, support for novices stood out: “It was very helpful for an inexperienced operator” and “Clear instructions, intuitive visuals and guidelines.”
DISCUSSION
The pilot evaluation of the MASTERLY VR interface showed positive user experiences, confirming the feasibility of planned usability and UX testing for manufacturing operators. Quantitative results indicated high usability, low perceived workload, and strong user confidence. NASA-TLX ratings suggested modest mental and physical demands but high Effort scores. SUS scores exceeded accepted usability benchmarks (Bangor et al., 2008; Damyanov et al., 2024), and UEQ ratings described the interface as attractive, clear, and stimulating. Overall, findings suggest the prototype VR environment supported intuitive, engaging interaction.
The eventual use of the questionnaire in the present study will be to assess the user experience of industrial operators (with varying levels of experience) of the prototype systems from the MASTERLY project. At the time of writing, the prototype devices from the MASTERLY project have expanded in functionality and will provide a more “complete” user experience during formal testing. In this regard, the questionnaire appears to perform adequately, with some additional insights provided by user comments. The various metrics did not correlate with each other in meaningful ways, but nonetheless stand as useful individual measures of workload, self-efficacy, usability and acceptance. This questionnaire also complements additional work not detailed here which as included directed and mediated discussions, where operators have described more fully, and informally, descriptions of features or difficulties they face in the existing working environment and procedures they use.
In particular, giving participants the opportunity to express qualitative opinions gave insights into improving the questionnaire as whole. The first modification was the removal of the TiPi inventory. The complete questionnaire features assorted measures of broad usability, and, as it will be used to evaluate novel devices and systems, it was hypothesised that the inclusion of a short personality inventory (the TiPi), with focus on the “openness to experiences” factor could provide additional insight into the operators who ultimately use these devices as well as the functionality of the prototypes; Huang et al. (2017) noted that extraversion and introversion played a role in the UX design, with extraverts tending to prefer greater levels
Exploring Usability and User-Experience Metrics With a Novel AR App 71
of interactivity and visual stimulation. Similarly, it would not be unreasonable to expect individuals with higher measured “openness” to be more engaged in the use of novel systems.
In the present study, this was not the case, with the only statistically significant finding being an inverse correlation between openness and Temporal Demand as measured by the NASA TLX,rather than e.g. additional significant positive associations between openness and the SUS or mCSES scales.
It is anticipated that the UI will develop over time with minor changes arising from bug-fixing,but remain essentially similar to its current state. Responses from participants did not highlight any problems with clarity of the visual imagery employed, but the existing scale has been modified to include additional evaluations in light of participants’ other comments. The Corlett and Bishop (1976) physical discomfort scale has been added to assess any physical effects from using the AR headset for prolonged periods, incorporating a pre-and post-UX evaluation, given complaints about long- term use of the Hololens headset. At the request of the developers, a simple question was included to ask users to rate the initial experience of the ease of “getting started” with the system (using a Likert-type scale), and specifically, the extent to which it is obvious what the user should do to begin using the system. Lastly, a formal measure of trust in robotic systems has been added via the Charalambous, Fletcher and Webb (2016) scale for human-robot collaboration to supplement the qualitative responses regarding participant trust. In particular, as the grippers in the panel assembly use-case are novel, the Charalambous et al. scale features specific and standardised questions regarding operators’ impressions of the grippers’ effectiveness and reliability. It is anticipated that actual testing of the three use-cases will begin early in 2026 using this methodology, so some time remains to further refine these methods to e.g. incorporate additional specific feedback or concerns from the system developers themselves. In summary, the pilot study achieved its primary goal of validating the procedure for operator usability testing within the MASTERLY project. The VR interface was positively received, and the evaluation protocol proved both practical and sensitive to user perceptions. Insights from this preliminary work have informed refinements to the questionnaire and provided direction for future interface development. As the technology evolves toward full-system implementation, these methodological foundations will support comprehensive assessments of usability, trust, workload, and ergonomic impact in collaborative human- robot environments.
ACKNOWLEDGMENT
The MASTERLY project is a European Union-funded project (agreement no. 101091800) under the HORIZON Europe Twin-Transition call. (https://ma sterly-project.eu/).
REFERENCES
Bangor, A., Kortum, P. T., & Miller, J. T. (2008). An Empirical Evaluation of the System Usability Scale. International Journal of Human–Computer Interaction, 24(6), 574–594. https://doi.org/10.1080/10447310802205776. Bertoa MF, Troya JM, Vallecillo A (2005) Measuring the usability of software
components. J Syst Softw 79:427–439 (S48). Brooke, John (1996). “SUS: a “quick and dirty” usability scale”. In P. W. Jordan; B. Thomas; B. A. Weerdmeester; A. L. McClelland (eds.). Usability Evaluation in Industry. London: Taylor and Francis.). Charalambous, G., Fletcher, S. & Webb, P. The Development of a Scale to Evaluate
Trust in Industrial Human-robot Collaboration. Int J of Soc Robotics 8, 193–209 (2016). https://doi.org/10.1007/s12369–015-0333–8. Corlett EN, Bishop RP. A technique for assessing postural discomfort. Ergonomics.
1976 Mar;19(2): 175–82. doi: 10.1080/00140137608931530. PMID: 1278144. Dovetail Editorial Team and Damyanov, M. (2024, August 22). How to use and implement the system usability scale. https://dovetail.com/ux/how-to-use-the-system-usability-scale/#: ∼: text=of%20any%20business?-, What%20is%20a%20good%20SUS%20score?, conclusions%20about%20your%20product%27s%20usability. Giorgos Papadopoulos, Dimosthenis Dimosthenopoulos, Fotios Panagiotis Basamakis, George Michalos, Dionisis Andronas, Sotiris Makris. On intelligent object sorting and assembly: versatile end-effector for robotized handling of electrical components, Procedia CIRP, Volume 128, 2024, Pages 363–368, ISSN 2212–8271, https://doi.org/10.1016/j.procir.2024.07.051. Gosling, S. D., Rentfrow, P. J., & Swann, W. B., Jr. (2003). A Very Brief Measure of the Big Five Personality Domains. Journal of Research in Personality, 37, 504–528. Hart, Sandra G.; Staveland, & Lowell E. (1988). “Development of NASA-TLX (Task
Load Index): Results of Empirical and Theoretical Research” (PDF). In Hancock, Peter A.; Meshkati, Najmedin (eds.). Human Mental Workload. Advances in Psychology. Vol. 52. Amsterdam: North Holland. pp. 139–183.). Huang, Y., Backstrom, L., & Chan, J. (2017). Personality and aesthetic preference in web design: A content analysis approach. In Proceedings of the International Conference on Web Search and Data Mining (pp. 643–652). Laugwitz, B., Held, T., & Schrepp, M. (2008). Construction and Evaluation of a User
Experience Questionnaire. In: Holzinger, A. (eds) HCI and Usability for Education and Work. USAB 2008. Lecture Notes in Computer Science, vol 5298. Springer, Berlin, Heidelberg. https://doi.org/10.1007/978–3-540–89350-9_6). Laver K, George S, Ratcliffe J, & Crotty M. (2012) Measuring technology self efficacy: reliability and construct validity of a modified computer self efficacy scale in a clinical rehabilitation setting. Disability and Rehabilitation. 2012;34(3): 220–7. Lewis, J. R. (2015). Introduction to the Special Issue on Usability and User Experience: Psychometrics. International Journal of Human–Computer Interaction, 31(8), 481–483. https://doi.org/10.1080/03610918.2015.1064643. McCrae, R. R., & Sutin, A. R. (2009). Openness to experience. In M. R. Leary
& R. H. Hoyle (Eds.), Handbook of individual differences in social behavior (pp. 257–273). New York: The Guilford Press. Sagar, K., Saha, A. A systematic review of software usability studies. Int. j. inf. tecnol. (2017). https://doi.org/10.1007/s41870–017-0048–1.
LISTED IN THE AHFE DIGITAL BOOKSTORE CATALOGUE
Explore the complete digital volume
Human Factors in Design, Engineering, and Computing
Read this individual research paper free through the original publisher, or explore the full digital proceedings book.
ISBN 978-1-964867-75-5
Explore this ISBN in the AHFE Bookstore ↗Listed in the July 2026 bookstore catalogue; search by ISBN to confirm current availability · Digital book purchase optional