Marco Pogliano, Manuel Colavincenzo, Stefano Martorana, Giorgio Guglieri, Danilo Demarchi (2025). Predicting Operator Workload from Oculometric Data in High-Demand Environments: A Case Study with MATB-II. In: Human Factors in Design, Engineering, and Computing. AHFE Open Access, vol. 199, pp. 721–731. https://doi.org/10.54941/ahfe1006885
In an increasingly dynamic and fast-paced social context, many professionals are exposed to conditions of cognitive stress that often lead to burnout. Mental workload can be empirically described as the ratio between the available mental resources and the demands imposed by the task. Given this parameter's inherently subjective and non-directly measurable nature, its assessment can be carried out through three main approaches: subjective self-assessment, behavioral analysis, or monitoring of variations in physiological signals. When envisioning the development of a device capable of autonomously estimating an individual's mental workload to support their professional activity, it becomes clear that the self-assessment approach is inapplicable. While behavioral analysis holds interesting potential, it suffers from limitations related to the difficulty of generalizing across heterogeneous scenarios. In contrast, the physiological approach is the most promising, as it allows for monitoring independent of the task. Based on these considerations, the present work aims to develop a system capable of estimating various levels of mental workload using solely ocular signals that can be easily captured through wearable devices such as smart glasses or non-invasive optical devices, like remote cameras.An experimental campaign was conducted with 40 subjects, using the MATB-II (Multi-Attribute Task Battery II) test as the primary task. NASA designed this test to stimulate cognitive workload and multitasking abilities, simultaneously activating various mental processing pathways: visuomotor coordination via tracking, auditory reflex through radio communications, logical reasoning through pump settings, and visual reflex through buttons and control bar management. Due to this multi-level structure, the MATB-II provides complete stimulation of the cognitive spectrum of participants. To explore the full range of mental workload, from minimal to very high levels, a secondary task based on simple arithmetic operations (single-digit addition, subtraction, and multiplication) was integrated into the primary test, with four response options and a maximum execution time. Each experimental session was structured with an initial rest phase to acquire baseline values, followed by five MATB-II trials of increasing difficulty, each interspersed with three minutes of relaxation to restore baseline physiological conditions.From each of the six phases (including the rest phase), a set of features derived from the ocular signal was extracted, which were subsequently used as input for a machine learning training pipeline. The data from each subject were initially corrected against their baseline and then normalized via min-max transformation. The pre-processed data were analyzed to extract the most essential features and then fed into various machine learning classification models. The results show high predictive reliability, outlining promising scenarios for developing automated systems for estimating mental workload. Most tested models can easily separate the baseline and the lower workload state. The distinction between the higher mental workload classes is less evident but still statistically significant.An additional perspective, currently still exploratory, involves analyzing model performance in real-time contexts, using short time windows. This extension would make the system applicable in a wide range of cognitively intensive operational fields, including the automotive, aerospace, and medical sectors, contributing to developing intelligent technologies for continuously monitoring operators' mental states.
Monitoring mental workload (MWL) is a crucial aspect of high-stakes operational environments such as avionics (Yaven et al., 2023), healthcare (Torkami-Azar et al., 2022), and the automotive industry (Wei et al., 2023), where accurate and timely decision-making directly influences safety and operational efficiency. The successful integration of advanced technologies,
particularly those based on artificial intelligence (AI), requires the ability to estimate an operator’s MWL in real time. This enables dynamic adaptation of automation and support systems based on the operator’s cognitive state. MWL assessment typically involves a multimodal approach, based on subjective questionnaires, behavioural analysis, and physiological signals monitoring. Questionnaires, such as the NASA-TLX (National Aeronautics and Space Administration Task Load Index) (Hart et al., 1988), offer insights into an individual’s perception of cognitive effort, while behavioural analysis focuses on objective parameters like errors and reaction times. However, both subjective questionnaires and behavioural measures lack the ability to provide real-time, versatile, and scalable solutions, thus making physiological signal analysis a promising alternative (Luzzani et al., 2024). Among the minimally invasive physiological analysis, ocular signal offers a promising solution for monitoring MWL due to its compatibility with wearable technologies like eye-tracking glasses or front-facing environmental cameras (Wang et al., 2021). Unlike traditional physiological signals, such as electrocardiographic or respiratory signals, ocular signals lack a defined periodic morphology, but they are characterized by distinctive events. Key components include blinking, fixations, saccades, and saccadic intrusions (Skaramagkas et al., 2021). The scientific interest in ocular signals for MWL monitoring lies in their dual nature: physiological and behavioral. They reflect neurophysiological processes in response to stimuli, evident in pupil diameter, blink frequency, and saccadic activity. Additionally, the scanpath, defined as the sequence of eye movements, is closely related to the task performed, providing insights into attention strategies and cognitive dynamics. This dual nature makes ocular signals particularly useful for non-invasive, continuous monitoring in complex and dynamic environments, ensuring safety and operational efficiency. To induce and assess MWL in controlled environments, various experimental paradigms have been developed, including arithmetic tasks (Borys et al., 2017), the N-back task (Dayal et al., 2024), and the Multi-Attribute Task Battery II (MATB-II) (Santiago-Espada et al., 2011), all designed to simulate high- intensity cognitive scenarios.
The goal of this study is to explore the exclusive use of ocular signals for developing a processing and MWL prediction pipeline, based on AI techniques. Most of the works found in the literature adopt a multimodal approach, integrating various physiological signals to achieve accurate estimates of cognitive workload (Gedam et al., 2021; Ialori et al., 2024; Das et al., 2024). However, such approaches often require subject preparation and can involve invasive or logistically burdensome procedures. In contrast, the methodology proposed in this study relies solely on the analysis of ocular signals, acquired through wearable eye-tracker devices in the form of glasses that do not require any specific preparation. An experimental campaign was conducted with 28 participants, using the MATB-II, selected for its ability to induce a broad spectrum of MWL levels in a controlled manner. The ground truth for training the predictive model was obtained through a self-assessment questionnaire administered at the end of each session. This questionnaire, specifically developed for the study, allowed for
Predicting Operator Workload from Oculometric Data in High-Demand Environments 723
the collection of subjective data on the perceived mental workload, providing a personalized and contextual evaluation for each subject and experimental condition.
MATERIALS AND METHODS
In this section, we outline the main methodological aspects of the study, providing a detailed description of the experimental protocol, the data processing procedures applied to the collected signals, and the methods used to construct and manage the resulting dataset.
Test and Protocol The methodological structure underpinning the entire analytical pipeline is based on the type of test used to induce MWL and the approach adopted to collect subjective perceptions, which serve as ground truth for training machine learning models. The computerized MATB-II was selected due to its ability to simultaneously stimulate multiple sensory and cognitive domains, including visual, auditory, memory, reflexive, and processing tasks, making it particularly suitable for eliciting realistic and controlled cognitive workload conditions. The experimental campaign involved a cohort of 28 voluntary participants, recruited with informed consent and ethical approval from the Ethics Committee of Politecnico di Torino (cod: 28686/2024). The protocol included an initial 10-minute acclimatization phase, followed by sensor setup. Eye-tracking data were acquired using Tobii Pro Glasses 3, a wearable device with high portability, 50 Hz sampling rate, and an angular accuracy of 0.6
. Each recording session consisted of a 5-minute baseline period during which participants were asked to remain relaxed, followed by five consecutive MATB-II trials. Each trial featured increasing complexity, defined by the number of events to be managed and the trial duration. Between trials, participants were given a 3-minute rest period during which they were asked to provide a subjective assessment of the MWL perceived in the preceding task. To this end, a custom rating scale was developed based on the Bedford scale, widely used in the aviation domain (Roscoe, 1984), and adapted to the specific characteristics of the MATB-II task. The scale consists of six levels, labelled from A to F, representing increasing levels of MWL. To ensure consistent experimental conditions and reliable evaluation, participants underwent a preliminary training session aimed at standardizing familiarity with the operational logic of the test environment, and the subjective rating system. This phase was essential in minimizing inter- subject variability in MWL perception, acknowledging that such variability remains an intrinsic and inevitable aspect of psychophysiological research.
Signal Analysis The acquired ocular signal underwent a preprocessing pipeline aimed at extracting a set of features from each test phase, enabling their association with the participants’ subjective perception. Specifically, the analysis focused on the gaze trajectories along the horizontal (x) and vertical (y) axes, projected onto the image plane captured by the device’s camera, as well
as the pupil diameter signal. By jointly processing the horizontal and vertical gaze coordinates, it was possible to identify and quantify the main oculomotor events, including blinks, fixations, saccades, and saccadic intrusions. Blinking refers to the involuntary and rapid closure of the eyelids, typically lasting between 100 and 400 milliseconds. Under resting conditions, blink rates average 10–20 events per minute but may increase in response to fatigue, stress, or heightened cognitive demand. Fixations correspond to periods during which the gaze remains relatively stable within a specific region of the visual field, allowing for the processing of visual information. Their typical duration ranges from 200 to 600 milliseconds and is characterized by low ocular velocity (below 30
/s). In cognitively demanding tasks such as reading or problem-solving, fixations tend to become more frequent and prolonged, reflecting increased mental processing. Saccades are rapid ballistic eye movements that shift the gaze from one fixation point to another. These movements are brief (20–200 milliseconds) and can reach velocities exceeding 100
/s. Saccadic intrusions refer to involuntary micro-movements occurring within a fixation period, often reflecting suboptimal visual control or attentional lapses. These events are short in duration (20–100 milliseconds) and limited in spatial amplitude (few degrees), yet they serve as indicators of visual instability and attentional discontinuity. To further characterize the ocular scanpath a frequency- domain analysis of the gaze signal was conducted. Specifically, the spectral power distribution was examined across defined frequency bands to identify dynamic patterns associated with varying levels of cognitive load. The analysis focused on low-frequency components (up to 1 Hz), typically related to slower and more stable gaze behaviour, and high-frequency components (1–3 Hz), which are indicative of increased oculomotor activity and greater fragmentation of visual exploration patterns. To automatically classify ocular events, the algorithm described in (Luzzani et al., 2025) was applied to the bidimensional gaze trajectories. For each of the oculomotor and physiological components described, a set of features was computed; the complete list is shown in Table 1. Simultaneously, the pupil diameter signal was processed independently to evaluate its dynamic changes over time, potentially reflecting sympathetic activation and fluctuations in cognitive load, analyzing mean and standard deviation for both eyes. These features serve as the foundation for subsequent analysis aimed at modeling mental workload using machine learning techniques.
Table 1: Ocular features extracted to evaluate MWL.
Table available in the original PDF paper.
Spectral Blinking Fixations Saccades Saccadic Intrusion Duration Duration Duration Duration HF Frequency Frequency Frequency Frequency LF Interval Velocity X Velocity LF/HF Velocity Y Value
Predicting Operator Workload from Oculometric Data in High-Demand Environments 725
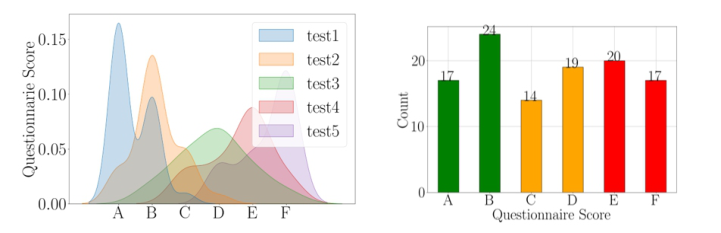
Dataset Description The study involved 28 voluntary participants (22 males and 6 females), with ages ranging from 24 to 43 years (mean age: 29 years). The dataset employed in this study was constructed by extracting a set of ocular features corresponding to each of the six phases defined in the experimental protocol. Each feature array, representing a single phase for a given participant, was labelled with the perceived MWL level assessed using a custom six- point scale ranging from A to F. The initial resting phase was treated as a separate reference class, intended to serve as a cognitively neutral baseline. To enhance the robustness of the analysis and facilitate the application of predictive models, the six workload levels were grouped in pairs, yielding four distinct classes: the first representing the resting state; the second indicating low MWL (ratings A and B); the third corresponding to moderate MWL (ratings C and D); and the fourth reflecting high MWL (ratings E and F). This reorganization aimed to reduce intra-class variability arising from subjective perception and to produce a more balanced and consistent dataset, better suited for training classification models dedicated to the automatic classification of MWL levels. Figure 1 (left) illustrates the distribution of subjective ratings as a function of the programmed difficulty level across the five MATB-II test trials. The density curves reveal a clear trend: perceived workload increases with task complexity, although some inter- subject variability is evident. Specifically, for trials associated with low MWL levels (ratings A and B, shown in blue and orange), the distributions are more concentrated and align closely with the assigned task difficulty. Conversely, for trials corresponding to medium-high workload levels (ratings D and E, shown in green and pink), the curves show broader dispersion. This pattern suggests that participants found it more challenging to accurately assess their mental effort during more cognitively demanding conditions, likely due to difficulty in distinguishing between adjacent levels of mental strain. Figure 1 (right) presents the distribution of subjective workload ratings (A to F), analyzed to evaluate class balance, essential to ensure robust estimation of model performance and to prevent bias during the training phase.
Figure 1: Personal MWL evaluation related to: (left) MATB-II tests; (right) classification classes (rest - low MWL - medium MWL - high MWL).
RESULTS
The dataset was normalized using a min–max transformation applied individually to each subject, following the removal of the baseline phase. The adoption of subject-specific normalization aimed to minimize inter- individual variability, thereby enhancing the robustness and generalizability of the predictive model across different participants. Subsequently, the data were partitioned into training and test sets with an 80/20 ratio. A key constraint was introduced during this phase: each subject contributed exactly six observations, one corresponding to the resting phase and five to the active trials, assigned entirely to either the training or the test set. This subject-wise splitting strategy was adopted to prevent data leakage and to ensure a realistic evaluation of the model’s predictive performance. It allows for testing on previously unseen individuals, thereby strengthening the generalization capability of the trained models. Following data preparation, a training pipeline was implemented, comprising a sequence of feature selection methods and various machine learning (ML) algorithms, selected from among the most established approaches in the literature for comparable applications.
Feature Selection Methods and Classification Algorithms To develop a robust predictive model, various combinations of feature selection methods and classification algorithms were tested, as detailed in Table 2. To optimize performance and minimize the risk of overfitting, hyperparameter tuning was applied to each model using 5-fold stratified cross-validation, which preserves the original distribution of workload classes in each fold. After identifying the best-performing configuration, its generalization ability was assessed on a separate hold-out test set, which had not been used during training or validation. This final evaluation offers an unbiased estimate of the model’s predictive capability on previously unseen subjects.
Table 2: Feature selection techniques and classification algorithms used in the analysis.
L1-based feature importance Nearest Neighbors ADABoost Random Forest based feature importance
Final Evaluation and Results We used the confusion matrix (CM) to visualize a comprehensive picture of model behaviour, providing an intuitive representation of the correct and incorrect predictions for each class. This is especially useful in identifying patterns of misclassification, such as confusion between adjacent workload levels. F1-score, a metric that harmonizes precision and recall, has been
Predicting Operator Workload from Oculometric Data in High-Demand Environments 727
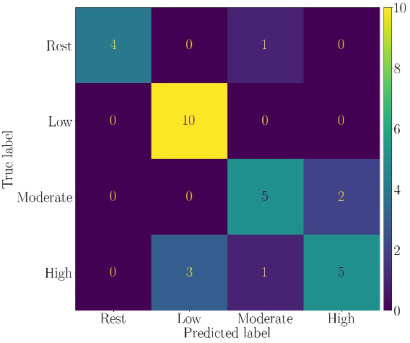
used as a primary quantitative performance indicator, as it is well-suited for multi-class classification tasks where sample distribution across classes may be not uniform. The F1-score, in addition, provides a more nuanced view by accounting for both false positives and false negatives, in respect to accuracy, and it can be computed per class to evaluate how well the model performs individually on each workload level. This is especially important in our context, where we aim to develop a system capable of distinguishing between different levels of cognitive workload with high fidelity. The ocular features selected are the following: Blinking Duration Mean, Blinking Frequency Mean, Blinking Interval Mean, Saccade Frequency Mean, Y-axis Saccade Velocity Mean, Fixation Duration Mean, Fixation Frequency Mean, Saccadic- Intrusion Frequency Mean, High-Frequency Power (HF) on X-axis Gaze, Low-Frequency to High-Frequency Power Ratio (LF/HF) on X-axis Gaze. In Figure 2, we show the CM of the perceived against the predicted MWL for the rest and the three workload levels for the best model.
Figure 2: Best model confusion matrix.
In Table 3, we show the classification report indicating the F1-score, precision, recall and accuracy, for each predicted class and the macro and weighted average performance. The rest condition and low MWL level are reliably classified, with F1-scores of 0.90 and 0.87, respectively. Notably, the precision for the rest class is 1.0, indicating that all instances predicted as rest were correctly classified. In contrast, the precision for low MWL is 0.77, suggesting that the model mistakenly assigns some high workload data points to the low workload class. Despite this, low MWL shows a recall of 1.0, meaning that all true instances were correctly identified by the model. In the medium-to-high MWL range, the model’s performance degrades, obtaining F1-scores of 0.71 and 0.62, respectively, reflecting a significant degree of label confusion in this region. The poorest performance is observed for the high MWL class, where the model frequently misclassified instances as belonging to moderate or even low workload levels.
Several factors may explain these results. The five MATB-II procedures, although designed with varying difficulty levels and supplemented by a secondary task, may not be sufficient to elicit consistently distinct subjective workload states, particularly in the medium-to-high range. The MATB-II framework itself, while effective for inducing general workload conditions, may be limited in its granularity, making it easier to distinguish between low and high workload, but less effective at differentiating within the medium spectrum. Finally, the observed confusion between medium and high workload levels may stem from individual variability and subjectivity in self- assessment, which can lead to inconsistencies in the labelling of adjacent workload levels.
Empirical Online Validation The results described in the previous section focuses on testing the classification model based on the features extracted on the entire duration of each procedure. In this section we want to describe an empirical validation of the model, when it is used in an online application. There is one point that is fundamental to discuss before showing the results of these tests: the model has been trained using the features extracted from the whole signals collected during the procedure. We are now using the features extracted in real-time on a smaller time window, hence the results of the classification could be different from what obtained during the previous validation. The online validation requires the development of a raw data streaming system, with its components communicating via MQTT (Message Queuing Telemetry Transport). To empirically validate the effectiveness of the workload classification model, we designed three specific MATB-II procedures, each combined with a secondary task, proposed on a subset of 5 participants selected from the main study. Following the completion of the tasks, we conducted a structured debriefing session, exploring the subjective experiences and perceived workload levels reported by each participant compared with the real-time workload classifications generated by the model to qualitatively assess the consistency or to identify potential discrepancies or areas for future refinement. The predictive pipeline demonstrated high effectiveness, enabling fast and responsive inference even when operating on short segments of ocular signal. Although objectively validating the alignment between the model’s predictions and the participants’ actual cognitive states remains inherently challenging, the system consistently captures overarching cognitive trends. Notably, segments subjectively identified by participants
Predicting Operator Workload from Oculometric Data in High-Demand Environments 729
as cognitively demanding were systematically classified by the model as high MWL episodes. This outcome suggests that the system is capable of effectively tracking MWL fluctuations, particularly during periods of elevated cognitive demand. However, the model showed reduced precision in estimating the exact duration of a specific cognitive state, an expected limitation of the sliding window approach, which inherently introduces a delay between the onset of a cognitive change and its detection. As new ocular data accumulate over time, the model progressively updates its predictions, resulting in a slight latency in state recognition. These findings should be interpreted as a promising first step toward the integration of real-time MWL monitoring. While the current results are not yet definitive, they validate the feasibility of the proposed pipeline in realistic conditions and clearly highlight key directions for future improvement, particularly regarding the system’s temporal resolution and adaptive responsiveness.
Future Improvements Future developments of this work will focus on enhancing classification performance in both offline and online modes through two main strategic directions. The first involves the integration of additional sensing devices dedicated to monitoring physiological parameters known to be strongly associated with MWL, such as cardiorespiratory activity, electrodermal activity, or functional near infrared spectroscopy. Priority will be given to low-impact, wearable technologies that can be easily adapted to various application domains. This integration aims to increase the robustness and accuracy of the predictive system in real-world scenarios. The second strategy targets the optimization of the data acquisition protocol by increasing the temporal density of subjective workload assessments. More frequent collection of subjective labels would provide a dataset that better reflects the temporal dynamics typical of real-time applications, thereby supporting the training of predictive models that are more closely aligned with expected operational conditions.
CONCLUSION
This study focused on developing a predictive model of MWL based solely on ocular signals, leveraging their ease of acquisition through wearable or even non-contact devices. A data collection campaign was conducted involving 28 voluntary participants, using the MATB-II as a workload inducer and obtaining subjective workload assessments to serve as ground- truth for model training. The analysis pipeline combining a feature selection model with a classifier yielded the best results, achieving an overall F1- score of 0.77 in classifying MWL across four levels (rest, low, moderate, high). One of the main challenges encountered concerned the inherently subjective nature of workload labelling and the difficulty of reliably eliciting and identifying intermediate workload states. The model demonstrated high reliability in detecting low MWL, an essential feature for real-world applications such as pilot monitoring or adaptive automation, where timely recognition of transitions out of low-demand states is critical. The subject-wise data split ensured that model generalization was evaluated on
previously unseen individuals, reinforcing the robustness of the proposed approach, particularly for clearly defined conditions. These findings indicate that, even with a modest dataset and subtle inter-class distinctions, ML models can extract meaningful patterns associated with cognitive load. Additionally, the observed confusion patterns provide valuable insights for refining the experimental design and labelling strategies, for example through more objective ground-truthing methods or task structures tailored to better elicit intermediate workload states. Overall, this work underscores the potential of ocular-based predictive models in MWL estimation and highlights the importance of rigorous experimental protocols to enhance model interpretability and reliability.
ACKNOWLEDGMENT
This publication is part of the project PNRR-NGEU which has received funding from MUR - DM 117/2023.
REFERENCES
Borys, M. (2017). An analysis of eye-tracking and electroencephalography data for cognitive load measurement during arithmetic tasks. 2017 10th International Symposium on Advanced Topics in Electrical Engineering (ATEE), 287–292. Das, C. (2024). Cognitive workload estimation using physiological measures: A
review. Cognitive Neurodynamics, 18(4), 1445–1465. Dayal, A. (2025). A Novel Approach to Cognitive Load Measurement in N-back Tasks Using Wearable Sensors, Empirical Mode Decomposition with Machine Learning, and Explainable AI for Feature Importance. IEEE Access, 13, 17083–17098. Gedam, S. (2021). A review on mental stress detection using wearable sensors and machine learning techniques. IEEE Access, 9, 84045–84066. Hart S. G. (1988). Development of nasa-tlx (task load index): Results of empirical
and theoretical research. Advances in Psychology, 52, 139–183. Ialori, S. (2024). An Overview of Approaches and Methods for the Cognitive Workload Estimation in Human–Machine Interaction Scenarios through Wearables Sensors. BioMedInformatics, 4(2), 1155–1173. Luzzani, G. (2024). A review of physiological measures for mental workload
assessment in aviation: A state-of-the-art review of mental workload physiological assessment methods in human-machine interaction analysis. The Aeronautical Journal, 128 (1323), 928–949. Luzzani, G. (2025). ECG, Respiration, fNIRS, and Eye Tracking for Stress and Mental Workload Monitoring in Human–Machine Interaction. IEEE Access, 13, 122726–122741. Roscoe, A. H. (1984) Assessing pilot workload in flight. Royal Aircraft Establishment Bedford. Santiago-Espada, Y. (2011). The Multi-Attribute Task Battery II (MATB-II) Software
for Human Performance and Workload Research: A User’s Guide. No. L-20031. 2011. Skaramagkas, V. (2021). Review of eye tracking metrics involved in emotional and cognitive processes. IEEE Reviews in Biomedical Engineering, 16, 260–277. Torkami-Azar, M. (2022). Methods and Measures for Mental Stress Assessment
in Surgery: A Systematic Review of 20 Years of Literature. IEEE Journal of Biomedical and Health Informatics, 26(9), 4436–4449.
Predicting Operator Workload from Oculometric Data in High-Demand Environments 731
Wang, Y. (2021). Multi-Sensor Eye-Tracking Systems and Tools for Capturing Student Attention and Understanding Engagement in Learning: A Review. IEEE Sensors Journal, 21(20), 22402–22413. Wei, W. (2023). Classification and prediction of driver’s mental workload based
on long time sequences and multiple physiological factors. IEEE Access, 11, 81725–81736. Yaven, C. (2023). A review of situational awareness in air traffic control. IEEE Access, 11, 134040–134057.
LISTED IN THE AHFE DIGITAL BOOKSTORE CATALOGUE
Explore the complete digital volume
Human Factors in Design, Engineering, and Computing
Read this individual research paper free through the original publisher, or explore the full digital proceedings book.
ISBN 978-1-964867-75-5
Explore this ISBN in the AHFE Bookstore ↗Listed in the July 2026 bookstore catalogue; search by ISBN to confirm current availability · Digital book purchase optional