Tomohiro Fukuhara, Ryohei Tenmoku, Ryoko Ueoka, Takashi Okuma, Takeshi Kurata (2019). Estimating Skills of Waiting Staff of a Restaurant based on Behavior Sensing and POS Data Analysis: A Case Study in a Japanese Cuisine Restaurant. In: Advances in The Human Side of Service Engineering. AHFE Open Access, vol. 8. https://doi.org/10.54941/ahfe100284
An approach to estimate skills of waiting staff of a restaurant by using the human-behavior sensing and POS (point-of-sales) data is proposed. Understanding skills of employees is important in every industry but it is difficult because there are no standard to evaluate their skills. In this paper, we describe experiment results of the support of a QC (quality control) circle of a restaurant. We observed behavior of waiting staff and visualized them to members of the QC circle. Members found that there was a difference on their workload by watching trajectories of waiting staff. For improving their process, they decided the main theme of the QC as “keep positions”. They decided actions to achieve the theme that consist of following: (1) stay longer in the dining area, (2) reduce the movement, and (3) keep their positions. We evaluated these actions using several metrics based on the behavior-sensing and POS data analysis and confirmed that actions (2) and (3) were achieved. Based on these results, we argue skills of waiting staff.
Today there are many services in our society. We can go to trip by using public transportation such as bus and train, we can have meals in restaurants, and so on. In every services, an important aspect is the quality of services; We consider that the quality of services is derived from the systems of services and skills of employees. In this paper, we focus on the latter aspect.
The aim of this study is to assist activities of employees who want to improve their services. These activities are called the QC (quality control) circle (Nonaka, 1983). The QC circle is a voluntary group of employees whose mission is to identify and resolve issues in their work. Although the QC circle originated in manufacturing, methodology and tools can be used in the service industry. In the QC circle, there is discussion between members based on data. There are basic tools used in the QC circle such as cause-and-effect diagram, check sheet, control chart, histograms, Pareto chart, scatter diagram, and stratification diagram (Tague, 2005).
Although there is an established way to have the QC circle, one of major difficulties to improve service processes is the collection of data. To collect data in service fields is not easy because it takes much time and effort for employees. Traditional methods such as the Motion-and-time study (Pigage & Tucker, 1954) and the work sampling (Ray, 2003) have limitations to collect data because they are based on human observation. Because these approaches are based on human observation, it is hard to collect data continuously. Furthermore they can’t apply to service fields where ordinary customers are buying or receiving services.
For assisting the QC circle, Ueoka et al. (Ueoka, Shimmura, Tenmoku, Okuman, & Kurata, 2012) proposed a method to assist QC circle by using the human-behavior sensing and visualization tool. This approach is named as CSQCC (computer supported quality control circle). In CSQCC, one can observe behaviors of employees by using wearable sensors and s/he can browse her trajectory by combining business data such as POS (point-of-sales) data. Ueoka had an experiment of the CSQCC in a Japanese cuisine restaurant and confirmed its effectiveness.
In this paper, we describe an experiment which was held at a Japanese cuisine restaurant to assist the QC circle. We assisted members of the QC circle by using the human-behavior sensing and visualization tool. Members found their behavior and POS data in their normal operation and found an issue that the workload of waiting staff was different among them. For resolving this issue, they implemented actions to improve their process. We evaluated their performance by using several metrics and confirmed improvement of their process. Based on these results, we argue an approach to estimate skills of waiting staff.
This paper is organized as follows. In the next section, we describe the related work. Then we describe an overview of the human-behavior sensing and visualization tool. We describe an overview of the experiment, and results of the experiment. In the discussion section, we discuss results of experiment and argue an approach to estimate skills of waiting staff. In the conclusion, we summarize arguments of this study.
RELATED WORK
There are related work on measurement on workers’ behavior. In the field of Industrial Engineering (IE), there are established methods to observe behavior of employees such as the motion-and-time study and the work sampling. These methods have limitations to observe the work continuously for long term. In this paper, we use the human- behavior sensing tool to collect behavior data of employees automatically and visualize them to assist employees to find issues in their work.
Choudhury and Pentland proposed a sensor system called sociometer that collects human interaction data (Choudhury & Pentland, 2003). With the sociometer, interaction data such as who was accompanied, how long s/he talked, and how often s/he moved are recorded. Kim et al. analyzed shoppers’ behaviors by using the sociometer and found correlations between actions of customers and interests for items (Kim, Chu, Brdiczka, & Begole, 2009).
Olguín and Pentland proposed an approach to observe behavior of employees by using the sociometer to improve their productivity. They reported trials of the sociometer to evaluate productivity in banks and hospitals (Olguín & Pentland, 2009; Olguín & Pentland, 2010). Ara et al. proposed an approach to analyze behavior data of humans by linking with other data called performance indicators such as financial profit, amount of communication, employee satisfaction (ES), and customer satisfaction (CS) (Ara et al., 2008). They created a feedback system that supports employees to find their communication states, and improve them by visualizing interactions among managers and employees (Ara et al., 2012).
Ueoka et al. proposed the concept of CSQCC and its prototype system. They reported experiment results of CSQCC in a restaurant (Ueoka et al., 2012). Fukuhara et al. reported another results of CSQCC in the same restaurant (Fukuhara et al., 2013). As effects of CSQCC, they reported that (1) the increase of the staying time of waiting staff in dining area, (2) the increase of additional orders in the dinner time, and (3) the few difference on the walk distance per customer which indicates the workload of waiting staff. This study also focuses on the assist of the QC circle of the restaurant. This study focuses on the evaluation of actions that are made by the QC circle.
Interactive 3D indoor modeler Customers
Still images of the field 3D field model
Sensor data fusion (SDF)
Waitress and her trajectory
Active RFID tags embedded in the field for correcting positions Environment data Human-behavior data
Visualization tool: Behavior of waitress and POS data are displayed on the 3D field model.
Number of orders by area PDR sensor POS data of the field
Employees
Pedestrian Dead Reckoning (PDR)
Figure 1. Overview of the human-behavior sensing and visualization tool.
HUMAN-BEHAVIOR SENSING AND VISUALIZATION TOOL
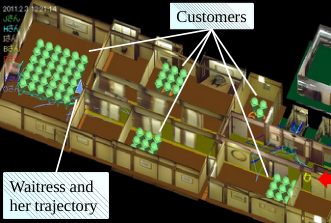
Figure 1 shows an overview of the human-behavior sensing and visualization tool. The tool consists of following subsystems (Ueoka et al., 2012; Fukuhara et al., 2013).
1. Interactive 3D indoor modeller 2. Pedestrian dead-reckoning (PDR) 3. Sensor data fusion (SDF) 4. Data visualization tool Interactive 3D indoor modeller allows users to create a 3D model of a service field from still images. Figure 1 shows the 3D model of a Japanese restaurant. One can easily create a 3D model from images which are taken by digital cameras (Ishikawa, Okuma, & Kurata, 2009).
PDR estimates the location, direction, and velocity of a person (Kourogi et al., 2010). We developed a PDR sensor that captures behavior of a person (see Figure 1). The sensor contains several sensors such as barometer, magnetometer, accelerometer, gyroscope, thermometer, and an RFID reader. PDR estimates the position, direction, and velocity of a person based on the data obtained by the PDR sensor. The error rate is 4.3% and this can be improved to 2.0% by using the action recognition method (Kourogi et al., 2010).
SDF also estimates the location and direction of a person by integrating several data such PDR data, 3D model of the field, active RFID data which are embedded in an environment to correct positions, and so on (Ishikawa, Kourogi, & Kurata, 2011a). The average error of estimation is 2.2 meters by using SDF (Ishikawa, Kourogi, & Kurata, 2011b).
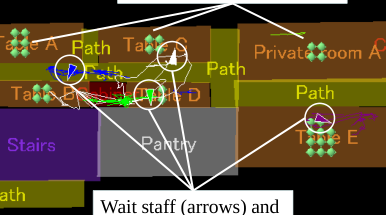
The data visualization tool (visualization tool) visualizes the behavior and business data of the field. One can easily look at trajectories of employees and statistics such as the number of orders by area in this tool. Figure 2 shows an example of trajectories of waiting staff of a restaurant. Arrows indicate staffs and lines indicate their walk paths
(trajectories). Customers are also shown as dots. The sharp edge of an arrow indicates the direction of a staff.
Customers (shown as dots)
Wait staff (arrows) and their trajectories (lines)
Figure 2. Visualization of the movement of waiting staff estimated by the PDR and the SDF methods.Table 1: Terms of the experiment.
Table available in the original PDF paper.
Terms Period Normal observation Jan 16 to Jan 24, 2012
QC circle meeting Jan 31 and Feb 2, 2012 First term (before) Feb 6 to Feb 8, 2012
Second term (after) Feb 10 to Feb 12, 2012
EXPERIMENT We had an experiment of the CSQCC in a Japanese cuisine restaurant. We describe an overview of the experiment and metrics to evaluate performance of their service process.
Overview We collaborated with the QC circle of a Japanese cuisine restaurant to assist them to find issues and resolve them by using the human-behavior sensing and visualization tool. Table 1 shows the terms of the experiment. We first observed the normal process of waiting staff to find issues. Then we showed behavior and POS data which was obtained in the normal observation term in the QC circle meeting. In the meeting, members discussed the data and decided actions to improve their processes. The actions are listed in Table 2. After having the meeting, we observed behavior of waiting staff for a week. The week is divided into two terms. In the first term, waiting staff behave normally, i.e., improvement actions were not executed. In the second term, improvement actions were executed. We evaluated actions by using several metrics which are described in the next subsection.
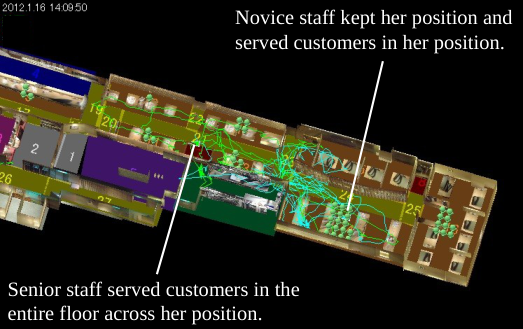
Figure 3 shows the trajectories of two waiting staff which are discussed in the QC circle meeting. These trajectories are made by a novice and a senior staff. At the meeting, members noticed the difference of trajectories by looking at the visualization tool. They found that the novice staff kept her position and served customers in that position, while the senior walked around the floor and served customers in the entire floor. Although the senior staff has an enough skill to serve customers across her position, she could not serve customers in her position carefully. In this restaurant, there is a shift schedule of waiting staff that describes positions to be kept. Waiting staff have to keep their positions, but this rule is not achieved. In Appendix, we describe the positions of the restaurant (see Figure A.1) and the shift schedule (see Table A.1).
From this discussion, members decided the main theme of their process improvement as “keep positions”. The aim of this theme is to decrease the workload of waiting staff which were too different among staff.
Novice staff kept her position and served customers in her position.
Senior staff served customers in the entire floor across her position.
Figure 3. Trajectories of the novice and the senior staff.Table 2: Actions to improve processes and its metrics.
Table available in the original PDF paper.
No. Actions Description Metrics to evaluate performance
1 Stay longer in the dining area
Waiting staff should stay longer in the dining area to serve their customers.
Stay time in the dining area per hour (see Figure 5) Stay time in territory areas per hour (see Figure 6)
2 Reduce the movement
Waiting staff should reduce their movement to other areas.
Walk distance per customer (see Figure 7)
3 Keep your positions
Recall and precision of order taking (see Figure 8 and Figure 9)
Waiting staff should keep their positions. They should not undertake jobs of other areas and should do their jobs in their positions.
Table 2 shows the list of actions to improve their process. The actions consist of following: (1) stay longer in the dining area, (2) reduce the movement, and (3) keep their positions. We evaluated each action by using the metrics listed in Table 2.
Metrics to evaluate performance
We used the following metrics to evaluate actions which were decided by the members of the QC circle:
1. Stay ratio of waiting staff in the dining area 2. Stay ratio in territory areas 3. Walk distance per customer 4. Precision and recall of order taking and F1 measure On the metrics 1 to 3, we analyzed the behavior data of waiting staff. We used the stay ratio in the dining area and the stay ratio in the territory areas for evaluating the action 1. These values are obtained by the human-behavior sensing tool. For the action 2, we used the walk distance per customer. We normalized the walk distance1 because there is a significant correlation between the walk distance and the number of customers in the B1 floor (r=.27, p<.001).
All of orders taken by the staff All of orders occurred in the territory area of the staff Recall Precision
Orders taken by the staff which occurred
Orders taken by the staff which occurred
Orders taken by other staff which occurred in his/her area in his/her area
in other areas
Figure 4. Overview of the recall and precision
Figure available in the original PDF paper.
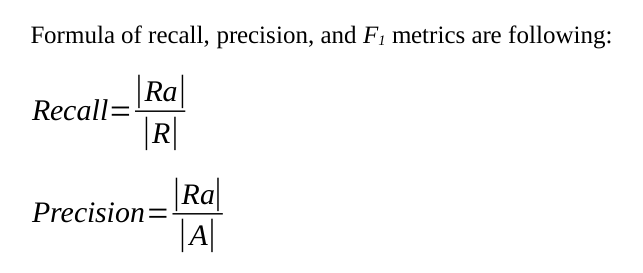
On the metric 4, we analyzed POS data of the restaurant. The recall and precision metrics are widely used in the fields of the pattern recognition and information retrieval (Baeza-Yates & Ribeiro-Neto, 1999). These metrics are effective to understand whether a waiting staff kept her positions, i.e., if she was a good staff, she could take many orders in her position that means the recall and the precision increase. In addition to the recall and the precision, we used the F1 value (Manning, Raghavan, & Schütze, 2008).
Equation reproduced from the original PDF.
Precisoin+Recall
Figure 4 shows an overview of the recall and the precision metrics. |Ra| is the number of orders accepted by waiting staff who is responsible to that area. |R| is the total number of orders in the area. |A| is the number of orders accepted by the waiting staff.
The meaning of the recall and the precision are following: The recall indicates how many orders a waiting staff should keep because the definition is the ratio of accepted orders out of all of orders in her position. Ideally the recall will be high if the waiting staff keeps her position keenly. The precision means how devoted a waiting staff serves her customers because its definition is the ratio of the number of accepted orders out of the total number of accepted orders by the staff. We will discuss these meanings again in the discussion section.
1 We normalized the walk distance by the number of customers stayed in the B1 floor of the restaurant. Human Side of Service Engineering (2019)
RESULTS
Table 3 shows the summary of metrics to evaluate each action between two terms. The table compares means, SDs, and Mann-Whitney’s U and its probability between two terms. We found a significant difference in the walk distance per customer which corresponds to the action 2. We describe results of each action in the following.
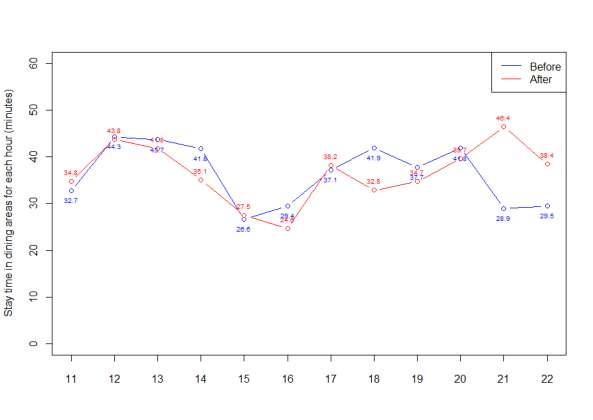
Evaluation for the action 1: “Stay longer in the dining area” We examined the stay time in the dining area and the stay time in territory areas (positions) for evaluating the action 1. Figure 5 compares the average of the stay time of waiting staff in dining areas. Means and SDs (in parenthesis) for each term are 37.4 (14.2) and 36.4 (15.0). There was no significant difference between two terms.
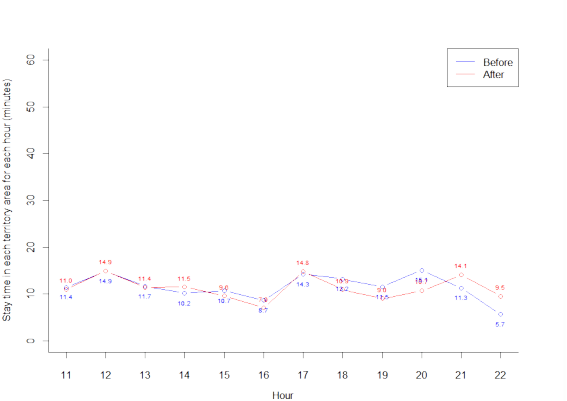
Figure 6 shows the average of the stay time in territory areas of two terms. Means and SDs are 12.0 (7.5) and 11.4 (8.2) respectively. We also found no significant difference between two terms.
Table 3: Summary of metrics variables between two terms (through a day).
Table available in the original PDF paper.
Before After
Variable n M (SD) n M (SD) U P Stay time in the dining area per hour (minutes/hour) 99 37.4 (14.2) 94 36.4 (15.0) 4574 .84
Stay time in territory area per hour (minutes/hour) 98 12.0 (7.5) 94 11.4 (8.2) 4400.5 .59 Walk distance per customer (meters / hour /customer) 64 103.7 (60.2) 89 61.6 (31.9) 1631 <.001
Figure 5. Stay time of waiting staff in dining areas (minutes / hour).Figure 6. Stay time of waiting staff in territory areas (minutes / hour).
*** *** ***
*** p < .001
Figure 7. Walk distance of waiting staff per customer (meters / hour / person).
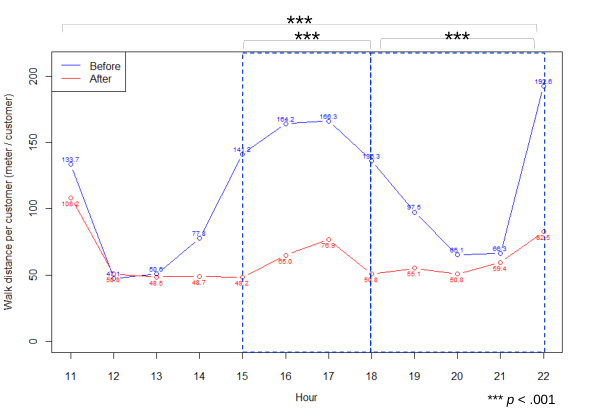
Evaluation for the action 2: “Reduce the movement” For evaluating the action 2, we evaluated the walk distance per customer. Figure 7 shows the walk distance per customer for each hour. We found several significant differences in the following time categories: through whole day (11 a.m. to 11 p.m.) (U=1631, n1=64, n2=90, p < .001, two-tailed), in the tea time (3 p.m. to 6 p.m.) (U=41, n1=15, n2=23, p < .001, two-tailed), and in the dinner time (6 p.m. to 11 p.m.) (U=118, n1=23, n2=27, p < .001, two- tailed). Means and SDs for each term are 103.7 (60.6) and 61.6 (32.1) through the whole day. We found that the waiting staff reduced their movement in the second term.
Evaluation for the action 3: “Keep your position”
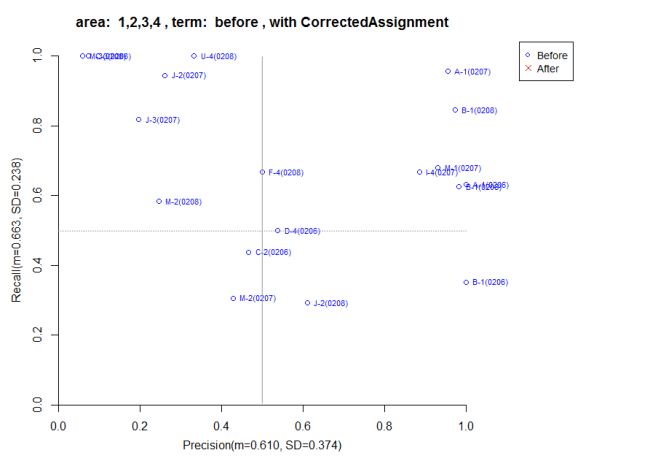
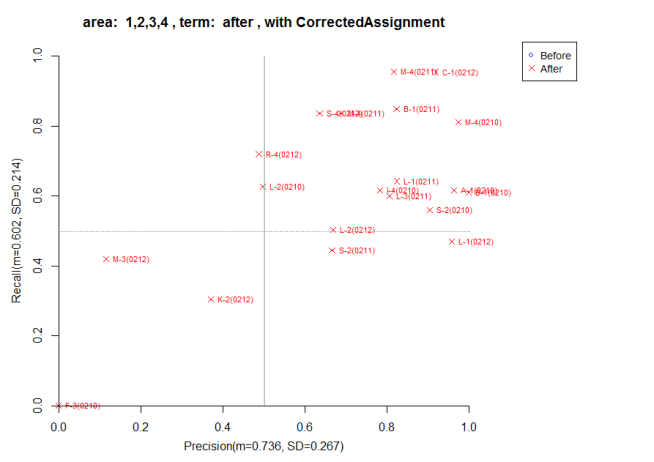
Figure 8 and Figure 9 show the precision and the recall of order taking of waiting staff for each term. In Figure 8, waiting staff are scattered over the plane. Meanwhile in Figure 9, waiting staff are plotted at the upper-right area where both of the recall and the precision are high. Although there was no significant differences, we found that there is a tendency of the movement of positions in the recall and precision plot.
Means and SDs on the recall for each term are .66 (.24) and .60 (.21). For the precision, means and SDs for each term are .61 (.37) and .74 (.27). We can see the increase of the precision. On the F1 value, means and SDs for each term are .58 (.25) and .67 (.18). Although the F1 value increased, there was no significant difference.
DISCUSSION
From experiment results, we found that the QC circle members succeeded to improve their processes by achieving some of actions.
For the action 1, we consider that this action was not achieved because there were no significant differences on the stay time in dining areas (see Figure 5) and the stay time in territory areas (see Figure 6).
For the action 2, we found a significant difference on the walk distance per customer between two terms (see Figure 7). The mean of this metric was decreased from 103.7 to 61.6 which was a significant difference (U=1631, p<.001). This indicates that waiting staff achieved this action.
For the action 3, we confirmed the change of positions in the recall and the precision plot between two terms (see Figure 8 and Figure 9). Although we could not find significant differences on the recall and the precision between two terms, this result suggests that waiting staff kept their positions in the second term. We can guess that waiting staff did their work with less effort by keeping each position in the second term.
Figure 8. Precision and recall in the first term.Figure 9. Precision and recall in the second term.
Based on the recall and precision plot, we consider that we can estimate the skills of waiting staff by using the recall and the precision values. Figure 10 shows the idea of the skill estimation by using the recall and the precision plot. We consider following four classes of skill: (I) Novice, (II) Beginner, (III) Proficient, (IV) Expert.
The class names are based on the classification of skill acquisition stages proposed by Dreyfus (S. E. Dreyfus and Dreyfus, 1980). They proposed the following stages on the skill acquisition: (1) Novice, (2) Competence, (3) Proficiency, (4) Expertise, and (5) Mastery. Among these stages, we adopted four stages.
1
Recall
1
Precision
Figure 10. Relation between skill level and the recall and the precision plot.
Figure available in the original PDF paper.
The novice class has a property that both of the recall and the precision is low. This means that the staff failed to take orders in her area (i.e., recall decreases) and takes orders in other areas (i.e., precision decreases). For waiting staff in this class, basic training is required to keep her position.
The beginner class has a property that the recall is low and the precision is high. This means that the waiting staff is trying to take orders in her area (i.e., precision approaches 1.0) but failed to take some of them (i.e., recall decreases). For waiting staff of this class, appropriate support by senior staff would be needed.
The proficient class has a property that both of the recall and the precision is high. This means that the waiting staff can take all of orders in her area perfectly (i.e., recall approaches to 1.0), but she does not take orders in other areas (i.e., precision approaches to 1.0). For keeping each territory, waiting staff who belong to this class is better. From the viewpoint of skills of waiting staff, this might not be better because the development of her skill is stopped because she does not care about any orders in other areas. If she takes orders in other areas, her skill might be developed towards the class IV.
Finally the expert class has a property that the recall is high and the precision is low. This means that the waiting staff can take all of orders in her territory area (i.e., recall approaches to 1.0) and she can take orders in other areas (i.e., precision decreases). Waiting staff of this class can be said an expert because they can take all of orders in her assigned area and orders in other areas additionally. In this experiment, waiting staff of this class appeared in the first term but disappeared in the second term (see Figure 8 and Figure 9). For averaging the workloads of waiting staff, this strategy is better.
We consider that skills of waiting staff can be developed from class I to class IV. Although this is a hypothesis, we will verify this hypothesis in the future work.
CONCLUSIONS
We described experiment results of CSQCC in a Japanese cuisine restaurant. We had an experiment in the restaurant to assist its QC circle by using the human-behavior sensing and visualization tool. From this experiment, we found that our suite supported the members to identify issues in their work and decided actions to resolve them. They suggested the main theme of the QC as “keep positions” and decided several actions to achieve the theme. Experiment results revealed that the walk distance per customer decreased in the second term which correcpods to the achievement of the action 2, and the recall and the precision plot changed which corresponds to the achievement of the action 3. From these results, we conclude that members achieved their theme. Finally we proposed an approach to estimate skills of waiting staff by using the recall and the precision plot. Our future work is to verify whether skills of waiting staff develop from class I to class IV.
ACKNOWLEDGMENT
This study was supported by the Ministry of Economy, Trade and Industry (METI) of Japan. The authors thank Ganko Food Service Co., Ltd., and all staffs in the Ganko Ginza 4-chome restaurant for their great cooperation.
REFERENCES
Ara, K., Kanehira, N., Olguín, D., Waber, B. N., Kim, T., Mohan, A., Gloor, P., Laubacher, R., Oster, D., Pentland, A. S., & Yano, K. (2008). “Sensible organizations: changing our businesses and work styles through sensor data”. Journal of Information Processing, 16, 1882-6652. Ara, K., Akitomi, T., Sato, N., Takahashi, K., Maeda, H., Yano, K., & Yanagisawa, M. (2012). “Integrating wearable sensor
technology into project-management process”. Journal of Information Processing, 20(2), 406-418. Baeza-Yates, R., & Ribeiro-Neto, B. (1999). “Modern information retrieval”. New York: ACM press. Choudhury, T., & Pentland, A. (2003). “Sensing and modeling human networks using the Sociometer”. Proceedings of the 7th IEEE International Symposium on Wearable Computers, pp.216-222. doi:10.1109/ISWC.2003.1241414 Dreyfus, S. E., & Dreyfus, H. L. (1980). “A five-stage model of the mental activities involved in directed skill acquisition”.
California Univ Berkeley Operations Research Center, USA. (available at http://oai.dtic.mil/oai/oai? verb=getRecord&metadataPrefix=html&identifier=ADA084551, accessed on 2014-3-27) Fukuhara, T., Tenmoku, R., Okuma, T., Ueoka, R., Takehara, M., Kurata, T. (2013). “Improving service processes based on visualization of human-behavior and POS data: a case study in a Japanese restaurant”. Proceedings of the 1st International Conference on Serviceology, pp.1-8. Tokyo, Japan. Ishikawa, T., Okuma, T., & Kurata, T., (2009). “Interactive indoor 3D modeling from a single photo with CV support”.
Proceedings of the 3rd International Workshop on Ubiquitous Virtual Reality (IWUVR2009), Adelaide, Australia. Ishikawa, T., Kourogi, M., & Kurata, T. (2011a). “Economic and synergistic pedestrian tracking system with service cooperation for indoor environments”. International Journal of Organizational and Collective Intelligence (IJOCI), 2(1), 1-20. doi:10.4018/ijoci.2011010101 Ishikawa, T., Kourogi, M., & Kurata, T. (2011b). “Evaluation and application of service-worker tracking system in real shop
floors”. Transactions of the VR Society of Japan, 16(1), 23-34. (in Japanese) Kim, T. J., Chu, M., Brdiczka, O., & Begole, J. (2009). “Predicting shoppers' interest from social interactions using sociometric sensors”. Extended Abstracts of the 27th Annual CHI Conference on Human Factors in Computing Systems (CHI 2009), pp.4513-4518. doi: 10.1145/1520340.1520692 Kourogi, M., Kurata, T., & Ishikawa, T. (2010). “A method of pedestrian dead reckoning using action recognition”. Proceedings
of the Position Location and Navigation Symposium (PLANS), 2010 IEEE/ION, pp.85-89. doi:10.1109/PLANS.2010.5507239 Manning, C. D., Raghavan, P., & Schütze, H. (2008). “Introduction to information retrieval”. Cambridge, UK: Cambridge University Press. Nonaka, I. (1993). “The history of the quality circle”, Quality Progress, ASQC American Society for Quality Control, 26, pp.81-
83. Ueoka, R., Shinmura, T., Tenmoku, R., Okuma, T., & Kurata, T. (2012). “Introduction of computer supported quality control circle in a japanese cuisine restaurant”. Advances in the Human Side of Service Engineering, pp.379-388. Boca Raton, FL:CRC Press. doi:10.1201/b12315-45 Olguín, D.O., & Pentland, A. (2009). “Sensible organizations: A sensor-based system for organizational design and
engineering”. Proceedings of the International Workshop on Organizational Design and Engineering (IWODE09) (available at http://iwode09.ist.utl.pt/~iwode09.daemon/doku.php?id=program, accessed on 2014-03-27). Olguín, D.O., & Pentland, A. (2010). “Sensor-based organisational design and engineering”. International Journal of Organisational Design and Engineering, 1(1/2), 69-97. doi: 10.1504/IJODE.2010.035187 Pigage, L. C., & Tucker, J. L. (1954). “Motion and time study”. In R.W. Fleming, and B.D. Dennis (Eds.), The University of
Illinois Bulletin, 51(73) (available at http://hdl.handle.net/2142/9385, accessed on 2013-05-30). Ray, P. S. (2005). “Work sampling”. In A. B. Badiru (Ed.), Handbook of Industrial and Systems Engineering, chapter 7, Boca Raton, FL: CRC Press. doi:10.1201/9781420038347.ch7 Tague, N. R. (2005). “The quality toolbox”. Milwakee, WI: ASQ Quality Press.
APPENDIX
Area assignment and shift schedule of the restaurant
B1 floor (dining areas) Sushi bar 10/20 area (Table area)
Cash desk
40 area (Private room)
To Kitchen Entrance
Pantry
30 area (Table area)
50 area (Private room)
Figure A.1. An overview of the restaurant (B1 floor). There is a sushi bar, two table areas, and two private room There are four positions (territory areas) to keep: 10/20 areas, 30 areas, 40 areas, and 50 areas. One staff is allocated to one of these areas (see A.1).
Table A.1: Shift table of the restaurant in the experiment term (February 6 to 12, 2012).
Note. The schedule is manually corrected so that adequate staff is allocated to each cell based on the original schedule and the POS data. Letters "A" to "U" in the table indicate IDs of waiting staff. "Day" indicates the shift which begins at 11 a.m. until 5 p.m. "Night" indicates the shift begins at 5 p.m. until 11 p.m.
Figure A.1 shows the overview of the B1 floor of the restaurant. The B1 floor has one sushi bar, two table areas (10/20 and 30 area), and two private rooms (40 and 50 areas). We call these areas dining areas. For waiting staff, there are positions (territory areas) to take charge of. Figure A.1 also shows territory areas. One staff is allocated to each territory area. Table A.1 shows the shift schedule of the restaurant indicating who keeps which position.
LISTED IN THE AHFE DIGITAL BOOKSTORE CATALOGUE
Explore the complete digital volume
Advances in The Human Side of Service Engineering
Read this individual research paper free through the original publisher, or explore the full digital proceedings book.
ISBN 978-1-4951-2091-6
Explore this ISBN in the AHFE Bookstore ↗Listed in the July 2026 bookstore catalogue; search by ISBN to confirm current availability · Digital book purchase optional