Yuh-Chuan Shih, I-Lin Cheng (2020). The Learning Effect of Hand Dexterity between Old and Young People. In: Advances in The Ergonomics in Manufacturing: Managing the Enterprise of the Future. AHFE Open Access, vol. 12. https://doi.org/10.54941/ahfe100454
When Taiwan moved towards an aging society, there are very rich studies for the elderly in academic. The past, many studies focus on physical function decline, but less study focused on the age influence on hand function learning effect. The purpose of this study is use of a learning curve model to explore the difference between elder and youth in the handedness dexterity. Twenty youth and 20 elder were recruited. A Purdue pegboard was used to measure the dominant hand dexterity for 15 times, and a 20-second rest was given between successive trials. A learning curve in power function was modeled for each participant, and the associated theoretical time to complete the first trial () and learning rate () were calculated. The ANOVA result indicated that the learning rate between youth and elder was not significantly different, but elder had significantly longer . That is, for pure motor skill, degeneration in hand dexterity due to aging only slows the moving speed, but does not shift the learning rate. Therefore, to reach a present industrial standard elder need more practice, otherwise, we should reduce the standard to match the physical capabilities of elders.
The workforce is aging, e.g. Americans age 55 years and older are anticipated to represent 34% of the population and 41.2% of the labor force by 2014 . Taiwan is one of the fastest aging countries in the world. Since 1993 Taiwan became an aging society (7% of people over 65-year-old), and ministry of the interior predicts that Taiwan will become an aged society in 2018 (14% of people over 65-year-old). The aging is a common trend in the world, and the governments should be forced to encounter the impact from aging, such as deficiency in workforce.
Older people often experience difficulty performing everyday activities, one of the possible reasons is because of an apparent decline in hand functions, such as the reduction in hand strength and dexterity, which are the basic requirements in daily life activities . Compared with young subjects, the fact of the older group’s having weaker hand force (grip, pinch) could result from that aging attributes to about 25~45% reduction in muscular mass . Ranganathan, Siemionow, Sahgal, and Yue (2001) revealed that compared with young subjects, the older group’s ability to maintain steady submaximal pinch force and a precision pinch posture was significantly less; the time taken to relocate the pegs and the distance needed to discriminate two identical stimuli increased significantly with age. In general, elderly persons appear to exhibit muscle weakness and a slowing in their speed of muscle movement . With increasing age, declines in strength, speed of movement, and coordination occur that are related to a decline in neuromuscular function .
Being owing to aging in industrial workforce, to understand how manual dexterity is affected by age is essential, so that jobs requiring significant manual dexterity for task initiation, task performance and task completion should be redesigned to fit older adult dexterity levels. Accommodating age-related changes in manual dexterity is important for job design in industry, especially in industries employing older adults requiring significant. Pennathur, Contreras, Arcaute, and Dowling (2003) demonstrated that older adults performed significantly slower than young adults on the two-arm coordination test and also took longer to complete the hand-tool dexterity task as compared to youngers. Ranganathan et al. (2001) revealed that the elder was less fine hand dexterous than the youth. Age-related assembly performance decrements have been reported, such as learning times for manual assembly tasks became substantially longer for persons over the age of 40 unless the older person had previous related experience , and motor performance slows with age, particularly with increased task difficulty . We have known that hand dexterity of the elder is slow, but how fast the elder learn about the dexterity is still not well documented.
For decades, learning curves have been used for predicting and monitoring the performance of individuals, groups of individuals, and organizations. They have been widely applied in various sectors, such as manufacturing, healthcare, education, and construction. A learning curve is a mathematical description of workers’ performance in repetitive tasks . The most popular of all available models is the one proposed by Wright (1936). It is a power function of the number of practices. Its popularity is attributed to its simple mathematics and to its ability to fit a wide range of data fairly well. The Wright model is shown in Eq. (1): b n n T T 1 [Equation or mathematical symbol available in the original paper PDF] …Eq. (1)
where n T is the time for the nth practice, 1T is the theoretical time to finish the first practice, n is the number of practices, and the b is a learning constant between 0 and -1. In addition, b 2 [Equation or mathematical symbol available in the original paper PDF][Equation or mathematical symbol available in the original paper PDF] is called the learning rate between 0 and 0.5, and a smaller learning rate indicates faster learning. Eq. (1) can be rewritten as Eq. (2) if both sides are converted to a logarithm. Eq. (2) can be rewritten as the Eq. (3) for the sake of establishing a simple linear regression model:
) ( ) ( ) ( 1 n Ln b T Ln T Ln n [Equation or mathematical symbol available in the original paper PDF][Equation or mathematical symbol available in the original paper PDF][Equation or mathematical symbol available in the original paper PDF] …Eq. (2) ' ' 1 ' n b T Tn [Equation or mathematical symbol available in the original paper PDF][Equation or mathematical symbol available in the original paper PDF][Equation or mathematical symbol available in the original paper PDF] …Eq. (3)
Where ) ( '
n n T Ln T [Equation or mathematical symbol available in the original paper PDF] , ) ( 1 ' 1 T Ln T [Equation or mathematical symbol available in the original paper PDF] , and ) ( ' n Ln n [Equation or mathematical symbol available in the original paper PDF] .
Learning can be classified into two parts, cognitive and motor learning. The learning rate for a purely cognitive learning task has been shown to be around 0.7, and that for purely motor learning, around 0.9 . Usually tasks contain both parts. Therefore, the main aim of present paper is to compare the theoretical time to finish the first practice ( 1T ) and learning rate ([Equation or mathematical symbol available in the original paper PDF]) of elder with of the youth.
METHODS
Participants Twenty youth and twenty elder (over 65-year-lod) took part in this experiment, and each aging group contained 10 males and 10 females. All were free from musculoskeletal disorders and their vision was normal or corrected to be at least 0.8 for youth and at least not to affect their daily life activities for elder. The demographic data were shown in Table.
Material and Apparatus Fabricated pegboard shown in Figure 1 was utilized to measure hand dexterity, which was measured in time (sec) recorded by a stop watch. In addition, a 75-cm-high table and a chair with 45-cm height were also used to unify the operation posture.
Procedures All participants were first explained the goal of this experiment and familiarized themselves with the procedures. They were asked to sit on an adjustable-height chair and a pegboard was placed 10-cm away from the edge of a 75- cm-high table. Prior to the formal measurement any practice was not allowed, and the only one all participants had to do was to adjust the height of the chair to make sure that they could perform the experiment comfortably and smoothly.
At the beginning, participants put their both hands by the sides of the pegboard, which was located in front of them and already with ten pins inserted on the most right-side. Participants were then instructed to move these ten pins from bottom to top to the most left-side, then these pins were moved back again from top to bottom to the most right-side. Moving to the left and back to the right was called one trial, in which all steps are shown in Figure 1. When a pin was dropped, participants were asked to give up the dropped one and to pick another new one up from the iron dish located on in the front of the pegboard and to finish the given movement. The consumed time was still continued recording in a case of dropping until all movements were completed. There was no practice to make participants familiar with the movement. Participants were asked to repeat 15 trials in the experiment and the consumed time was recorded and as denoted by tn (n=1, 2, 3, …, 15). There was a 15-sec break between successive practices and the time needed to complete a practice (tn) was recorded for analysis.
Figure 1:The steps for pegboard manipulation
Data Collection and Experimental Design The time consumed for each trial was recorded (tn, n=1, 2, 3, …, 15) and used to fit the learning curve of each participant according to the Wright’s model, in which the theoretical time to complete the first practice (T1) and learning rate ([Equation or mathematical symbol available in the original paper PDF]) of each participant were adopted for analysis by means of a nested-factorial design with factors of age-group (young and old) and sex (nested within age-group). In the model, the highest interaction order with the participant served as the error term to precisely test the influence of all factors. The software Statistica8.0 was employed for data analysis, and a post hoc Newman-Keuls test was used to test paired differences for significant main effects and interactions. The level of significance (α) was 0.05.
RESULTS AND DISCUSSION
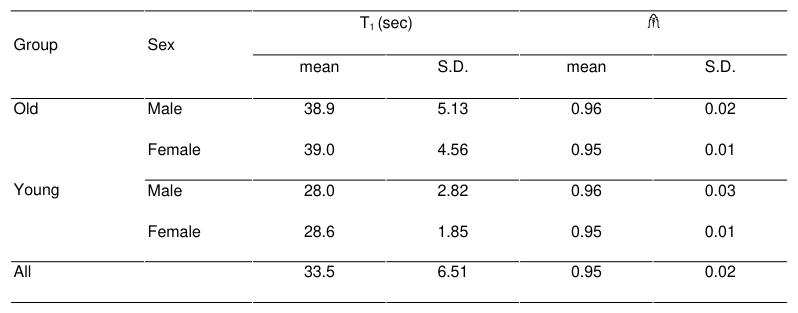
The ANOVA results indicated that, for the time to complete the first trial (T 1), the effect of age-group was significant, but the sex effect within the age-group was not. The averaged T1 value for old-group was about 39.0 sec, and 28.3 sec for young-group. As for the learning rate ([Equation or mathematical symbol available in the original paper PDF]), both effects were not significant, and the overall averaged [Equation or mathematical symbol available in the original paper PDF] value was 0.95. The descriptive statistics for T1 and [Equation or mathematical symbol available in the original paper PDF] are shown in Table 2.
Table 2: the descriptive statistics for the time to complete the first practice (T1) and learning rate ([Equation or mathematical symbol available in the original paper PDF]) T1 (sec) [Equation or mathematical symbol available in the original paper PDF] Group Sex mean S.D. mean S.D.
Old people were demonstrated to have less hand strength and worse dexterity , and slowing in their speed of muscle movement . The declines in strength, speed of movement, and coordination with increasing age are related to a decline in neuromuscular function . Aforementioned could result in elder’s T1 was longer than that of youth, and this fact also definitely reveals that older people moved more slowly than young people.
The studies by Carnahan, Vandervoort, and Swanson (1996), van Dijk, Mulder, and Hermens (2007), and Spirduso, Smith, and Choi (1993) on fine-motor-skill learning revealed a similar learning gain for older and younger adults. One explanation for the lack of age difference is that the tasks may not have been complex enough to identify age difference. Motor control research suggests that as the task difficulty increases, the differences between young and old adults also increase .
CONCLUSIONS
Elder had longer time to complete the first trial (T1), but the learning rate ([Equation or mathematical symbol available in the original paper PDF]) was well as youth. Therefore, to reach a present industrial standard elder need more practice, otherwise, we should reduce the standard to match the physical capabilities of elders.
REFERENCES
Carmeli, E., Patish, H., & Coleman, R. (2003). The aging hand. The Journals of Gerontology Series A: Biological Sciences and Medical Sciences, 58(2), M146-M152. Carnahan, H., Vandervoort, A. A., & Swanson, L. R. (1996). The influence of summary knowledge of results and
aging on motor learning. Research quarterly for exercise and sport, 67(3), 280-287. Dar-El, E. M., Ayas, K., & Gilad, I. (1995). A dual-phase model for the individual learning process in industrial tasks. IIE transactions, 27(3), 265-271. Fioretti, G. (2007). The organizational learning curve. European journal of operational research, 177(3), 1375-
1384. Grimby, G., Danneskiold-Samsøe, B., Hvid, K., & Saltin, B. (1982). Morphology and enzymatic capacity in arm and leg muscles in 78–81 year old men and women. Acta Physiologica Scandinavica, 115(1), 125-134. Hancock, W. M. (1967). The prediction of learning rates for manual operations. Journal of Industrial Engineering,
18(1), 42-47. Hunter, S., White, M., & Thompson, M. (1998). Techniques to evaluate elderly human muscle function: a physiological basis. The Journals of Gerontology Series A: Biological Sciences and Medical Sciences, 53(3), B204-B216. Ketcham, C. J., & Stelmach, G. E. (2001). Age-related declines in motor control. Handbook of the psychology of
aging, 5, 313-348. Light, K. E., & Spirduso, W. W. (1990). Effects of adult aging on the movement complexity factor of response programming. Journal of Gerontology, 45(3), P107-P109. Pennathur, A., Contreras, L. R., Arcaute, K., & Dowling, W. (2003). Manual dexterity of older Mexican American
adults: a cross-sectional pilot experimental investigation. International Journal of Industrial Ergonomics, 32(6), 419-431. Ranganathan, V. K., Siemionow, V., Sahgal, V., & Yue, G. H. (2001). Effects of aging on hand function. Journal of the American Geriatrics Society, 49(11), 1478-1484. Seidel, D., Richardson, K., Crilly, N., Matthews, F. E., Clarkson, P. J., & Brayne, C. (2010). Design for independent
living: activity demands and capabilities of older people. Ageing and Society, 30(7), 1239. Spirduso, W. W., Smith, A., & Choi, J. (1993). Age and practice effects on force control of the thumb and index fingers in precision pinching and bilateral coordination Sensorimotor impairment in the elderly (pp. 393-412): Springer. Toossi, M. (2005). Labor force projections to 2014: Retiring boomers. Monthly Lab. Rev., 128, 25. van Dijk, H., Mulder, T., & Hermens, H. J. (2007). Effects of age and content of augmented feedback on learning an
isometric force-production task. Experimental aging research, 33(3), 341-353. Wright, T. P. (1936). Factors affecting the cost of airplanes. Journal of the Aeronautical Sciences, 3(2), 122-128.
LISTED IN THE AHFE DIGITAL BOOKSTORE CATALOGUE
Explore the complete digital volume
Advances in The Ergonomics in Manufacturing: Managing the Enterprise of the Future
Read this individual research paper free through the original publisher, or explore the full digital proceedings book.
ISBN 978-1-4951-2103-6
Explore this ISBN in the AHFE Bookstore ↗Listed in the July 2026 bookstore catalogue; search by ISBN to confirm current availability · Digital book purchase optional