Ronald Boring (2022). Implications of Human Reliability Analysis for Human Readiness Levels. In: Human Error, Reliability, Resilience, and Performance. AHFE Open Access, vol. 33, pp. 99–106. https://doi.org/10.54941/ahfe1001573
Technology readiness levels (TRLs) were developed to gauge the maturity of new technologies. TRLs are effective for determining suitability for procurement and guiding the evolution of novel research and development efforts from the conceptual stage, through demonstration, to implementation and deployment. A recent augmentation to TRLs is human readiness levels (HRLs). HRLs are anchored to human factors and map suitability for human use. A low HRL may suggest that a technology is early in its human-system interface development, while a high HRL confirms that a technology is fully usable by humans interacting with it. HRLs provide a measure of technology maturity not just according to the hardware or software captured in the TRLs but also the human end users. Ideally, TRLs and HRLs should align, especially as a system reaches maturity and approaches deployment. To date, the relationship between human reliability analysis (HRA) and HRLs has not been explored. HRA seeks to map the rate and nature of human errors when using a system. This paper explores the relationship between human reliability and HRLs. HRA can support the HRL determination by providing acceptable performance criteria and a process for quantifying the appropriate level. HRA can also provide predictive measures to complement empirical usability and maturity assessments.
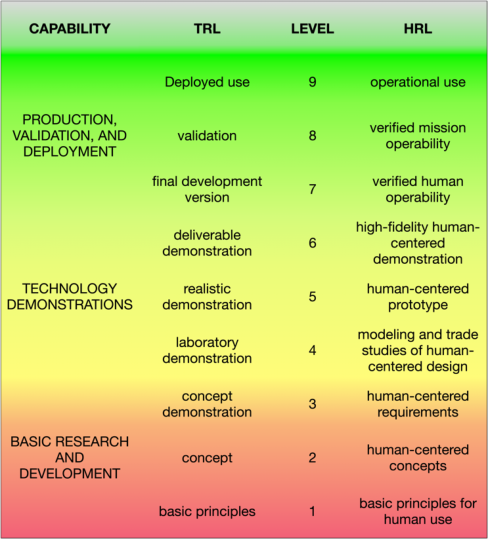
TECHNOLOGY READINESS LEVELS As new technologies are introduced, it is crucial to gauge the readiness of that technology for deployment, especially when considering the procurement of novel technology or investments in research and development. Development maturity is captured specifically in terms of the technology readiness level (TRL; Government Accountability Office, 2020). TRLs were originally deve- loped and applied by the National Aeronautics and Space Administration but were later widely adopted by the U.S. Department of Defense (2017) and other agencies. TRLs depict how close a technology is to deployment, with higher numbers (up to TRL 9 on the scale) representing an increased rea- diness for deployment. The first three TRLs, 1–3, represent basic research and development; the next, 4–6, represent proofs of concept and demonstra- tion; and the final three, 7–9, represent full-scale testing, production, and deployment. Each of these TRL groups represents a progression from early to mature basic research, demonstration, and deployment, respectively.
TRLs are especially useful for gauging research maturity, which starts conceptually but may fail to reach deployment if not aligned with a systema- tic development process. High-value technologies should not languish at low TRLs, and TRLs help identify promising research that would benefit indu- stry through deployment. TRLs may serve as a roadmap to bring a good idea to maturity. Likewise, TRLs serve as a gauge to ensure novel technology is not deployed prematurely. Of course, technology maturation is not an over- night process, and it’s not necessarily possible to quickly leapfrog multiple levels. Elevating TRLs serves as a goal to drive the systematic advancement of capabilities and maintain advancement momentum over the development lifecycle.
HUMAN READINESS LEVELS Technology often requires human users, and a potential shortcoming of TRLs is that they identify the developmental maturity of technology without expli- citly considering the overall suitability of that technology for human use. ANSI/HFES 400-2021, The Human Readiness Level Scale in the System Development Process (Human Factors and Ergonomics Society, 2021), serves as a counterpart for the TRL to ensure that technology is ultimately usable and safe for deployment. Human readiness levels (HRLs) offer a one-to-one mapping with TRLs as shown in Figure 1. Note that the terminology is some- what simplified here, in that the term validation is used as a catch-all phrase for fully tested and verified. Regardless of terminology, a strong emphasis is placed on human evaluations across the HRLs. Initial HRLs may suffice with analytic tools, but higher HRLs should employ validation techniques such as human-in-the-loop evaluations with increasing fidelity to the end use environment and scenarios. HRLs are simply a way of ensuring human factors engineering principles are included as part of the development of a new technology. Specifying HRLs as a standard in ANSI/HFES 400-2021 ensures human-centered design in the development lifecycle and technology procurement process.
While there is a direct relationship between the nine TRLs and nine HRLs, it is possible that the two developmental maturity levels fall out of alignment. As described in ANSI/HFES 400-2021, misalignment happens when one lags the other.
When the HRL lags the TRL, there is risk that the technology is not usa- ble, thereby placing significant risk on its viability, especially at higher TRLs. Human-centered design should not be an afterthought, and failing to align technology engineering activities with human factors processes can result in products that are marginal in terms of the human-machine interface (HMI). The late consideration of human end users can lead to considerable design rework, resulting in significant project delays. Alternately, a rush to deploy can yield faulty and unsafe products, potentially resulting in accidents and recalls. Regulated environments may find themselves with insufficient user validation to warrant licensing when the TRL is too far ahead of the HRL. For example, in advanced reactor designs in nuclear power, there may be a heavy initial focus on hardware without a parallel development of the concept
Implications of Human Reliability Analysis for Human Readiness Levels 101
Figure 1: Crosswalk of TRLs and HRLs. (adapted from ANSI/HFES-400).
of operations. This TRL ahead of the HRL could risk substantial delays in licensing new reactor technologies. The regulator simply cannot license an advanced reactor until there is sufficient assurance of the design safety and usability by human reactor operators.
In contrast, a TRL that lags an HRL may not pose a significant risk to the technology, but an elevated HRL relative to the TRL remains a prototype without a mature technology behind it. Speculative human-system designs remain in the lower TRLs associated with basic research and development. For example, so-called Wizard of Oz demonstrations involve simulating fea- tures that give the technology the appearance of being more capable than it actually is (Dahlbäck et al., 1993). An example would be a highly sophistica- ted and automated control room for an advanced reactor that was not based on currently available control systems. Table 1 illustrates an HRL trailing vs. leading a TRL for this example. Technology reviews should ensure that human-centered demonstrations have corresponding hardware and software maturity underlying those demonstrations and that features are not heavily simulated beyond the realistic capabilities of the technology at hand.
HUMAN RELIABILITY ANALYSIS One noted reason for adopting HRLs is because the consequence of poor HMIs is often human error. While the ANSI/HFES 400-2021 standard sug- gests this link, it never explicitly details the relationship between HRLs and human reliability analysis (HRA). This should not be seen as a deficiency
102 Boring
Table 1. Examples of an HRL-TRL mismatch for advanced reactor development.
Table available in the original PDF paper.
HRL < TRL HRL > TRL Development of new reactor design centered on hardware, whereby hardware reaches maturity but concept of operations development comes later. The reactor design may fail to be licensed by the regulator until there is a successful validation of human operations of the control system, thereby delaying deployment of the new reactor.
Development of an advanced control room design with high levels of control automation and advanced visualizations, whereby the automation is largely simulated. The absence of suitable validated automation technologies makes for an advanced demonstration that is not licensable until the underlying control system technology matches it.
of HRL guidance but rather as an open opportunity to explore how human error might be caused by low HRLs, how HRA might be aligned to HRLs, and how this alignment may reduce human errors and thereby ensure the safe deployment of nascent technologies.
Human Error and Low HRLs HRA exists across multiple methods that estimate the likelihood of human error. To illustrate the effect of a low HRL, here I consider a representative HRA method, namely the Standard Plant Analysis Risk-Human (SPAR-H; Gertman et al., 2005) method. SPAR-H uses a set of performance shaping factors to estimate the increase or decrease in the human error probability (HEP) relative to a nominal error rate. A negative influence results in a mul- tiplier that increases the HEP. Several performance shaping factors in SPAR-H are relevant to technology and show how the HEP can increase because of poorly executed human-centered technology with a low HRL. The two most directly applicable performance shaping factors to HRLs in SPAR-H are:
Complexity—which relates to how hard a task is to complete—can double the error rate for moderately complex tasks and quintuple the error rate for highly complex tasks. Complexity has been coupled to the system with which the user interacts, whereby a nonintuitive system greatly increases complexity (Lois et al., 2009). Complexity is also connected to workload (Boring and Blackman, 2007), with increases in complexity resulting in increased workload, another contributor to increased error rates.
HMI/Ergonomics—which accounts for the quality of the HMI with which the user interacts—can increase the error rate tenfold for a poor HMI and fiftyfold for a missing or misleading HMI.
These two performance shaping factors alone can see the HEP increase by a factor of 250. A nominal human error rate of 1 in 1,000 for a well-designed system can increase to 1 in 4 for a poorly designed system with a low HRL. Such error calculations necessarily include large uncertainty bounds, but they illustrate how readily a low HRL can inflate the HEP. SPAR-H includes six additional performance shaping factors I have not discussed here, many of
Implications of Human Reliability Analysis for Human Readiness Levels 103
which may also be tied to a user’s poor experience with a system and fur- ther increasing the error rate. Conversely, for a highly effective and mature HMI, SPAR-H allows crediting performance shaping factors to decrease the HEP. For example, complexity may actually enhance human performance if the system affords an obvious diagnosis, decreasing the HEP by a factor of 10. Similarly, the HMI performance shaping factor credits a good HMI with halving the error rate relative to the nominal HEP.
Mapping HRA to HRLs Human readiness is more than human error. Many HRL facets may be adequ- ately treated by the measures of usability, including effectiveness, efficiency, and satisfaction (International Standards Organisation, 2018). For safety critical systems that have the potential to harm organisms or the environ- ment in misuse or accident situations, the HRL needs to consider human error, particularly human errors that can contribute to system failures. Risk is commonly defined as the product of likelihood and consequence of failures (Kaplan and Garrick, 1981). A human error is therefore mainly of interest if it has a negative consequence on the system. The consequence is modeled in the probabilistic risk assessment (PRA), which looks at hardware failure and, specifically, the points where human action or inaction causes damage to a component, system, or process. A direct parallel may be drawn betw- een TRLs and HRLs with PRA and HRA. HRLs indicate the opportunity for the human to impact the effectiveness of the overall system represented by the TRL, just like HRA indicates the opportunity for the human to impact the overall system in the PRA.
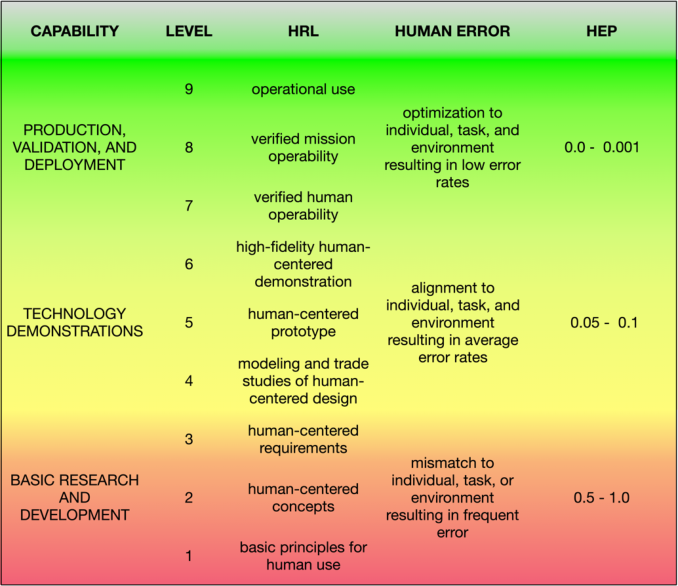
Once the consequential interactions between hardware and human are accounted for in the PRA, the role of HRA is to determine the causes of human errors and their corresponding HEPs. In Figure 2, these two HRA dimensions are proposed to correspond to the HRLs. The HRA dimensions of human error and HEP are only mapped at three broad levels, with addi- tional refinements planned in the future, including identifying more specific types of errors that would be expected at each HRL. For the present purposes, the human error is seen along a continuum of poorly matching, aligning, or optimizing the HMI for the individual, task, or environment. Generally, the higher the HRL, the fewer human errors should occur, assuming the design process identifies and reduces errors. The HRL-HRA mapping can become prescriptive, although the error rates may be adjusted for different fields and contexts. The error rates presented in Figure 2 are taken from nuclear power HRA applications (Forester et al., 2007).
HRA to Support HRLs An irony of HRA is that the more reliable a system is, the less likely it is to be validated. A low probability event of 1 in 1,000 is unlikely to be obse- rved without large numbers of samples, whereas a high probability event of 1 in 10 requires relatively few repeated observations to demonstrate. For this reason, relying solely on empirically derived HRA data would become increa- singly formidable at high HRLs. Instead, a sampling technique is appropriate
104 Boring
Figure 2: Crosswalk of HRLs and HRA.
for most empirical approaches. A similar strategy is employed in human factors testing of safety critical systems (O’Hara et al., 1997), whereby representative critical safety functions are identified and tested. HRA also identifies performance shaping factors that would adversely affect performa- nce, allowing researchers to select worst-case scenarios through error seeding (Boring et al., 2016).
HRA methods like SPAR-H exist to predict human error in the absence of empirical data. ANSI/HFES 400-2021 cautions that modeling may be best reserved for low HRLs. However, due to the afore-mentioned limita- tions of frequentist empirical data to validate low human error rates, human error modeling can serve as a useful approach across all HRLs. For exam- ple, for a system at a low HRL, HRA may be used as a type of screening tool to determine which human errors are likely and use that information to inform areas to focus on during human-centered design. As the design maturity increases, HRA may be used in a more nuanced manner to inform design (Boring, 2010). In the middle HRLs, HRA insights on errors may be used to prioritize design elements to ensure safety. In the higher HRLs, HRA may be used to explore what-if scenarios that prove risk significant. Identified problem scenarios from HRA may be used as validation scenarios during human-in-the-loop system testing, ensuring confidence in the final design. Newer HRA methods such as dynamic HRA (Boring et al. 2015),
Implications of Human Reliability Analysis for Human Readiness Levels 105
which uses simulation, are especially helpful for conducting what-if scenario development that may be missed through traditional assessment by subject matter experts (Boring et al., 2022).
CONCLUSION
The use of HRA to support HRLs shows promise, especially for the purpose of certifying systems that may require safety significant controls by human users. This paper has begun to explore the relationship between HRA and HRLs. The approach presented here stands to benefit from refinement, and demonstrations of use cases for HRA across different levels of HRLs are parti- cularly important in linking the two approaches. Nonetheless, there are clear and immediate benefits to merging HRA and HRLs.
HRA can be useful in making deployment decisions where safety conside- rations are paramount and may not be fully quantifiable using empirical human factors methods.
HRA is complementary to empirical evaluations of human readiness and augments human factors techniques with modeling tools.
HRA can prioritize areas for improvement in support of elevating the HRL.
HRA is mature in some domains and immature in others. While HRA has found widespread use in certain fields like nuclear power, framing HRA in terms of HRLs allows HRA to have a wider impact across technological domains.
Future work will continue to explore HRA within HRLs, provide more nuanced mappings between HRA and HRLs, and demonstrate use cases of HRA and HRLs.
DISCLAIMER This work of authorship was prepared as an account of work sponsored by Idaho National Laboratory (under contract no. DE-AC07-05ID14517), an agency of the U.S. Government. Neither the U.S. Government, nor any agency thereof, nor any of their employees makes any warranty, express or implied, or assumes any legal liability or responsibility for the accuracy, completeness, or usefulness of any information, apparatus, product, or process disclosed, or represents that its use would not infringe on privately owned rights. The Uni- ted States Government retains and the publisher, by accepting the article for publication, acknowledges that the U.S. Government retains a nonexclusive, paid-up, irrevocable, world-wide license to publish or reproduce the publi- shed form of this manuscript, or allow others to do so, for U.S. Government purposes.
REFERENCES
Boring, R.L. (2010). “Human reliability analysis for design: Using reliability methods for human factors issues”, Proceedings of the Seventh American Nuclear Society International Topical Meeting on Nuclear Plant Instrumentation, Control, and Human-Machine Interface Technologies, pp. 1488–1497.
106 Boring
Boring, R.L., & Blackman, H.S. (2007). “The origins of the SPAR-H method’s performance shaping factor multipliers”, Proceedings of the Joint 8th IEEE Conference on Human Factors and Power Plants and the 13th Annual Work- shop on Human Performance/Root Cause/Trending/Operating Experience/ Self- Assessment, pp. 177–184. Boring, R.L., Joe, J.C., & Mandelli, D. (2015). Human performance modeling for
dynamic human reliability analysis. Lecture Notes in Computer Science, Volume 9184, pp. 223–234. Boring, R., Lew, R., Ulrich, T., & Savchenko, K. (2016). “When human error is good: Applications of beneficial error seeding”, Proceedings of the 13th Internati- onal Conference on Probabilistic Safety Assessment and Management (PSAM 13), Paper A-532, pp. 1–7. Boring, R., Ulrich, T., Ahn, J., Heo, Y., & Park, J. (2022). Software Implemen-
tation and Demonstration of the Human Unimodel for Nuclear Technology to Enhance Reliability (HUNTER), INL/RPT-22-66564. Idaho Falls: Idaho National Laboratory. Dahlbäck, N., Jönsson, A., & Ahrenberg, L. (1993). “Wizard of Oz studies— Why and how”, Proceedings of the Conference on Intelligent User Interfaces ’93. pp. 193–200. Department of Defense (2017). DOD instruction 5000.02T: Operation of the defense
acquisition system. Office of the Undersecretary of Defense for Acquisition and Sustainment. Washington, DC: Department of Defense. Forester, J., Kolaczkowski, A., Cooper, S., Bley, D., & Lois, E. (2007). ATHE- ANA User’s Guide, NUREG-1880. Washington, DC: U.S. Nuclear Regulatory Commission. Gertman, D., Blackman, H., Marble, J., Byers, J., & Smith, C. (2005). The SPAR-H
Human Reliability Analysis Method, NUREG/CR-6883. Washington, DC: U.S. Nuclear Regulatory Commission. Government Accountability Office. (2020). Technology Readiness Assessment Guide: Best Practices for Evaluating the Readiness of a Technology for Use in Acquisition Programs and Projects, Report No. GAO-20-48G. Washington, DC: Government Accountability Office. Human Factors and Ergonomics Society. (2021). Human Readiness Level Scale in the
System Development Process, ANSI/HFES 400-2021. Washington, DC: Human Factors and Ergonomics Society. International Standards Organisation. (2018). Ergonomics of human-system interaction—Part 11: Usability: Definitions and concepts, ISO 9241-11:2018(en). Geneva: International Standards Organization. Kaplan, S., & Garrick, B.J. (1981). On the quantitative definition of risk. Risk Analysis, Volume 1. pp. 11–27. Lois, E., Dang, V.N., Forester, J., Broberg, H., Massaiu, S., Hildebrandt, M., Braarud,
P. Ø., Parry, G., Julius, J., Boring, R., Männistö, I, & Bye, A. (2009). Internati- onal HRA Empirical study—Phase 1 Report, Description of Overall Approach and Pilot Phase Results from Comparing HRA methods to Simulator Performa- nce Data, NUREG/IA-0216, Vol. 1. Washington, DC: US Nuclear Regulatory Commission. O’Hara, J., Stubler, W., Higgins, J., & Brown, W. (1997). Integrated System Validation: Methodology and Review Criteria, NUREG/CR-6393. Washington, DC: U.S. Nuclear Regulatory Commission.
LISTED IN THE AHFE DIGITAL BOOKSTORE CATALOGUE
Explore the complete digital volume
Human Error, Reliability, Resilience, and Performance
Read this individual research paper free through the original publisher, or explore the full digital proceedings book.
ISBN 978-1-958651-09-4
Explore this ISBN in the AHFE Bookstore ↗Listed in the July 2026 bookstore catalogue; search by ISBN to confirm current availability · Digital book purchase optional