Tero Reunanen, Vesa Taatila (2022). Student Satisfaction Towards Studies - Disciplinary, Demographic or Situation Related Variable?. In: Human Factors, Business Management and Society. AHFE Open Access, vol. 56, pp. 359–365. https://doi.org/10.54941/ahfe1002290
Students´ satisfaction towards studies is one of the most interesting information for universities in student questionnaires. How satisfied our students are and how we could enhance the satisfaction or guarantee that it will be high also in future. The reasons why some students are more satisfied towards their studies than others are always crucial to develop organization and studies. Sometimes the reasons can be explained more easier way than others and sometimes the reasons are more critical to organizations future than others. We have already shown in our last article that student satisfaction is correlating with personnel´s felt justice. In this research we are scrutinizing things which are affecting to students´ satisfaction deeper. We are studying how if and how the available demographic variables are affecting to the results of felt satisfaction. It will also be interesting to note if there are some demographic variables that do not have an effect on the felt justice.This research will be conducted by utilizing two different questionnaire tool Student barometer. Student barometer is a questionnaire for higher education students in Finland. It´s objectives are to provide data and information for researchers, research institutes education developers and decision makers in the institutes. Student barometer handles a variety of different matters from student life by asking students´ opinions from quality of studies to their civil life activities and their expectations of the future. Student barometer data consists of 2165 individual students as respondents in year 2019. They answered at most to 201 different questions and propositions. As the questionnaire was dynamic and depended partly on the previous answers, not all the questions and propositions were targeted to all of the students. Also the students’ responses were grouped by their degree programs, which makes it possible to compare the felt justice of the staff members to that of the students per each degree program. We are studying data sets from year 2016 to 2021. Data is analyzed with Excel and SPSS. Samples were taken from the data mass and were composed to a statistical model with excel spreadsheet. Students were grouped under schools and arithmetic averages and standard deviations were calculated to each proposition. After calculating the arithmetic averages further analysis was done with SPSS statistical analysis program. In SPSS proposition’s correlations were analyzed by single tailed Pearson correlation.The overall research question is: Is there a correlation between student satisfaction and available demographic variables. If so, how can this/these correlations be interpreted and what conclusions can be made? Future research aspects and practical recommendations will also be issued in the paper.
Students’ satisfaction towards studies is one of the most interesting pieces of information for universities in student questionnaires. How satisfied the students are and how the universities could enhance the satisfaction or gua- rantee that it will be high also in future. The reasons why some students are more satisfied towards their studies than others are always crucial to develo- ping the organization and the educational programs. Sometimes the reasons can be explained more easier way than others and sometimes the reasons are more critical to organization’s future than others.
Reunanen and Taatila (2021) have already shown that student satisfaction is correlating with personnel’s felt justice. This paper aims to scrutinize deeper the things which are affecting to students’ satisfaction. It discusses about if and how the available demographic variables are affecting to the results of felt
student satisfaction. It will also note, if there are some demographic variables that do not influence the felt justice.
Equality theories are linked satisfaction as relative attribute (Stouffer 1949) and balance of different exchange ratios (Homans 1958; Blau 1964; Adams 1965). Later Bies and Moag (1986) added concept of relational justice or interactional justice that means how people are treated during decision- making process which could be mirrored to education world as staff makes decisions about student matters. Experienced fairness is related to many posi- tive attributes in organizations from atmosphere of organization to workers health and job satisfaction. (Al-Zu’bi, 2010; Ambrose, et al., 2007; Cohen- Charash & Spector, 2001; Fassina, et al., 2008; Hausknecht, et al., 2004; Li & Cropanzano, 2009a).
While much of the research focuses on individual experience, fairness is also important on organizational level. Li and Cropanzano (2009b) have shown that the experience of fairness works also at unit level. Organizational fairness can thus be seen as an important piece of organization’s cultural stru- cture (Taatila, 2004), giving, or denying it competitive edge. These findings open the possibility to compare the experienced fairness between individual student groups and see if there is a correlation between them and the sati- sfaction. Former studies have scrutinized students groups divided by age and gender (Russo 2011; Nwenyi & Baghurst 2013) and study year Russo (2011).
The theoretical discussion was derived to a hypothesis (H1), (H2), (H3), (H4), (H5) and a research question (RQ1): (H1): There is a correlation betw- een student satisfaction and sex. (H2) There is a correlation between student satisfaction and age. (H3) There is a correlation between student satisfa- ction and study year. (H4) There is a correlation between student satisfaction and discipline. (H5) There is a correlation between student satisfaction and answering time. (RQ1): If the any of these correlations exists, how can it be interpreted and what conclusions can be made?
RESEARCH Initial Sample
This research will be based on material gathered from Turku University of Applied Sciences (TUAS) in the year 2020. It is conducted by utilizing questi- onnaire tool called Student Barometer. Student barometer is a questionnaire for higher education students within TUAS. Its’ objectives are to provide data and information for researchers, research institutes education developers and decision makers in the institute. Student barometer handles a variety of dif- ferent studies-related matters by asking students’ opinions from quality of studies to their civil life activities and their expectations of the future. The student barometer data consists of 2934 individual students as respondents. They answered at most to 201 different questions and propositions. As the questionnaire was dynamic and depended partly on the previous answers, not all the questions and propositions were targeted to all of the students. Students’ satisfaction was studied by selecting two propositions for analyses. These propositions were: P1) Evaluate how satisfied you are to study in TUAS
Student Satisfaction Towards Studies. 361
Table 1. P1 sample sizes, arithmetic means and standard deviations for groups.
Table available in the original PDF paper.
Group n Mean Stdev Whole sample 2877 3,622 0,799 Male 1137 3,647 0,815 Female 1739 3,606 0,788 Age under 21 288 3,785 0,663 Age 21–25 1532 3,595 0,783 Age 26–30 476 3,544 0,865 Age 31–35 251 3,649 0,854 Age 36–40 327 3,691 0,809 Study year1 991 3,806 0,680 Study year2 931 3,597 0,805 Study year3 652 3,474 0,848 Study year4 254 3,429 0,897 Study year5 49 3,327 0,866 Discipline 1 38 3,974 0,628 Discipline 2 446 3,832 0,629 Discipline 3 87 3,793 0,570 Discipline 4 214 3,780 0,686 Discipline 5 802 3,608 0,803 Discipline 6 908 3,532 0,847 Discipline 7 378 3,458 0,882 Answ. Time 8–12 1184 3,612 0,803 Answ. Time 12–16 987 3,684 0,754 Answ. Time 16–20 419 3,547 0,857 Answ. Time 20–24 227 3,542 0,819 Answ. Time 24–08 60 3,617 0,838
P2) How probably you would recommend TUAS for your friend? First proposition was to be answered with scale 1-5, where 1 was very unsatisfied, 2 unsatisfied, 3 neutral, 4 satisfied and 5 very satisfied. The second one was answered to scale 0-10 where 0 was the worst and 10 was the best number.
The students’ responses were grouped by their age, study year, discipline, gender and time when students were answering to the questionnaire.
Analysis Samples were taken from the data mass and were composed to a statisti- cal model with Excel spreadsheet. Propositions were analyzed first looking the differences between means. Further scrutiny was made with SPSS with the most promising comparisons. Samples were grouped under scrutinized groups and arithmetic averages and standard deviations were calculated to each proposition. The groups are shown in the Table 1.
As seen from the Table 1 there cannot be seen any reasonable differences in relations between P1 and gender as there was only 0,041 difference. Also, the difference between groups’ means were quite low regarding the answer time (0,142) and age (0,241). Larger differences were found between groups by
362 Reunanen and Taatila
Table 2. Indicates the results of these correlations. All correlations were statistically significant.
Table available in the original PDF paper.
P1 P2 P3 P1 1 ,725** ,424** P2 1 ,422**
**p<.01.
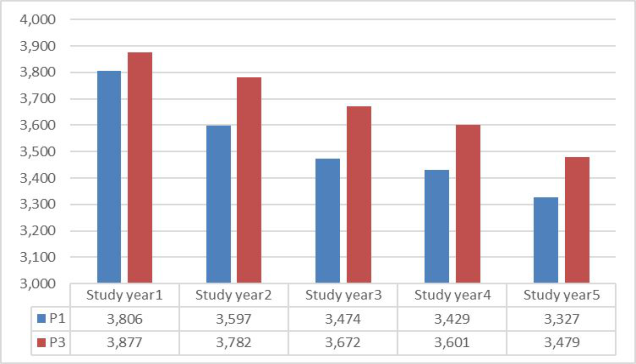
Figure 1: Arithmetic means for P1 and P3 sorted by study year.
their study year (0,480) and disciplines (0,516). From this perspective there seems to be connection between discipline and study year of the respondent. As the former research (Reunanen & Taatila 2021) indicated, there is a cor- relation between felt justice and student satisfaction. Thus, these correlations were taken to deepen analysis.
Next analyses were made with SPSS. The correlations were analyzed between propositions.
P1) Evaluate how satisfied you are to study in TUAS P2) How probably you would recommend TUAS for your friend? P3) Teachers treat students equal and fair way As seen from Table 2 the former research results (Reunanen & Taatila 2021) regarding students’ satisfaction and willingness to recommend univer- sity was confirmed. Probably the most interesting result from this analysis is that satisfaction and feeling of righteousness are correlating heavily in the whole sample. This result deserved more thorough investigation. As earlier indicated the largest differences were found between groups divided by their study year and discipline.
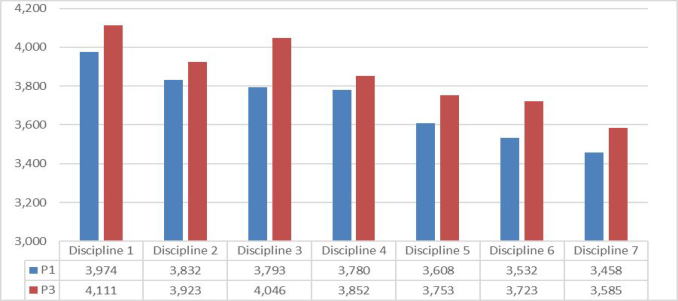
Correlations between satisfaction and feeling of righteous treatment sorted by disciplines and study year is seen in the Figures 1 and 2.
As seen, there is clear correlation between these two variables. These groups include all groups divided to different age groups, genders, and time when they have answered to questionnaire i.e., they contain demographically
Student Satisfaction Towards Studies. 363
Figure 2: Arithmetic means for P1 and P3 sorted by study year.
scrutinized explanations. Therefore, it seems that from scrutinized explanati- ons the feeling that teachers treat students well seems to be the most plausible. This is further backed when looking the groups so that when analyzing the correlations between groups’ arithmetic means of P1 and P3 it is found that correlation is also very strong. (n = 25, r = 0,901, p << 0,001).
CONCLUSIONS AND DISCUSSION The theoretical discussion was derived to a hypothesis (H1), (H2), (H3), (H4), (H5) and a research question (RQ1): (H1): There is a correlation between student satisfaction and gender. (H2) There is a correlation between student satisfaction and age. (H3) There is a correlation between student satisfa- ction and study year. (H4) There is a correlation between student satisfaction and discipline. (H5) There is a correlation between student satisfaction and answering time. (RQ1): If the any of these correlations exists, how can it be interpreted and what conclusions can be made?
It indeed seems that there is a strong indication that there is a connection between university students’ study year and student satisfaction as well as discipline and student satisfaction. Therefore, it can be said that hypotheses H3 and H4 are supported. For other hypotheses H1, H2 and H5 this research didn’t find any evidence. Thus, they should be considered to be falsified from the point of view of this study.
In order to answer to research question (RQ1) a more thorough inve- stigation and therefore a new analysis was conducted. In that, the student satisfaction was analyzed with students’ feeling of righteous treatment from teachers. When scrutinizing results of this analyses, it was quite clear that, students’ feeling of righteous treatment from teachers can be at least a partial explanation for different student satisfaction levels. It makes this explanation more plausible that all teachers and students belong mostly to school which is included to one discipline. Therefore, it seems that for some reason, in cer- tain disciplines students feel that their teacher don’t treat them as righteous way than in another. This result concurs with the researchers’ earlier results (Reunanen & Taatila 2021).
364 Reunanen and Taatila
Another supported hypothesis regarding correlation between study year and satisfaction on the other hand can’t directly be explained with the same explanation of differences in teachers’ and students’ relationship. However, similar results have also been presented earlier, for example by Nwenyi and Baghurst (2013) and Russo (2011). There are differences in this aspect in separate studies, but overall, it seems that the student satisfaction decreases over study years. Russo (2011) connects this deve- lopment mainly to the increasing and cumulative emotional and cognitive stress over the study years and as the transition to the working life comes closer.
While this explanation seems at least plausible, there are still some worries about some biases in the sample of this study. There might be study-year–based differences in student satisfaction since during the que- stionnaire was made there was covid19 pandemic affecting differently to disciplines possibility to organize education. Thus, there have been major differences between the organization of the studies and the overall social environment based on when the students have started their studies. Also, the questionnaire was made less than year after there was large changes done in TUAS’s campuses and some disciplines had just moved to new campus area and all disciplines were somehow relocated. Because of these environmental changes, the presented results should be taken indicative at most.
Even though this study didn’t found any correlations between satisfaction and gender, age, and answering time it doesn’t mean that those could not be found. The sample was rather small and related only to one institution. However, Nwenyi and Baghurst (2013) did not find a major correlation betw- een student satisfaction, gender and age either, so it might be that these two demographic variables are not the most important ones when explaining the student satisfaction.
To get better understanding from students’ satisfaction further research should be done. The approach of this study should be repeated with different sample group. Also, a more thorough crosschecking between different attri- butes of respondents may give the different explanations than just student teacher relationships. There also may be different variables that are explai- ning better these found correlations such as how well students’ preliminary expectations are met in the studies.
The higher education has been growing rapidly all over the world, and even small differences to the student and graduate satisfaction could have major effects on the future development on global scale. Being able to create a system that satisfies better the students will create a university a major competitive edge over the other institutions.
The big question this study rises is how can the righteous treatment of the students be improved in all the disciplines and over the study years. The study itself doesn’t provide this type of answers, so it would require a more quali- tative research project or a meta-analysis of previously conducted studies to understand the background of these important phenomena.
Student Satisfaction Towards Studies. 365
REFERENCES
Adams, J.S., (1965) Inequity in social exchange. In: Advances in experimental social psychology, Berkowitz, Leonard (Ed.) Academic press, New York, pp. 276–299. Al-Zu’bi, H.A., (2010) A Study of Relationship between Organizational Justice
and Job Satisfaction. International Journal of Business and Management, 5(12), pp. 102–109. Ambrose, M., Hess, R.L. & Ganesan, S., (2007) The relationship between justice and attitudes: An examination of justice effects on event and system-related attitudes. Organizational Behavior and Human Decision Processes, 103(1), pp. 21–36. Bies, R.J., Moag J.F., (1986) Interactional justice: Communication criteria of fairness.
In. Lewicki, R.J., Blair, H., Bazerman, S., Bazerman, M.H. (eds.) Research in negotiations in organizations. JAI Press, Greenwich, pp. 43–55. Blau, P., M., (1964) Exchange and power in social life. Wiley, New York. Cohen-Charash, Y., Spector, P.E., (2001) The role of justice in organizations: A meta-analysis. Organizational Behavior and Human Decision Processes, 86(2), pp. 278–321. Fassina, N.E., Jones, D.A., Uggerslev, K.L., (2008) Meta-analytic tests of relati-
onships between organizational justice and citizenship behavior: testing agent- system and shared-variance models. Journal of Organizational Behavior, 29(6), pp. 805–828. Hausknecht, J.P., Day, D.V., Thomas, S.C., (2004) Applicant Reactions to Selection Procedures: An Updated Model and Meta-Analysis. Personnel Psychology, 57(3), pp. 639–683. Homans, G.,C., (1985) Social behavior as exchange. American Journal of Sociology.
63, pp. 597–606. Li, A., Cropanzano, R.S., (2009a) Do East Asians respond more/less strongly to Organizational Justice Than North Americans? A Meta-Analysis. Journal of Management Studies, 46(5), pp. 787–805. Li, A., Cropanzano, R.S., (2009b) Fairness at the Group Level: Interunit and
intraunit justice climate. Journal of Management, 35, pp. 564–599. Nwenyi, S. & Baghurst, T., (2013) Demographic and Attitudinal Factors Influencing Doctoral Student Satisfaction. Canadian Social Science, 9(6), pp. 47–56. Reunanen, T. J. & Taatila, V.P., (2021) Felt Justice. Correlations Between University
Students and University Personnel. J. I. Kantola et al. (Ed): AHFE 2021, LNNS 267, pp. 158–166. Russo, G., (2011) Graduate students: Aspirations and anxieties. Nature, 475, pp. 533–535. Stouffer, S.A., Suchman, E.A., DeVinney, L.C., Star, S.A., Williams, R.M.Jr., (1949)
Studies in Social Psychology in World War II: The American Soldier. Vol. 1, Adjustment During Army Life. Princeton University Press, Princeton. Taatila, V.P. (2004) The Concept of Organizational Competence–A Foundational Analysis. Jyväskylä Studies in Computing 36. Jyväskylä, University of Jyväskylä.
LISTED IN THE AHFE DIGITAL BOOKSTORE CATALOGUE
Explore the complete digital volume
Human Factors, Business Management and Society
Read this individual research paper free through the original publisher, or explore the full digital proceedings book.
ISBN 978-1-958651-32-2
Explore this ISBN in the AHFE Bookstore ↗Listed in the July 2026 bookstore catalogue; search by ISBN to confirm current availability · Digital book purchase optional