Michihiro Yoshida, Tanaka Takayuki, Yoshio Tsuchiya (2022). Modeling of changes in lumbar joint stiffness by pelvic tightening based on physique and pelvic alignment. In: Physical Ergonomics and Human Factors. AHFE Open Access, vol. 63, pp. 205–213. https://doi.org/10.54941/ahfe1002614
We have been elucidated the mechanism by which pelvic belt reduces lumbar burden. Pelvic tightening increases the lumbar joint stiffness and inhibits the flexion of the lumbar spine in the forward bending. Flexion of the lumbar joint is substituted by the hip joint, which corrects the posture during forward bending and reduces the lumbar burden (lumbar joint torque). The level of the assisting effect of the tightening force has the individual difference, but at present, it is not clear what factors cause it. In this study, we develop a model that represents the assistance effect based on the physique such as height and weight, and the posture and shape of the pelvis and lumbar spine (pelvic alignment).This study developed a regression model that expresses the amount of change in joint stiffness due to tightening force, using the individual physique and pelvic alignment characteristics as input. The joint stiffness was estimated from motion measurement using optical motion capture and obtained from the equation of motion of the link model representing the human body. Pelvic alignment was measured by X-ray images, and five features were obtained: sacral inclination angle (SS angle), pelvic inclination angle (PT angle), inclination angle of the sacrum relative to the pelvis (PI angle), curvature of the lumbar lordosis, and pelvic aperture angle. Among these, the SS angle, PT angle, and PI angle were measured under two conditions: standing and 45 degrees forward bending and obtained a total of eight pelvic alignment features. In addition, height, weight, BMI, and back muscle strength were added as physique characteristics expressing body size and muscle strength, for a total of 12 variable measured. These features were measured on 15 subjects. Among the 12 features, three to four variables were input to the model by excluding those that were strongly correlated with each other and less capable of explaining changes in the target value, joint stiffness.From the proposed model, changes in joint stiffness could be estimated from pelvic alignment and physique characteristics. At large forward bending angles, we found that to obtain a high assistance effect, tilting of the sacrum anteriorly relative to the pelvis and forward tilting of pelvis is necessary. On the other hand, in the mild forward bending, the person who is higher body weight in addition to the forward tilt of the PT and PI angles tend to obtain higher assistive effect.
In general, pelvic belts and corsets are used for the prevention and treatment of low back pain. These devices have been studied for a long time and have been reported to reduce the burden on the lower back (Bartelink, 1957, Lee et al. 2000, OH, 2004, Vleeming et al. 1992). We have also conducted motion measurement experiments using optical motion capture on 93 subjects, and have clarified the mechanism by which pelvic belts reduce the lumbar burden (yoshida, 2018, yoshida, 2019) (Fig. 1). In most of the subjects, the lum- bar burden was reduced, but in some subjects, the burden increased, and the degree of the assisting effect varied among individuals (Yoshida 2018, Yosh- ida 2021). However, to date, the factors that cause such individual differences have not yet been clarified, and it is also unclear what level of assistive effect is expected for each individual. Therefore, the purpose of this study is to develop a mathematical model to estimate the assistive effect from the physi- cal characteristics of each individual, and to clarify the factors that cause the individual differences.
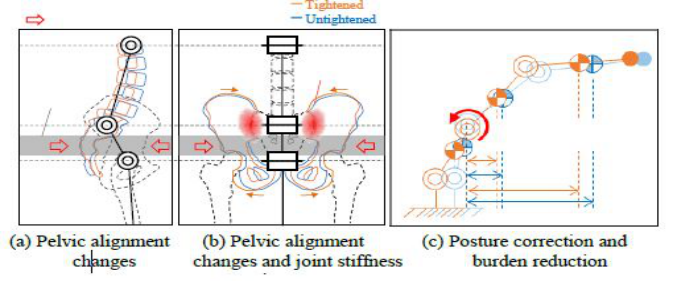
Figure 1: Mechanism to reduce lumbar burden by pelvic tightening.
METHODS
Model Output This chapter considers the model equation to be developed in this study and its inputs and outputs based on the mechanism by which the pelvic belt redu- ces the lumbar burden. The pelvic belt is worn between the femoral greater trochanter and the superior anterior iliac spine to tighten the sacrum and the acetabulum simultaneously. The lumbar region of the human body is repre- sented by a two-dimensional three-link model, as shown in Figure 1. When a tightening force is applied to the pelvis, the compression by the belt produces a force that pushes the sacrum from the back. This causes the sacrum to tilt backward around the sacroiliac joint, and the sacrum presses against the hip bone, which is in contact with the sacroiliac joint (Figure 1(a)). In addition, the pelvis is subjected to compression forces from the right and left directions, which deform the pelvis so that the upper part is closed, and the compres- sion force on the sacroiliac joint surface increases. Lumbar joints (sacroiliac joints) with increased frictional resistance have increased stiffness to flexion in the sagittal plane (Figure 1(b)) (Yoshida, 2019). The flexion of the lumbar joint is inhibited due to increased stiffness, and this flexion is replaced by the hip joint (Figure 1(c)). As the flexion of the lumbar joint is reduced and the posture is corrected, the moment arm from the lumbar joint to each center of gravity of the upper body is shortened, and the torque exerted at the lum- bar joint is reduced (Yoshida 2018). The contraction of the back muscles to generate the lumbar joint torque dominantly contributes to the compression of the intervertebral discs, so a decrease in the joint torque means a reduction in the lumbar burden. The lumbar joint stiffness must be increased in order to reduce the lumbar burden, and the greater the increase in joint stiffness, the greater the assistance effect. We have proposed the joint stiffness ratio R, which will be described in the next section, as an index to evaluate the effect of the pelvic belt on the stiffness. In the mathematical model developed in this study, the output is 1R, which is the amount of change in the joint stiffness ratio R due to pelvic tightening.
Modeling of Changes in Lumbar Joint Stiffness by Pelvic Tightening 207
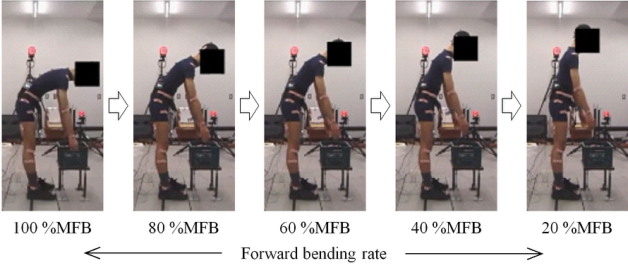
Figure 2: Joint angle during the upper body extension was measured for estimating joint stiffness.
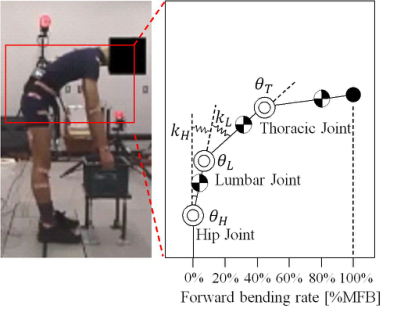
Estimation of Joint Stiffness This chapter describes a method to obtain 1R , the change in the joint stif- fness ratio. The joint stiffness is estimated from the subject’s joint angles obtained by motion measurement using optical motion capture. The measu- rement was performed by extending the upper body from a forward bending posture with the 12th thoracic vertebrae inclined 45 degrees to a standing posture over 3 seconds (Figure 2). The mechanical model shown in Figure 3 is used for the estimation. The equations of motion of the model are descri- bed by Eq. (1), taking into account the inertia term M(θx) ¨θx, the centrifugal and Coriolis force terms c(θx, ˙θx), the gravity term g(θx), the elastic force term kxθx, and the muscle exertion torque τmx. Note that θx and θx0 represent the joint flexion angle and the equilibrium point of the elastic joint, respectively, and are accompanied by x, which takes H (hip joint), L (lumbar vertebrae), and T (thoracic vertebrae) as symbols for the joint location. The stiffness values kL and kH of the lumbar and hip joints are obtained by inputting the joint angles obtained from the motion measurement to Eq. (1) (yoshida, 2019). When the hip joint replaces the flexion of the lumbar joint, it is the ratio of the stiffness values kL and kH that determines the ratio of flexion of the two joints. Therefore, the change in joint stiffness of the lumbar region is evaluated by the joint stiffness ratio R calculated by Eq. (2). The joint stif- fness ratio R was calculated for the case with pelvic tightening (belt tension: 80 N) and the case without the belt, respectively, and the difference between them, the change in stiffness ratio 1R, was obtained.
Equation reproduced from the original PDF.
kH
To define the degree of forward flexion, we introduce the forward bending rate (%MFB), which is a measure of the horizontal distance from the link base to the link end position shown in Figure 3. The forward flexion rate is set at 100% MFB at the initial posture of 45 degrees forward bending, and decreases as the upper body is extended. The stiffness ratio change, 1R, is calculated for each of the four intervals where the forward bending rate is
Figure 3: Mechanical model for estimating joint stiffness.
20-40% MFB, 40-60% MFB, 60-80% MFB, and 80-100% MFB, and the coefficients of the model are also determined for each interval.
Inputs to the Model In this section, we consider the input to the model. In the previous section mechanism, we predicted that the factors that increase joint stiffness are chan- ges in the posture and shape of the lumbosacral vertebrae and pelvis (hereafter referred to as pelvic alignment). It has been pointed out that pelvic alignment is affected by tightening force (Klima, 2018, Laouissat et al., 2018, Pierre and JL, 2011, Sichting et al., 2014), and it has been suggested that changes in pelvic alignment contribute to increased stability of the sacroiliac joint. (Damen, 2002, Mens, 2006). Therefore, the features related to pelvic ali- gnment of each individual are used as input to the model. In particular, we measured five types of alignment features that have been reported to change with pelvic clamping force: sacral tilt angle θST, pelvic tilt angle θPT, inclina- tion angle of the sacrum to the pelvis (PI angle) θPI, lumbar curvature CL, and pelvic opening angle θPA (Klima, 2018, Laouissat et al., 2018, Pierre and JL, 2011, Sichting et al., 2014). The sacral tilt angle θST, pelvic tilt angle θPT, and PI angle θPI were measured in two positions: standing and 45 degree forw- ard bending. The curvature of the lumbar spine CL and the pelvic opening angle θPA were measured only in the upright position, because they could not be measured in the images of the forward bending position. Therefore, the eight measured alignment features are: sacral posture angle θS
ST in the stan- ding position, sacral posture angle θB
ST in the forward bending position, pelvic posture angle θS
PT in the standing position, pelvic posture angle θB
PT in the forward bending position, PI angle θS
PI in the standing position, PI angle θB PI in the forward bending position, lumbar curvature CL in the standing posi- tion, and pelvic opening angle θPA in the standing position. These alignment features were measured from radiographic images (yoshida 2020).
Another factor is the effect of individual differences in body physique. For example, the larger the size and mass of each body part, i.e., the taller
Modeling of Changes in Lumbar Joint Stiffness by Pelvic Tightening 209
the person and the higher the weight, the greater the tightening force requi- red to obtain the same assistive effect, and the more difficult it is to obtain the assistive effect. In people with a high BMI (body mass index), the force transmitted from the pelvic belt to the pelvic skeleton is distributed by the subcutaneous fat, and alignment changes are difficult to occur. In addition, when the back muscle strength is large, the ability to support the upper body on one’s own is high, and there is little room for postural correction by the pelvic belt, so there is concern about the effect on the assistive effect. There- fore, in addition to the pelvic alignment features, the four physical features of height, weight, BMI, and back muscle strength are candidates for input to the model.
Model Formulation We select the features to be adopted as input to the model from eight ali- gnment features and four physical features. 15 subjects participated in the measurement of alignment and estimation of joint stiffness, but the variables need to be reduced because there are 12 redundant explanatory variables for 15 sample points. First, we exclude the 12 explanatory variables that are correlated with each other. In the three combinations of pelvic tilt angle θS
PT in the standing and PI angle θS
PI in the standing, sacral tilt angle θB
ST in the forward bending and pelvic tilt angle θB
PT in the forward bending, and body weight and BMI, where the correlation coefficients between the varia- bles were greater than 0.8, one of the variables with less ability to explain the objective variable was excluded. Correlation coefficients between each expla- natory variable and the objective variable were calculated, and by removing those with small absolute values of the correlation coefficients, the PI angle θS
PI in the standing, the pelvic tilt angle θB
PT in the forward bending, and BMI were excluded. Next, among the remaining nine variables, those with a weak relationship with the target variable were eliminated. By eliminating those variables whose absolute value of correlation coefficient with the objective variable was below 0.4, the input to the model was reduced to three or four variables.
Using the features selected by the above method, the linear multiple regres- sion model shown in Eq. (3) is used to express the change in the joint stiffness ratio, 1R, due to pelvic tightening, which is an index of the assistance effect.
Equation reproduced from the original PDF.
1R : Amount of change in stiffness ratio due to pelvic tightening xn : Pelvic alignment and physical characteristics
RESULTS
The results of the regression analysis conducted to determine the coeffici- ents αn for each %MFB are shown in Table 1. Table 1 shows the multiple regression coefficients, the number of data points, and the p-values when the statistical tests of the regression models were performed. Table 2 shows the three or four features adopted as explanatory variables in each %MFB, and the contribution of each feature in the regression analysis. In Table 2, θB PI
Table 1. Result of the multiple correlation analysis.
Table 3. Regression coefficient value for each explanatory variable.
Table available in the original PDF paper.
represents PI angle in forward bending, θB
ST represents sacral tilt angle in forw- ard bending, θS
PT represents pelvic tilt angle in standing, w represents body weight, and h represents height. In addition, the values of the coefficients αn obtained in this case are shown in Table 3.
Table 1 shows that the correlation coefficients of 80-100%MFB, 60- 80%MFB, and 40-60%MFB allow us to develop a statistically significant model for estimating the assistance effect with a certain level of accuracy from the selected features. On the other hand, for 20-40% MFB, which is a relatively standing posture, the correlation coefficient was 0.02, and the model in Eq. (3) could not represent the assistance effect. However, in our previous study, we showed that lumbar assistance by pelvic tightening force during upper body extension maintained the postural correction effect even in the subsequent mild forward bending position if the joint stiffness ratio R increased in the deep forward bending position of 80-100%MFB (yoshida, 2021). In other words, if the stiffness ratio change 1R can be expressed in the deep forward bending position, it is sufficient for estimating the assistive effect in the entire upper body extension movement. Therefore, the purpose of this study, which was to develop a model to estimate the change in stiffness
Modeling of Changes in Lumbar Joint Stiffness by Pelvic Tightening 211
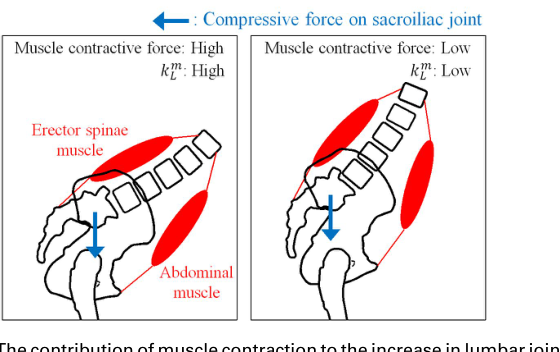
Figure 4: The contribution of muscle contraction to the increase in lumbar joint stiffness depends on posture. (a) Deep forward bending. (b) Shallow forward bending ratio 1R due to tightening from the features related to pelvic alignment and physique, was achieved.
DISCUSSION
Based on the selected features and the values of the regression coefficients, we consider which physical characteristics of the subjects are expected to have a higher assistive effect. In this section, the range of 40-100%MFB, where the model is applicable, will be discussed. First, in the 80-100%MFB range, the contribution of the PI angle θB
PI in the forward bending position and the pelvic tilt angle θS
PT in the standing position is particularly high. The values of the regression coefficients indicate that the sacrum is more anteri- orly tilted in relation to the pelvis, and the more anteriorly tilted the pelvis is, the higher the assistive effect can be expected. Referring to the skeletal shape of the lumbar region in Figure 1, those with these characteristics have a pelvic alignment with the lower part of the sacrum projecting more poste- riorly. Therefore, the pelvic belt could easily transmit the compression force to the sacrum, and there was a large room for the sacrum to change its ali- gnment to tilt forward, which would have a large effect on the joint stiffness. Next, the contribution of body weight and pelvic tilt angle θS
PT in the standing position was high in 60-80%MFB, and the higher the body weight and the more anteriorly tilted the pelvis, the higher the assisting effect. The contribu- tion of sacral tilt angle θB
PT and body weight in the forward bending position was high in 40-60%MFB, and the higher the body weight and the more the sacrum was tilted forward, the higher the assistance effect was expected. As with 80-100%MFB, the stiffness ratio change 1R tended to increase as the sacrum tilted forward, but the effect of body weight also appeared as the value of %MFB decreased. This is discussed using Figure 4. For the sake of discussion, we decompose the stiffness value kL of the lumbar joint into passive resistance kF
L due to friction at the sacroiliac joint and active resista- nce kM
L caused by co-contraction of the back and abdominal muscle groups.
Thereby, the lumbar joint stiffness kL can be expressed as the sum of kF
L and kM
L as in Eq. (4).
kL = kF
L (3)
L + kM
Since the sacroiliac joint receives the mass of the upper body through the sacrum, the kF
L derived from the friction of the joint surface increases or decre- ases under the influence of body weight. On the other hand, kM
L depends on the degree of contraction of the back and abdominal muscle groups and is therefore affected by the depth of forward bending. When the value of %MFB is high, the contractility of the back and abdominal muscle groups is strong, and the contribution of kF
L is low because the value of kM
L increases, but when the value of %MFB decreases, kM
L decreases and the ratio of kF
L increases. Therefore, the effect of body weight was considered to be relatively strong in the small %MFB region.
CONCLUSION
In this study, we developed a model to represent changes in joint stiffness due to tightening force in order to estimate the assistive effect from the phy- sical characteristics of each individual and to identify the factors that cause individual differences in the assistive effect. We were able to develop a mul- tiple regression model with a certain estimation performance by inputting variables that have a relatively strong relationship with the objective variable into the model from the pelvic alignment obtained from X-ray image measu- rements characteristics and physique characteristics of each individual. The regression coefficients showed that a high assistive effect was obtained in those with pelvic alignment characteristics such as anterior tilt of the sacrum and pelvis and anterior tilt of the sacrum relative to the pelvis. In addition, body weight affected the assisting effect in mild forward bending, which was thought to be due to the change in the contribution of body weight to stiffness caused by the change in the stiffness value of the co-contraction of the back and abdominal muscle groups depending on the posture angle. In the future, in order to put the model proposed in this study into practical use, we will devise a method for simple measurement or substitution of pelvic alignment features measured by radiography.
ACKNOWLEDGMENT
The research was supported by JSPS KAKENHI grant numbers 20J20632 and 19K20744.
REFERENCES
Bartelink L. D., (1957). D.L.Bartelink, The role of abdominal pressure in relieving the pressure on the lumbar intervertebral discs, the journal of bone and joint surgery , volume 39 b, no. 4. Damen Léonie, et al., (2002). Does a pelvic belt influence sacroiliac joint laxity?,
Clinical Biomechanics, Volume 17, Issue 7, pp. 495–498.
Modeling of Changes in Lumbar Joint Stiffness by Pelvic Tightening 213
OH Jae-Seop (2004). Effects of Pelvic Belt on Hip Extensor Muscle EMG Activity during Prone Hip Extension in Females with Chronic Low Back Pain, Journal of Physical Therapy Science, Volume 26, No. 7, pp. 1023–1024. Klima Stefan, et al. (2018). Pelvic orthosis effects on posterior pelvis kinematics An
in-vitro biomechanical study, Sci_Rep, Article number: 15980, pp. 1–10. Laouissat Féthi, et al. (2018), Classification of normal sagittal spine alignment: refounding the Roussouly classification, European Spine Journal, pp. 2002–2011. Lee Yung-Hui, Chen Chih-Yong (2000). Belt effects on lumbar sagittal angles,
Clinical Biomechanics, Volume 15, pp. 790–820. Mens M.A. Jan, et al. (2006). The mechanical effect of a pelvic belt in patients with pregnancy-related pelvic pain, Clinical Biomechanics, Volume 21, Issue 2, pp. 122–127. Pierre Roussouly and JL Pinheiro-Franco (2011). Biomechanical analysis of the
spino-pelvic organization and adaptation in pathology, European Spine Journal, pp. s609-s618. Sichting Freddy, et al. (2014). Pelvic Belt Effects on Sacroiliac Joint Ligaments: A Computational Approach to Understand Therapeutic Effects of Pelvic Belts, Pain Physician, Volume 17, pp. 43–51. Vleeming Andry, et al., (1992). An integrated therapy for peripartum pelvic insta-
bility: A study of the biomechanical effects of pelvic belts, American Journal of Obstetrics and Gynecology, Volume 166, Issue 4, pp. 1243–1247. Yoshida Michihiro, et al. (2018). Reducing Lumbar Load with Active Corset, Journal of Robotics and Mechatronics, Volume 30, No. 5, pp. 740-751. Yoshida Michihiro, et al. (2019). Effect of Dynamic Tightening Force by Active
Corset on Joint Stiffness and Lumbar Assisting, Transactions of the Society of Instrument and Control Engineers, Volume 55, No. 11, pp. 683–691. Yoshida Michihiro, et al. (2020). Modeling the Joint Stiffness Change by Pelvic Tightening Based on Alignment of Lumbar and Pelvis, Advances in Physical, Social & Occupational Ergonomics. AHFE 2020. Advances in Intelligent Systems and Computing, vol 1215. Springer. Yoshida Michihiro, et al. (2021). Improvement of the lumbar burden reduction, and
influence on lumbar joint stiffness by the personalized variable tightening force control of Active Corset, Transactions of the Society of Instrument and Control Engineers, Volume 57, No. 12, pp. 533–541.
LISTED IN THE AHFE DIGITAL BOOKSTORE CATALOGUE
Explore the complete digital volume
Physical Ergonomics and Human Factors
Read this individual research paper free through the original publisher, or explore the full digital proceedings book.
ISBN 978-1-958651-39-1
Explore this ISBN in the AHFE Bookstore ↗Listed in the July 2026 bookstore catalogue; search by ISBN to confirm current availability · Digital book purchase optional