Eduardo Pinos, Mateo Valverde, Ismael Narvaez (2022). Electronic prototype for the acquisition, processing and visualization of cardiac signals. In: Applied Human Factors Research. AHFE Open Access, vol. 67, pp. 122–129. https://doi.org/10.54941/ahfe1002690
Nowadays, one of the most prominent medical problems are cardiac pathologies, and because of this, the instruments created to study the heart are of great importance. Nowadays, with the advance of technology, it is desired that these instruments are simpler to use, smaller, have more features and obtain the best quality of biomedical signals.This article describes the analysis and processing of heart signals, obtained through an accessible electronic prototype that allows generating a presumptive diagnosis of cardiac signals, such as arrhythmias and heart murmurs. The detection of a valvular lesion would help in the identification of abnormalities in the cardiac period. During the experimental phase of this proposal, the sensitivity and specificity results suggest a low-cost option, which makes it accessible as a presumptive diagnostic tool for the detection of valvular heart disease within the health area, especially in times of pandemic by COVID-19 in the city of Cuenca. Cardiac auscultation is important for the prevention of heart diseases; therefore, the contribution of this prototype is intended to be a support tool for the specialist in heart diseases.
In recent years, a field of research of great interest has been the acquisition and analysis of electrocardiographic signals and identification of pathological and abnormal events within ECG recordings. Many of these studies are based on the use of databases with pre-acquired signals such as those from MIT, available on the PHYSIONET website. Some research work is focused on the development of computational systems to analyze these bio signals (Rami- rez, 2009). Others focus on developing algorithms to identify pathologies related to electrocardiographic signals. (Dubin, 2011). These investigations have established methodologies for both the acquisition and analysis of ECG signals, providing applications such as: segmenting and identifying beats, fil- tering bio signals, among others, but all this within the limitations that use
Electronic Prototype for the Acquisition, Processing, and Visualization of Cardiac Signals 123
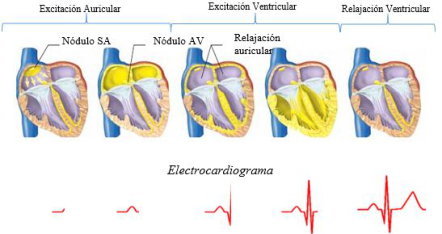
Figure 1: Propagation of the electrical activity of the heart with its respective ECG signal. (Barret et al., 2013).
existing databases, belonging to patients from other regions, with different build, size and weight to that of our region.
The main objective of this project is to develop a prototype capable of capturing ECG signals by means of an integrated circuit ADAS1000, which is low cost and low power consumption, and then transmit the data to a mobile device and a Windows application and plot each of the derivations that the ADAS1000 allows us in its configuration. Subsequently, in future lines, we intend to improve the filtering and acquisition stage to capture high quality signals. These signals can be acquired directly from normal patients or those who present some type of cardiac pathology, to carry out studies for the development of tools that support and facilitate the early detection of cardiac anomalies.
THEORETICAL BASIS Electrocardiogram
The heart can produce an action potential in the various myocardial fibers. The algebraic sum of each action potential is represented by the ECG (ele- ctrocardiogram). Fig. 1 shows the conduction system of the heart and the cardiac signal corresponding to each stage. (Dubin, 2011).
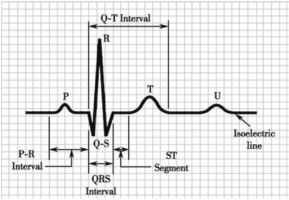
An electrocardiogram is the graphic representation of the electrical acti- vity of the heart, generally to be displayed on a millimeter paper, where the vertical axis is the amplitude of the electrical pulse in millivolts [mV] each millimeter is 0.1 mV, while the horizontal axis represents the elap- sed time in seconds [s] each millimeter without 0.04 seconds. (My EKG, 2013). The ECG is made up of waves that have been named P, Q, R, S, T, U, joined by an isoelectric line, as shown in Figure 2 The P wave has an average duration of less than 0.10 s and a maximum voltage of 0.25 mV. The Q wave lasts approximately 0.04 s in width and 0.2 mV in amplitude. The QRS complex has a duration of approximately 0.06 s to 0.1 s. The T wave has a maximum amplitude of 0.5 mV. The U wave is not very visible and of low importance in ECGs.
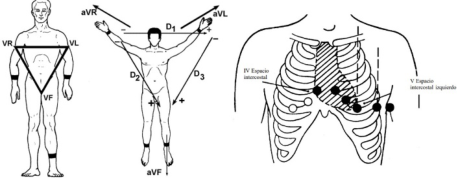
Figure 2: Ondas P, Q, R, S, T y U dentro de un ECG (Barret et al., 2013).Figure 3: (a) Standard leads (García, 2017). (b) Augmented leads (García, 2017). (c) Precordial leads (García, 2017).
Cardiac Leads Depending on the location of the electrodes, different projections of the car- diographic vector (vectocardiogram1) can be captured. They can be classified into 3 groups: three standard leads Figure 3 (a) (I, II, III), three augmented leads Figure 3 (b) (aVR, aVL, aVF) and six precordial leads Figure 3 (c) (V1, V2, V3, V4, V5, V6). (García, 2017).
PROTOTYPE DESIGN Structure of the ADAS1000
This integrated circuit is designed to simplify the acquisition of bio- medical signals, specifically electrocardiographic signals and respira- tion signals through surface electrodes. It operates at a frequency of 8,192MHz provided by an external oscillator connected to the respective pins.
Analog Devices proposes an example of connection to be followed for its correct operation (Analog Devices, 2013).
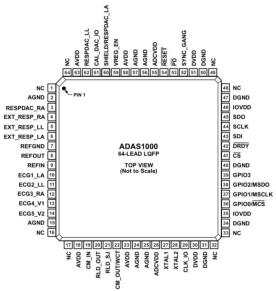
The input structure of the ADAS1000 is a differential amplifier, allow- ing users to choose from a variety of configuration options to best suit their application. It also has 5 analog inputs (connection of the LA, LL, RA, V1, V2 electrodes) used for biosignal acquisition, plus 6 inputs to measure respiration rate, and finally a reference unit. (RLD).
Electronic Prototype for the Acquisition, Processing, and Visualization of Cardiac Signals 125
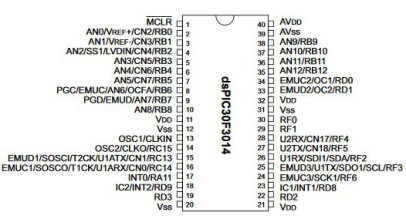
Figure 4: ADAS1000 pin layout (Analog Devices, 2013).Figure 5: Pin layout of the dspic30F4013 (Microchip, 2012).
Structure of the DSPIC30F4013 It is a digital signal controller working at 16 bits, suitable for various general purpose and audio applications, with a 48 Kb program memory, a 12- bit analog-to-digital converter and communications: I2C, SPI, CAN and 2 UARTs. This device was chosen for the prototype due to its ease of use in programming and communication with different peripherals. (Microchip, 2012).
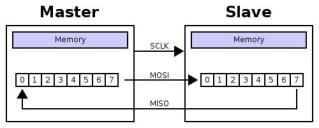
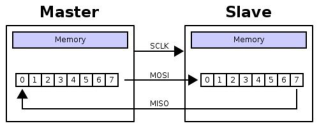
SPI Communication Protocol SPI is an acronym for Serial Peripherical Interface (SPI). SPI is a synchronous protocol that works in full duplex mode to receive and transmit informa- tion, allowing two devices to communicate with each other at the same time using different channels or different lines on the same cable. Being a synch- ronous protocol, the system has an additional line to the data line in charge of carrying out the synchronism process.
In the case of this prototype, the ADAS1000 device would act as the slave, while the microcontroller would act as the master.
UART Communication Protocol Universal Asynchronous Receiver and Transmitter, the communication mode for a serial port refers to the way in which information packets are sent and received. (Microchip, 2012).
Figure 6: General structure of the SPI protocol (Microchip, 2012).Figure 7: Frame for sending data via 8-bit UART communication.Table 1. Sending a frame.
Table available in the original PDF paper.
Bits 31 30:24 23:0 Function Read or write bit Address bits Data bits (MSB first)
According to the type of connection, a UART has separate transmission and reception lines. This feature allows it to operate the three asynch- ronous communication modes that exist. The communication modes are: Full-duplex, Half-duplex, Simplex. The latter is the communication mode used for data transmission from the microcontroller to the PC or Android device.
FIRMWARE Communication Between DSPIC and ADAS1000
The communication between DSPIC and ADAS1000 will be done through SPI,being the DSPIC the master and the ADAS1000 the slave. The ADAS1000 is controlled by 32-bit registers. Since the DSPIC30F4013 has an 8-bit SPI, a communication protocol was established between these two devices that consists of sending 4 8-bit words for each instruction.
The frame accepted by the ADAS1000 is as follows: In the protocol designed for this prototype the communication is done in the following way:
1. 8 bits are sent [31:24] indicating whether the instruction will be a read/write instruction and the register address. 2. The data bits [23:0] are sent, dividing them into 3 packets of 8 bits.
The ADAS1000 has several registers to be configured in many ways, for this project only the following registers will be used: CMREFCTL, FRMCTL, ECGCTL and FRAMES.
CMREFCTL: configures the common mode and reference.
Electronic Prototype for the Acquisition, Processing, and Visualization of Cardiac Signals 127
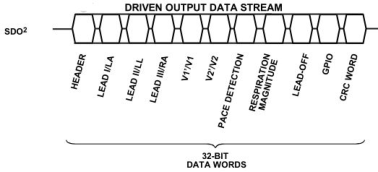
Figure 8: Output frame from ADAS to DSPIC (Microchip, 2012).Table 2. Modified frame.
Table available in the original PDF paper.
Header LA LL RA V1 V2 PACE
FRMCTL: configures and controls the data header. ECGCTL: controls the ECG. FRAMES: register to start transmitting.
For this prototype the ADAS will be configured as follows: – 5 electrodes – Gain of x1.4 – Common mode with all electrodes
The output frame from the ADAS1000 is as follows: Esta trama fue modificada al configurar el registro FRMCTL de esta forma se reduce a la siguiente tabla: Thus, the data frame has 7 words and each word has a dimension of 32 bits.
Communication Between DSPIC and PC Each word sent by the ADAS1000 to the microcontroller is 32 bits in size, therefore, each data will be stored in 4 variables of 8 bits to be sent by UART communication to the PC or a SMARTHPHONE.
In this way, to send a complete frame it is necessary to make 4 UART transmissions. It is necessary to implement an identifier and send the data in the correct order, so that when the data is received by the PC, it can be treated and handled in the correct way. In our case, the identifiers are the letters A to E for each lead and the letter F for the cardiac pulse. On the PC we must interpret these data in the correct order in order to be able to plot them.
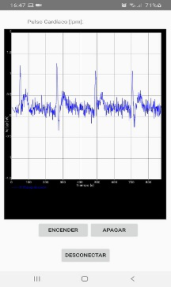
Communication Between DSPIC and SMARTPHONE For the communication between the dsPIC and an Android cell phone we will use the BLUETOOTH communication protocol, for this we used a Bluetooth HC-05 module and developed an APP in Android Studio for the visualization of the cardiac signal. To receive the data in the Android device, a scan of the available devices is performed, once this is done, we proceed with the pairing, it will only ask for a password the first time it is connected. Once the
Figure 9: Cardiac signal display in the mobile application.
pairing process is completed, the service begins to receive the signal sent by the Bluetooth module.
The A Chart Engine (ACE) library was used for the real-time charting, since it has several advantages over other libraries, one of which is its ease of use and compatibility with Bluetooth.
CONCLUSION
The design was based on the integrated circuit from Analog Devices, the ADAS1000, an integrated circuit that functions as the first phase in the acquisition of cardiac signals. The circuit, electrical diagrams and other com- ponents were designed for the development of this prototype. Likewise, a PCB board was designed with the recommendations and specifications establi- shed by the manufacturer. Also, a firmware was created to allow the control and configuration of the ADAS from a dsPIC30F4013. A case was develo- ped to facilitate the handling and use of the prototype. Finally, due to the limitations caused by the COVID-19 virus pandemic, tests were not perfor- med on different patients, but were carried out among the writers of this article.
We have succeeded in developing a device capable of capturing cardiac signals in real time, which can be sent wired and wirelessly to end devices for display. The device is small and low power consumption compared to those available on the market. However, when observing the signals obtai- ned and comparing them with other similar devices, it is concluded that these signals are of low quality, provide little information and present high levels of noise. The configuration of the ADAS1000 integrated circuit is highly complex because the existing documentation is deficient and generalized, the manufacturer provides a data sheet and connection diagrams, but recom- mends acquiring its evaluation board (EVALUATION BOARD ADAS1000), rather than programming and configuring from scratch as it was done in this project; not to mention that there is little information in discussion forums on the Internet.
Although the signals obtained are not of sufficient quality to be studied by the clinical field, since they should overcome a series of regulations and
Electronic Prototype for the Acquisition, Processing, and Visualization of Cardiac Signals 129
requirements more detailed than those mentioned in this project; the pro- totype could be of great utility within the research group of the university, so that in future works a filter or circuit can be developed to clarify the signal.
REFERENCES
Analog Devices. (2013). Low Power, Five Electrode Electrocardiogram (ECG) Analog Front End. Datasheet ADAS100 - ADAS1001 - ADAS1002. https://www.analog.com/en/products/adas1000.html?doc=ADAS1000_1000- 1_1000-2.pdf#product-overview Barret, K., Barman, S., Boitano, S., & Brooks, H. (2013). Ganong. Fisiología médica
(N. E. Fernandez, J. L. Alvarado, E. Patiño, V. Sedeño, R. F. Torralva, O. Morales, F. Chávez, & E. R. Fajardo (eds.); 24th ed.). Dubin, D. (2011). Dubin: Interpretación de ECG (COVER Publishing Company (ed.); 1st ed.). García, A. E. (2017). Análisis y procesamiento de la señal auscultada del corazón
para el diagnóstico presuntivo de soplos cardíacos y arritmia cardíaca. Microchip. (2012). Data Sheet dsPIC30F4013. In (Vol. 31402, Issue September 2004). http://ww1.microchip.com/downloads/en/devicedoc/ 70138e.pdf My EKG. (2013). My EKG la web del electrocardiograma. https://www.my-ekg.com /index.html Ramirez, J. (2009). Potencial de Acción Cardíaco. 7. http://paginas.facmed.unam.mx
Read this individual research paper free through the original publisher, or explore the full digital proceedings book.
ISBN 978-1-958651-43-8
Explore this ISBN in the AHFE Bookstore ↗Listed in the July 2026 bookstore catalogue; search by ISBN to confirm current availability · Digital book purchase optional