Victoria Marcinkiewicz, Qiyuan Zhang, Phillip Morgan (2023). The Effects of Cyber Readiness and Response on Human Trust in Self Driving Cars. In: Human Factors in Cybersecurity. AHFE Open Access, vol. 91, pp. 50–60. https://doi.org/10.54941/ahfe1003719
Centre for AI, Robotics and Human-Machine Systems (IROHMS); Human Factors Excellence Research Group (HuFEx); School of Psychology, Cardiff University, 70 Park Place, Cardiff, CF10 3AT, UK ↗
Self driving cars (SDC) are potentially set to revolutionise the automotive industry. Despite the promise of a plethora of purported benefits (e.g. fewer road traffic accidents, better traffic flow; lower emissions), one key concern relates to the potential for SDCs and their connected infrastructure to be cyber attacked. Aside from material losses, an adverse cyber experience is likely to undermine human trust – with trust being a key contributing factor to the uptake and use of automated technology such as SDCs.Many studies have projected the different types of cyber attacks an SDC could fall victim to [1]. Concerns about the consequences of cyber attacks for e.g. users, other road users, manufacturers, legislators, legal experts, and governments have also been raised. Procedural and technical solutions have been proposed to tackle the SDC-cyber security challenge, which includes the proposition of rankings for SDCs GPS system vulnerabilities [2].Nonetheless, it is inevitable that threat actors will compromise an SDC system(s) through either exploited vulnerabilities and/or user error. It is crucial that such an event(s) does not erode trust (e.g. leading to misuse or even disuse) if the long-term benefits of this technology are to be reaped. Therefore, the study explores whether the capability and obligation from a SDC company (who are most likely to be blamed when an attack happens) to manage a cyber attack – with regards to its readiness and response activities – impacts trust in SDC technology.Using a cutting-edge AV Simulation Driving Simulator and simulation software generated animations (SCANeR Studio) embedded into an online survey, participants watch a futuristic driving scenario where the SDC executes a variety of successful driving manoeuvres before the system falls victim to an unspecified cyber-attack. Self-reported trust is measured after each successful manoeuvre as well as following the cyber attack. The experiment follows a 3x2 – 6 condition design – manipulated between participants. In each condition, all participants are shown the same driving scenario. The independent variables (IVs) consist of the information given to the participant before and after watching the scenario: IV1 being the SDCs cyber readiness (low/medium/high) and IV2, the SDCs company’s response to the incident (positive/negative). Before watching the scenario, information about cars status (including its cyber readiness) is provided. After watching the scenario and experiencing the cyber attack, participants are provided with text detailing how the SDC company responded to the cyber attack. The key prediction is that a company with higher cyber maturity (i.e. has a high level of cyber readiness and responds positively to the incident) will be trusted more than a company/companies with lower cyber security considerations. Currently the experiment is in progress and findings and details on the implications will be presented in the paper. Future research will involve exploring the boundary conditions of the effects and extending to physiological as well as subjective measures of trust.References: [1] Phama, M. & Xiongb, K. (2021) A survey on security attacks and defense techniques for connected and autonomous vehicles, Computers & Security, 109(1), 1-29. https://doi.org/10.1016/j.cose.2021.102269[2] Sheehan, B., Murphy, F., Mullins, M., Ryan, C. (2019) Connected and autonomous vehicles: A cyber-risk classification framework. Transportation Research Part A: Policy and Practice. 124(1), 523-536. https://doi.org/10.1016/j.tra.2018.06.033The work is part of a PhD funded project by the EPSRC IDTH in Cyber Security Analytics. It is also part of an ESRC-JST (Economic & Social Research Council - Japan Science & Technology Agency) project grant reference: ES/T007079/1, Prof Morgan is UK PI : Rule of Law in the Age of AI: Principles of Distributive Liability for Multi-Agent Societies.
Cars that can drive themselves with little or no human interaction are potenti- ally set to revolutionise the automotive industry. The Society of Automotive Engineers defines six levels of automation with the highest being Level 5 - a car that can drive itself under all conditions with (arguably) no human intervention required. Increasingly in the UK, more cars have Level 2 capa- bilities (semi-automated systems working in tangent) and some have Level 3 (self-drive abilities some of the time without the need for human intera- ction), although the latter are not yet deemed legal on UK roads or in most other countries. Elsewhere around the world e.g. in Japan, news media outlets have reported that the government has approved the use of Level 4 cars in certain environments and under particular conditions (Leggett, 2022). This means that the car can drive itself under most conditions with minor human intervention required. Such developments both in the UK and around the
The Effects of Cyber Readiness and Response on Human Trust in Self Driving Cars 51
world are promising steps towards (potentially in the near future) the mass deployment of highly-autonomous Level 4 and 5 self-driving cars (SDCs).
Set to bring many benefits, it has been anticipated that SDCs will e.g. lead to fewer road traffic accidents, improve traffic flow, permit humans to undertake other activities whilst travelling by car (e.g. reading), have lower emissions (linked to greener powering solutions and perhaps more uptake of shared mobility options), and so on. However, there also are many challenges and concerns. One key concern potentially affecting the uptake and adoption of Levels 3–5 SDCs (especially Levels 4 and 5 due to limited human-machine interaction requirements) is the possibility for them and their connected infrastructure to be cyber attacked.
Across the connected vehicle automotive industry, cyber attacks are alre- ady becoming more prominent. For example, known vulnerabilities in car key fobs and electric vehicle (EV) charging points have been identified as two major vulnerabilities that threat actors can exploit and perpetrate a (car’s) network. A successful attack on e.g. charge points could allow threat actors to cause disruption, steal power, obtain driver information or even permit Denial of Service (DoS) type attacks, to name but a few potential major concerns (Kovacs, 2023).
With cars becoming increasingly connected, let alone autonomous, the number of potential entry points into their systems and networks is grow- ing. As a result, there is a real and major concern that cars could soon have greater susceptibility to more frequent and more sophisticated attacks that could even have serious and potentially catastrophic physical-world impli- cations. These concerns are further exacerbated in SDCs which are set to become even more connected (with estimates for the lines of code required as high as one-billion (Jaguar-Land Rover, 2019)).
Different types of cyber attack an SDC could incur have been projected (Phama and Xiong, 2021) as well as the potential consequences for e.g. users, other road users, manufacturers, legislators, legal experts, and governments. Regulations, guidelines and standards such as: UN R155 (UNECE, 2023a) and UN R156 (UNECE, 2023b), UNECE WP29 (UNECE, 2023c), ISO/SAE 21434:2021 (ISO, 2023a) and ISO 24089:2023 (ISO, 2023b) are being deve- loped and implemented to ensure best practice cyber security across SDCs. Technical solutions have also been proposed to tackle the SDC-cyber security challenge (e.g. advanced and hybrid intrusion detection systems).
Nonetheless, no matter the type and sophistication level of technical solu- tions to defend against cyber attack attempts, threat actors will strive to compromise an SDC system(s) through either exploited vulnerabilities and/or user error – e.g. preying on human cyber risk vulnerabilities to gain entry to the system(s). On this note, and to date, there has been very little focus on the psychological and human factors aspect of cyber attacks on SDCs. One such factor is trust – specifically in SDC technology. To reap the long-term and wide-reaching benefits of SDC technology, it is paramount that an adverse event such a cyber breach (or even attempted attack) does not erode trust. This could potentially inhibit the acceptance of the technology, adoption and local (country or even individual user specific) as well as wider-spread uptake
and usage. Such human factors concerns related to automation in general, albeit not then focused on cyber security, were stressed well over 25-years ago (Parasuraman and Riley, 1997). Doubts were first raised in the early 1980s when Bainbridge (1982) stressed some of the then unintended conse- quences or ironies of automation with a view that the disadvantages could in some cases outweigh potential benefits. Over 40-years on and with cyber security a major and growing concern, it is crucial to better understand the effects it can have on human experience with automated systems – such as SDCs – in order to more optimally design such systems with the human factor very much in mind.
The aim of the current experiment is to determine whether the capability of an SDC company to prevent an attack (i.e. level of cyber readiness) and remedial actions (i.e. type of response) impacts trust and blame in the event of a (for now, hypothetical) cyber attack. This paradigm assumes that the SDC company are ultimately responsible for the SDC, its hardware and software, and thus are most likely to have culpability attributed in the event of a cyber attack. It is hypothesised that: – A SDC company demonstrating a higher level of cyber readiness (pre attack) and a more positive, responsible and proactive response (post attack) will be trusted more than companies with less mature cyber security practices; – A SDC company will be blamed less for the cyber attack when they have demonstrated they have more mature cyber practices – i.e. a higher level of cyber security readiness and a positive, responsible and proactive response; – Trust in SDCs themselves will be higher when a SDC company demon- strates more mature cyber practices (through level of cyber readiness and type of response).
The Effects of Cyber Readiness and Response on Human Trust in Self Driving Cars 53
embedded into an online experiment. The SSGAs depicted a futuristic driving scenario where an SDC, known in this experiment as Vehicle X, executed a variety of successful driving manoeuvres before experiencing an unspecified cyber attack. The manoeuvres, known as Events, depicted Vehicle X driving autonomously behind a number of buses (one bus per Event). There were five Events in total. Each new Event was a continuation from the Event prior to it – i.e. the events constituted one scenario.
During Event 1 (E1) and Event 3 (E3), Vehicle X safely and successfully manoeuvred around a bus (overtook it with the indicator light on) which had stopped at a bus stop. In both E1 and E3, Vehicle X deemed it safe to over- take the bus due to low oncoming traffic density which allowed ample time to safely execute the manoeuvre with it being clearly visible that there were no oncoming vehicles or hazards in the opposite lane. In Event 2 (E2) and Event 4 (E4), Vehicle X gauged it would not be safe to manoeuvre around the bus (did not overtake it) due to the high density of oncoming traffic in the opposite lane and no clear or safe opportunity to execute the manoeuvre. Instead, Vehicle X came to a safe and controlled stop behind the bus and wai- ted until it pulled off and then continued to drive behind it until it stopped again where it could reassess traffic conditions. At all times, Vehicle X main- tained a safe distance behind the bus, obeyed the 30mph (48.28kph) speed limit and slowed down accordingly when the bus approached a bus stop.
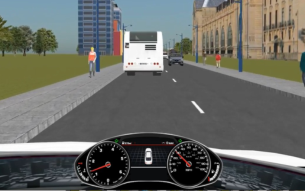
Participants were able to see Vehicle X responding to the environment with a full uninterrupted view out of the entire windscreen/shield. An animated dashboard was designed and programmed displaying e.g. a speedometer, rev counter, and other features (using icons) such as a fuel gauge and engine/sy- stem temperature (Figure 1a). The dashboard also responded accordingly to Events e.g. speedometer reduced in speed, rev counter reducing in revolutions when the bus slowed (E2/E4) and when Vehicle X overtook the bus (E1/E3).
During Event 5 (E5), Vehicle X experienced a cyber attack. To illustrate that Vehicle X had fallen victim to a cyber attack, the animated dashbo- ard began to malfunction in multiple ways: the speedometer and rev counter oscillated quickly displaying e.g. incorrect speed information (fluctuating between 0-100mph when Vehicle X was still travelling at 30-mph) and fur- ther icons relating to e.g. engine/system status, seatbelts, and so on (at all other times – set to the background) appeared within the centre of the display and flashed on and off in a rapid manner. An auditory warning, also with a
Figure 1: a (Left-Side) & b (Right-Side): Dashboard of vehicle X before/during a cyber attack.
rapid onset and offset, sounded multiple times to indicate unusual activity (Figure 1b). This was followed by an onscreen message – displayed at the end of the video – stating that the SDCs dashboard malfunctioned due to a cyber attack.
All participants experienced the same five sequence of Events. Howe- ver, the company’s level of cyber readiness (high/medium/low) and type of response (positive/negative) to the cyber attack varied between the conditi- ons. High, medium or low cyber readiness was manipulated using star-ratings (zero to five) - before watching the SSGAs, participants were provided with a ten-feature star-rating review of Vehicle X which included features such as comfort, environmental friendliness, safety, running costs and so on. Cyber was prescribed a star-rating of either 0.8 (low), 3.3 (medium) or 4.8 (high) out of 5 stars. Participants performed a series of short tasks to better ensure that they understood the star ratings. They were explicitly instructed that minimal legal requirements were met across all features irrespective of the star ratings – in other words, Vehicle X was legally allowed to operate on the roads even if it had a low star rating – i.e. the star ratings were opera- tionalized to indicate how well the company was performing (according to the star ratings, at least) above and beyond the minimum requirements with a 5 star rating indicating that the company could not be rated any higher. After watching all five SSGAs, participants were presented with four state- ments about how the company responded to the attack - either four positive statements or four negative statements (manipulated between participants).
Throughout the experiment, trust was measured via self-reported means using the Situational Trust Scale for Automated Driving (STS-AD) Holthau- sen et al. (2020). Rather than Likert scales, Visual Analogue Scales (VAS) using the recommended left and right end anchors “Fully Agree” to “Fully Disagree” were opted for as they offer greater granularity more suited for the design of the current experiment. Blame assignment for the cyber attack was measured at the end of the experiment with a series of statements (e.g. the company was most to blame for the cyber attack) that required moving a slider, again on a VAS, using the same left and right end anchors as above - ‘Fully Agree’ to ‘Fully Disagree’. By adopting this approach, blame data and trust data could be more easily compared.
DESIGN A 3x2 between participants design was employed. In each condition, partici- pants were shown five Events depicting Vehicle X navigating an environment on continuous journey. The two independent variables (IVs) consisted of the information given to the participant before and after watching the Events: IV1 being the SDCs cyber readiness (low/medium/high) based on star ratings (see Materials), and, IV2 being the SDCs company’s response to the attack after it had happened (positive/negative). This resulted in six between participants conditions:
– High Positive: high level of cyber readiness, positive response – Medium Positive: medium level of cyber readiness, positive response
The Effects of Cyber Readiness and Response on Human Trust in Self Driving Cars 55
– Low Positive: low level of cyber readiness, Positive response – High Negative: high level of cyber readiness, negative response – Medium Negative: medium level of cyber readiness, negative response – Low Negative: low level of cyber readiness, negative response Self-reported trust – using the adapted VAS response STS-AD – was mea- sured after each Event within the journey, as well as at the beginning (before having viewed any SSGAs) and end of the experiment (after having viewed all SSGAs).
Procedure At the outset, participants were provided with an online information sheet explaining the aims, requirements, anonymization of data process, and, their right to withdraw. They were not informed at this stage that the experiment had a cyber security element to it – to minimise expectation effects. Following this, participants were required to read and sign a consent form (by selecting the box stating that they freely gave their consent to taking part). Having consented, participants were asked to generate a memorable code to be used in the event should they wish to have their data withdrawn, which was pos- sible from up to 10-working days from having taken part in the experiment. A short preliminary questionnaire consisting of tick-box style questions on demographics (e.g. age, gender, driving experience) and visual analogue scale (VAS) style questions on existing levels of trust in SDCs followed, and for each -prefer not to say options were available.
The main experimental phase began with participants having to initially familiarize themselves with a 5-star rating criteria and were then presented with six VAS-scale-based questions about what extent reviews influenced their decisions. Next participants assigned personal preference star-ratings to ten features of an SDC (e.g. safety, comfort, cyber). Then there was a require- ment to read, feature by feature, the (star-rating) review of Vehicle X. Next, participants watched five Events (E1-E5) involving Vehicle X, with E5 invo- lving the critical cyber attack incident. In between each Event, participants were asked to rate to what extent they agreed with seven short statements - six from the STS-AD about Vehicle X and one about the company - which were focussed on the Event they had just watched. After the final Event that ended with the dashboard features flashing and/or moving in a rapid and unusual manner plus the sounding of an auditory alert, participants were informed of the cyber attack and were presented with information about how the SDC company responsible for Vehicle X responded to the cyber attack (positively or negatively – depending on condition). This was followed with VAS-style questions on blame assignment and post trust in SDCs. Finally, a debrief form was provided detailing the aims of the experiment and also contained links to further information about SDCs and cyber security articles.
Results and Discussion
Sixty participants took part in the current experiment representing an initial dataset. Six datasets were not usable either due to being incomplete across multiple measures (e.g. participants not making sufficient responses) and / or
because of a failure to correctly answer attention check questions. Therefore, there were 54 usable datasets. Descriptive statistics will be presented and discussed, based on the N = 54, although where possible early inferential statistics will be included.
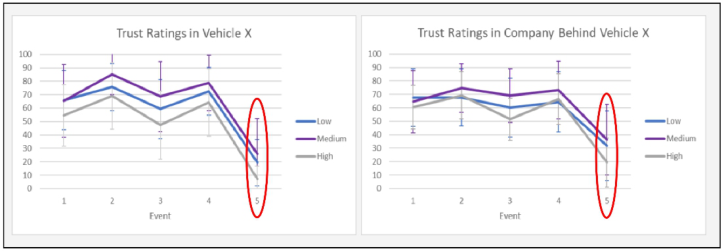
The current experiment was designed to explore whether a SDC company’s level of cyber readiness (high, medium and low) and type of response (posi- tive/negative) impacts trust and blame following a cyber attack on a SDC. Figure 2 illustrates mean trust ratings in the company behind Vehicle X and in Vehicle X itself immediately after each Event has occurred. After a cyber attack (E5) – and before receiving information about the company’s response, there was a steep decline in trust in both the company behind Vehicle X and Vehicle X itself (Figure 2).
At this stage, participants had not been told how the company responded to the attack – i.e. they had only received information about cyber readi- ness and then experienced E1-E5. Figure 2 illustrates that differences in trust ratings exist. Whilst the experiment is currently underpowered, a one-way analysis of variance (ANOVA) test of trust ratings between the levels of cyber readiness in the company behind Vehicle X gives an indication that trust does not differ due to the level of readiness, F(2, 51) = 2.32, p = 0.19. However, a one-way ANOVA test of trust ratings between the levels of cyber readiness in Vehicle X itself indicates that trust is affected by the level of cyber readiness, F(2, 51) = 4.26, p = 0.02.
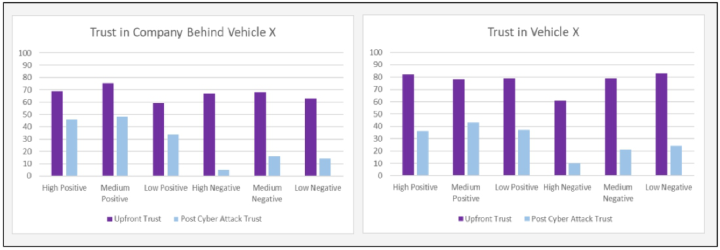
Trust was also measured before E1-E5 were experienced and after - when the company response was also known. Figure 3 illustrates mean upfront and post cyber attack trust ratings in the company behind Vehicle X and in Vehicle X itself.
A two-way ANOVA test in the company behind Vehicle X pre- and post- cyber attack gives an early indication that trust does not differ due to the level of preparedness, F(2, 48) = 0.83, p = 0.44, but, the type of company response, F(1, 48) = 30.01, p =.01 is significant even with a dataset of 54 par- ticipants. That is, a positive company response results in higher trust ratings in the company behind Vehicle X than a negative response. The interaction (p = 0.32) was not significant. A two-way ANOVA test of trust ratings in Vehicle X provides a similar pattern of results: the level of preparedness,
Figure 2: Trust in the company behind vehicle x (left-side) and vehicle x (right-side) after each event. Note: Trust measured using VAS: range 0-100.
The Effects of Cyber Readiness and Response on Human Trust in Self Driving Cars 57
Figure 3: Trust in the company behind vehicle X (left-side) and Vehicle X (right-side) after each event. Note: Trust measured using VAS: range 0-100.
F(2, 48) = 1.01, p = 0.37 is not significant but the type of response F(1, 48) = 10.19, p <.01 is significant. That is, a positive response results in a higher trust rating in Vehicle X (an SDC) than a negative response, again with 54 participants. The interaction (p = 0.59) was not significant. To determine whether a relationship exists between trust in the SDC company (behind Veh- icle X) and trust in the SDC itself (Vehicle X), a correlational analysis will be carried out when the experiment has more power – with a larger sample.
The largest observed difference in trust post cyber attack exists between the conditions ‘Medium-Positive’ and ‘High-Negative’. Independent sam- ples t-tests including these two conditions indicated significant differences in ratings for both trust in Vehicle X (Ms 9.9 vs 43.0), t(16) = −2.81, p = 0.01 CI [−58.103, −8.119] and trust in the company (Ms 5.3 vs 48.2), t(16) = −4.189, p = 0.001, CI [−64.594, −21.184]. Based on the hypothe- ses however, it was expected that the largest difference would exist between the two most extreme conditions ‘Low-Negative’ (least cyber mature) and ‘High-Positive’ (most cyber mature). An independent samples t-test was conducted to compare these conditions. Interestingly, overall trust in Veh- icle X itself did not differ (Ms 36.0 vs 23.7), t(16) = 0.95, p = 0.36, CI [−15.259, 39.926] but trust in the company behind Vehicle X did differ, (Ms 45.7 vs 14.1), t(16) = 3.92, p = 0.001, CI [14.474, 48.637]. As a cauti- onary note, a higher powered dataset is needed before firm conclusions can be drawn.
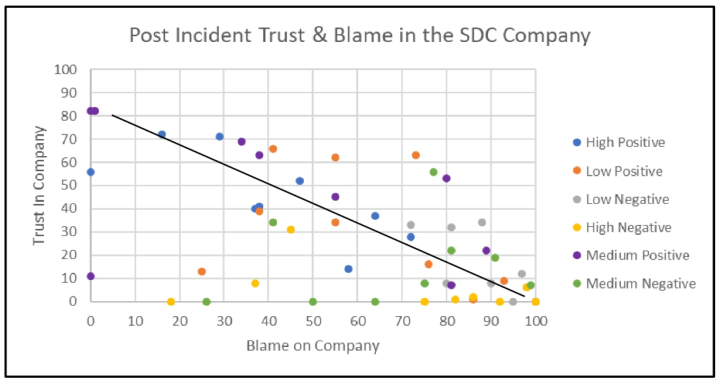
In addition to understanding whether trust in SDCs can be affected by a company’s level of cyber readiness and type of response, the experiment was also designed to investigate possible relationships between trust and blame. Figure 4 provides an indication of a negative relationship between trust and blame for SDC companies who are ultimately responsible for the SDC. As blame on the SDC company increases, trust in the company decreases.
Interestingly, clusters for different conditions are beginning to appear - e.g. there are more blue/purple clusters towards the left-side of the scatterplot where trust in the SDC company is higher and blame is lower. The blue/purple clusters relate to conditions with more mature cyber security practices (High- Positive) and (Medium-Positive) i.e. when the company are better prepared and offer a more positive, responsible and proactive response. Towards the
Figure 4: Trust in the Company versus blame on the company. Note: Trust and blame measured using VAS: range 0-100.
right-side of the scatterplot, there are no indications of any emerging patterns - further data points are required in all cases to draw firm conclusions.
CONCLUSION
The current findings based on an entirely novel experiment give an indication that an SDCs company’s level of preparedness and type of response to a cyber attack are in some cases impacting trust in SDC technology and in other cases likely to have an impact (e.g. with a higher powered sample). That is, trust is likely to be greater in SDCs and the respective SDC company when more mature cyber security practices have been adopted with some findings already significant such as the response type. These conclusions are tentative for now, with a higher powered experiment needed – which is work in progress.
There are many reasons for implementing mature cyber security practi- ces for SDC technology (in terms of preparedness and response) including meeting regulatory compliance activities, mitigating against financial loss (fines/downtime), reputational damage, loss of information, and so on that could arise from a successful cyber attack. Whilst it has been acknowledged that further data needs to be collected to improve statistical power within the current experiment, mature cyber security practices upheld by an SDC company appear to effect human trust in SDCs. Trust is a key factor in the uptake, adoption and continued use of SDCs and therefore addressing the human dimensions potentially linked to cyber security preparedness and response activities is paramount in order for such technology to gain even more traction and very importantly - to be widely adopted by end-users.
LIMITATIONS AND FUTURE DIRECTIONS Whilst the current findings provide an indication that the level of cyber secu- rity maturity impacts human trust in SDCs, a larger sample - to detect a
The Effects of Cyber Readiness and Response on Human Trust in Self Driving Cars 59
medium effect size (f = .25) with power of 0.8 (Cohen, 1988), a dataset consisting of 163 participants - would be required in order to draw firmer conclusions. The experiment was conducted online – to limit the effects of convenience sampling and to eliminate possible experimenter effects. How- ever, it was not possible to fully verify the quality of trust ratings nor was it possible to identify whether e.g. some participants were distracted when taking part or the extent that they were fully engaged throughout the entire experiment. Replicating the experiment in person within a driving simula- tor would likely bring benefits. For example, participants would have the experience of being driven autonomously (albeit in a simulator), it would also be possible to gather physiological measures that arguably relate to trust (such as eye-tracking data – fixations, saccades, pupil dilation, and so on), and the experimenter(s) would have better control over potential confounds such as background distractions and ensuring participants fully understood instructions. Taking the eye tracking data as an example, this would be particularly useful to gain an insight into where participants focus (e.g. at perceptual, attentional or deeper processing levels), and the time spent loo- king at various elements e.g. the dashboard both before and during the cyber attack (indicated by the malfunctioning features), and the road / other sce- nery. Finally, differences in trust ratings were noted between one type of event (overtake/non-overtake of a bus). Extending the scenario to a wider range of situations (events) is of importance to examine whether and to what extent the findings generalise.
ACKNOWLEDGMENT
This research was funded by an ESRC-JST project: Rule of Law in the Age of AI: Principles of Distributive Liability for Multi-Agent Societies - ES/T007079/1 (the last author is UK PI). A warm thank you goes to the wider project team for their valuable contributions to the experiment and discussions regarding future research.
REFERENCES
Bainbridge, L (1983). Ironies of automation, Automatica, 19(6) 775 – 779. Cohen, J. (1988). Statistical power analysis for the behavioral sciences (2nd ed.).
Hillside, NJ: Lawrence Erlbaum Associates. Houthusen, B., Wintersberger, P., Walker, B. and Riener,. A Situational Trust Scale for Automated Driving (STS-AD): Development and Initial Validation. In: 12th International Conference on Automotive User Interfaces and Interactive Vehicular Applications, 2020, Washington DC, USA. ISO (2023a). ISO/SAE 21434:2021 - Road vehicles — Cybersecurity engineering ht
tps://www.iso.org/standard/70918.html Accessed [07 01 2023]. ISO (2023b). ISO 24089:2023 Road vehicles — Software update engineering ISO - ISO 24089:2023 - Road vehicles — Software update engineering Accessed [07 01 2023]. Jaguar LandRover (2019) Jaguar LandRover Find the Teenagers Writing the Code
For A Self-Driving Future. https://media.jaguarlandrover.com/news/2019/04/ Accessed [8 February 2023].
Kovacs, E. (2023). EV Charging Management System Vulnerabilities Allow Disruption, Energy Theft - SecurityWeek. Accessed [13 February 2023]. Leggett, D. (2022). Japan to allow limited Level-4 self-driving from 2023. Just
Auto. https://www.just-auto.com/news/japan-to-allow-limited-level-4-self-drivi ng-from-2023/ Parasuraman, R., & Riley, V. (1997). Humans and automation: Use, misuse, disuse, abuse. Human Factors, 39(2), 230–253. https://doi.org/10.1518/ 001872097778543886 Phama, M. & Xiong, K. (2021) A survey on security attacks and defense techniques
for connected and autonomous vehicles, Computers & Security, 109(1), 1–29. UNECE, 2023a (2023). UNECE UN Regulation No. 155 https://unece.org/transpor t/docments/2021/03/standards/un-regulation-no-155-cyber-security-and-cyber-s ecurity. Accessed [07 01 2023]. UNECE, 2023b (2023). UNECE UN Regulation No. 156 - Software update and sof-
tware update management system, https://unece.org/transport/documents/2021/ 03/standards/un-regulation-no-156-software-update-and-software-update. Accessed [07 01 2023]. UNECE, 2023c (2023). UNECE WP.29 - Introduction https://unece.org/wp29-intr oduction. Accessed [07 01 2023]. Zhang, Q., Wallbridge, D. C., Morgan, P. and Jones, M. D. (2022) “Using simulation-
Read this individual research paper free through the original publisher, or explore the full digital proceedings book.
ISBN 978-1-958651-67-4
Explore this ISBN in the AHFE Bookstore ↗Listed in the July 2026 bookstore catalogue; search by ISBN to confirm current availability · Digital book purchase optional