Karl Proctor (2023). Building Trust in Highly Automated and Autonomous Vehicles. In: Human Factors in Transportation. AHFE Open Access, vol. 95, pp. 216–226. https://doi.org/10.54941/ahfe1003807
Trust in highly Automated and Autonomous Vehicles (AAVs) is a topic that has been gaining traction in recent years, across academia, the technology industry, and of course, the automotive industry. A number of automotive OEMs and tech companies across the globe are developing AAVs, with the short-term focus being on SAE Level 2 and Level 3 vehicles, and the longer-term focus being on SAE Level 4 and Level 5 vehicles. Alongside the development of the core technology needed for such AAVs, these companies have been grappling with a key question that will influence the uptake and ultimate success of AAVs; How to get people to trust these vehicles? This paper outlines a series of small-scale projects undertaken by Jaguar Land Rover Research between 2016 and 2018 as part of the UKAutodrive project that attempted to address this question. Across this series of user trials, participants experienced a number of autonomous drives in a low-speed (6mph/10kph) prototype SAE Level 4 autonomous ‘pod’ for up to fifteen minutes at a time, and then asked to rate their trust at the end of each individual drive. Overall, the data shows that Trust is something that can indeed be reliably measured, something that changes/fluctuates over time, and can be undone if the occupant experiences a negative event (e.g. a near miss), with the impact of this event depending on when the occupant experienced it (first trip vs. fifth trip). Finally, we show that it seems to be the number of trips in, or exposures to, an autonomous vehicle rather than the length of time per trip that influences trust, with more, shorter trips (8x4 minute trips) recording higher reported trust compared to fewer, longer trips (4x8 minutes trips).
Trust in automated systems, and, by extension, autonomy, is an extre- mely complex concept that is important for understanding an individual’s acceptance of highly automated systems and the nature of the user-agent rela- tionship. Trust is multi-dimensional (Adams & Bruyn, 2003), fluid (Hoff & Bashir, 2015), is extremely fragile, and can easily be broken (Lee & Moray 1992, 1994; Muir & Moray, 1996; Hoff & Bashir, 2015), but with error- free exposure post-incident, will generally recover to pre-incident levels, and continue to rise.
Small errors or failures in automated systems, even those that do not affect overall performance, have been shown to have significant, negative impacts
Building Trust in Highly Automated and Autonomous Vehicles 217
on trust (Lee & Moray, 1992; Muir & Moray, 1996), with reported trust fal- ling following such errors. However, interestingly, there is evidence to suggest that having prior knowledge of the limitations (or rather, the capabilities) of an automated system can serve to reduce the effect of these errors on trust, with reported trust remaining largely unaffected with this knowledge due to appropriate trust calibration (Lewandowsky, Mundy & Tan, 2000; Riley, 1996; Khastgir, Birrell, Dyadyalla, & Jennings 2017, 2018). This suggests that people don’t simply calibrate their trust purely on the actual properties of the system, but rather, on their perceptions of the properties or capabilities of the system. It could be that advanced knowledge of a system’s limitati- ons influences the perception of risk associated with the use of the system (Adams & Bruyn, 2003), or serves to create appropriately calibrated expe- ctations on the part of the user. It could also be that these failures are more predictable and therefore expected, suggesting that the predictability of the system is an important, mediating factor in trust of automated/autonomous systems.
Interestingly, in contrast to interpersonal trust, there is evidence sugge- sting a positivity bias towards highly automated/autonomous systems, with users reporting higher levels of initial trust when dealing with such systems (Dzindolet, Peterson, Pomranky, Pierce, & Beck, 2003), presumably due to the assumption that people generally believe machines to be near-perfect in their operations, and therefore these initial trust levels are based on faith rather than actual experience (Hoff & Bashir, 2015), although, it is likely that the type of automation (e.g., factory machinery vs. autonomous vehicle) and therefore the perceived risk, will influence these data (Hoff & Bashir, 2015). However, data does suggest that there is a ‘price’ for these higher levels of initial, faith-based trust when dealing with automated systems. When fai- lures or errors do occur, human-automation trust is impacted significantly more than human-human trust (Madhavan & Wiegmann, 2007b), and can take significantly longer to recover (Adams & Bruyn, 2003; Lee & Moray, 1992), although this time to recover depends significantly on the nature and magnitude of the failure (Lee & Moray, 1992, 1994). This paper outlines work across a number of in-vehicle user trials that were designed to test how the nature of a failure impacts reported trust and also how Trust recovers following a failure.
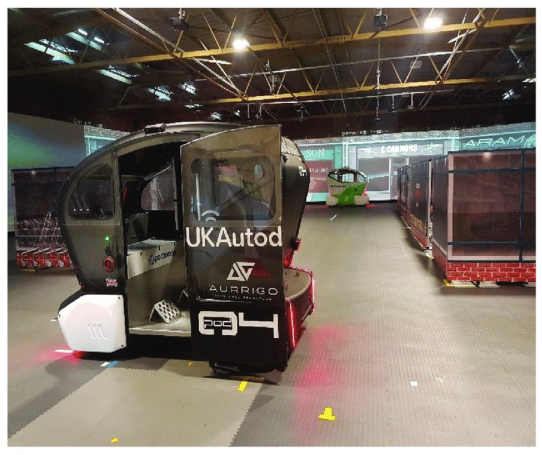
VEHICLE & FACILITY The vehicle used for all studies outlined in this paper was a low-speed pro- totype SAE Level 4 ‘pod’ that typically travelled at no more than 6mph (∼10kph). This vehicle was fully capable of engaging in Level 4 automa- ted driving, but for the purpose of the work outlined here, it was decided to use ‘breadcrumb’ navigation where the vehicle followed a series of pre- determined way points. This decision was made for repeatability and for the consistency of the experience between participants both for the driving expe- rience, as well as for the consistency of the experience of the negative incidents presented.
218 Proctor
During the pre-trial brief participants were given a safety briefing which introduced them to the testing facility as well as the vehicle used for the testing. Participants were also given an overview of the SAE levels of automa- tion/autonomy to ensure that they were aware that their vehicle was capable of Level 4 autonomous driving, and that it would in fact be operating auto- nomously for the duration of the testing. Participants were also informed that the vehicle was fitted with an emergency stop button that they could use at any time if they needed. When pushed, this button cut all power to the veh- icle, and activated the emergency brakes, bringing the vehicle to a full stop. When participants first entered the vehicle, they were shown the location and operation of this emergency stop button.
During the user trial participants were seated alone in vehicle, facing forw- ards, and were restrained with a standard 3-point seatbelt. In addition, a two-way radio was provided in the vehicle, which could be used to contact the trial facilitator if needed. All relevant safety and risk assessments were in place, and all user trials outlined here were approved by the Jaguar Land Rover Research Ethics Committee.
USER TRIALS A total of five user trials are reported in this paper, with each trial seeking to investigate different aspects of Trust of AAV’s. Table 1 below outlines the trials undertaken.
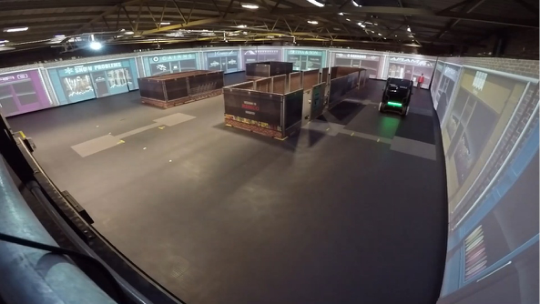
Trial 1 – Measuring Trust 20 Participants were given 8x trips in the vehicle, with each trip consisting of a series of turns and straight sections around the facility (shown in Figure 2
Figure 1: Vehicle used for testing.
Building Trust in Highly Automated and Autonomous Vehicles 219
Table 1. Overview of user trials reported in this paper.
Table available in the original PDF paper.
Trial Number Trial Title Trial 1 Measuring Trust Trial 2 Jian Survey With Repeated Exposures Trial 3 Effects of a Negative Incident (Failure) on Trust Trial 4 Early vs. Late Negative Incident (Failure) Trial 5 Number of Trips vs. Length of Each Trip
Figure 2: Birds-eye view of the testing facility.
above), lasting approx. 4 minutes, followed by a short break of 5 minutes. During this break participants were escorted from the vehicle and taken to a seating area where they completed the Jian et al., (2000) Trust survey (here- after ‘Jian survey’) as well as a single question trust survey (“To what extent do you trust the pod?”, 10-point negative-positive poles).
This single Trust question was used as there were some concerns about the repeated use of the Jian survey during the early stages of the project, although these concerns were addressed in a follow-up study, discussed shortly.
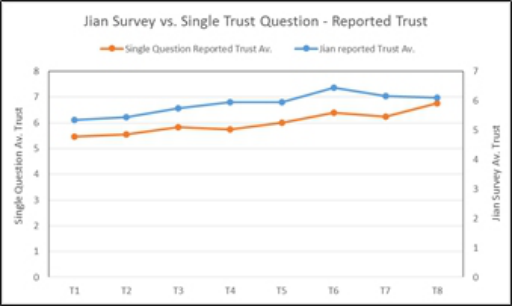
Data in Figure 3 above shows steady increases in reported Trust over time as the number of trips in the pod increased across both surveys used, with both surveys showing the same general pattern. This gave confidence that this survey could be used outside of the originally intended operating domain of automated machinery, although concerns still remained with using the survey repeatedly, and this a follow-up trial was conducted that addressed this concern.
Trial 2 – Jian Survey and Repeated Exposures As discussed, there were concerns raised around the repeated use of the Jian survey in fairly rapid succession. These concerns were increased after the project team reached out to the original authors of the Jian survey for advice, with the response being that the survey, while indeed measuring trust, was
220 Proctor
Figure 3: Reported trust from 2 trust surveys over time.
not designed to be used repeatedly. Thus, it was decided to conduct a follow- up study to investigate how reported trust changes over prolonged periods and whether or not the Jian survey could be used repeatedly.
This was a small-scale study designed to investigate any potential problems with the repeated use of the Jian survey. 6 participants were recruited, with these being different participants from the previous study. Participants were given a total of 24 trips in the same pod as the previous trial, with each trip lasting approx. 4 minutes. Given the number of trips needed, this trial was spread across three consecutive days, with participants being given eight trips per day, and being taken to the testing facility at the same time on each of the three days.
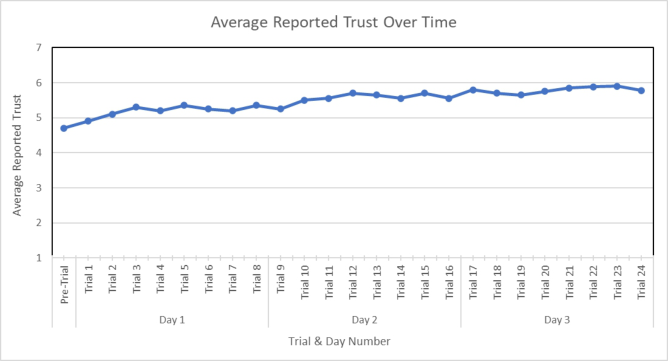
Data in Figure 4 shows a steady rise in reported trust over the course of the trial, across the three days of testing. However, the initial rise in trust for the first few trials of day 1 was steeper than subsequent days. Surprisingly, reported trust did not seem to plateau across the 3 days, with trust continuing to rise even towards the end of day 3. This data gave confidence that the Jian survey can be used repeatedly and should be sensitive enough to changes in Trust over time. Given this confidence in this survey, we next wanted to investigate how a negative incident affects reported Trust and whether or not the Jian survey would be able to detect these changes.
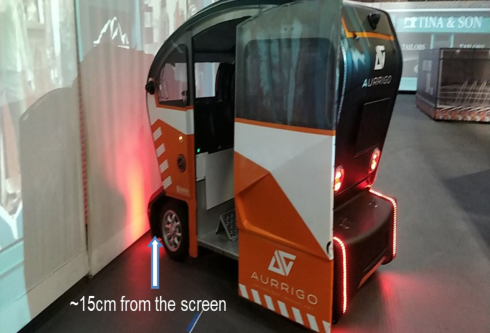
Trial 3 – Effects of a Negative Incident on Trust Here, 25 new participants were recruited and given nine short (∼4 minute) trips in the same pod as the previous two trials. However, for this trial a negative incident was presented to participants on lap five after approx. 2 minutes ride-time. Laps 1–4 and 6–9 were all positive experiences. The nega- tive incident involved the vehicle driving towards an apparent solid wall, before stopping abruptly approx. 15cm away, followed by all power being cut to the vehicle after 5 seconds.
As the vehicle was following a series of pre-programmed way-points, it was actually programmed to stop just before the wall, though this was not known by participants until the post-trial debrief. This location was chosen
Building Trust in Highly Automated and Autonomous Vehicles 221
Figure 4: Average reported trust across 3 days of testing.Figure 5: Position of the vehicle following a simulated negative incident.
for the simulated failure as there was a further 40-50cm of space behind the fabric sheet before the vehicle encountered a solid object, giving an additional margin for safety.
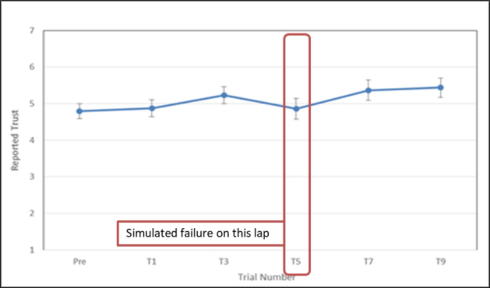
Data in Figure 6 shows the same rise in Trust for trials 1–4 as shown on the previous trials (see Figure 3 and Figure 4 above), with a sharp drop in Trust on lap 5 following the negative incident. However, interestingly, the data also shows an immediate recovery of Trust on subsequent trials following the negative incident, with reported Trust on lap 7 exceeding reported Trust immediately prior to the negative incident. While the eventual recovery of Trust was expected, this immediate recovery of Trust was unexpected, and thus was something that warranted further investigation. For the next trial, a group of participants were presented with a negative incident on lap 1 rather than lap 5 to see if this same recovery profile would be observed.
222 Proctor
Figure 6: Reported trust over time and following a negative incident.
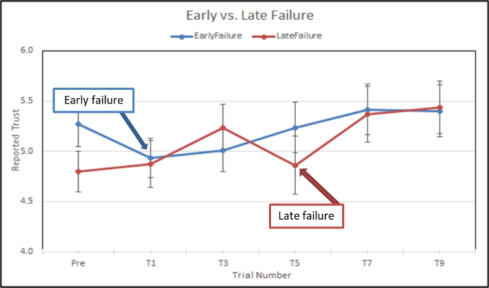
Trial 4 – Effect of an Early vs. Late Incident on Reported Trust For this trial, 25 new participants were recruited and presented with the same nine short (∼4 minute) trips in the same pod as previous experiments. The route around the facility and the nature & location of the negative incident were identical to that reported in Trial 3 above. However, for this trial the simulated failure was presented to participants on their very first lap, with this once again being presented after approx. 2 minutes ride time.
Data in Figure 7 shows a comparison of an early failure (in blue) and a late failure (in red) of the autonomous pod. As expected, both groups show a drop in reported trust, with this drop being approx. the same across both groups. However, the data of interest here is the recovery of Trust following the nega- tive incident. As outlined in the previous section, the late failure group show an immediate recovery of trust in the laps following the simulated failure. However, this contrasts sharply with the early failure group, which shows a distinctly different recovery pattern, with only very minor increases in Trust over the laps following the failure, taking around seven laps to recover to baseline (pre-trial) levels. It is interesting to note though that after 9 laps in the vehicle, both groups report identical levels of reported Trust.
Figure 7: Reported trust for early vs. late simulated failure over time.
Building Trust in Highly Automated and Autonomous Vehicles 223
Figure 8: 4x eight-minute laps vs. 8x four-minute laps over time.
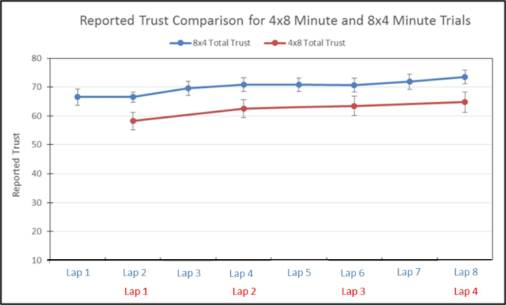
Trial 5 – Number of Trips vs. Length of Time Length of a Trip Next we wanted to investigate whether it was the amount of time per trip that was important for increasing Trust in AAVs or the total number of trips over a given period, in this case 32 minutes. For this trial, 40 new participants were recruited, and equally split into 2 conditions. Condition 1 presented participants with four, eight-minute long trips, while condition 2 presented participants with eight, four-minute long trips. In both cases, the total time in the vehicle was the same – 32 minutes – but the difference was in how this time was distributed.
To mitigate any potential order effects, each condition was presented on alternate days, with condition 1 presented on days 1, 3, and 5 and condition 2 presented on days 2, 4, and 6. There was no simulated failure presented to participants in this trial. As with the previous studies, participants were presented with the Jian survey immediately after each trip in the vehicle.
Data shows the anticipated increases in reported Trust across both groups, with both showing the same overall increases over time as participants gain more experience. However, interestingly a clear difference in reported Trust between the two conditions is present, with condition 2 (8x four-minute laps) showing consistently higher trust than condition 1 (4x eight-minute laps).
This suggests that it is more beneficial in terms of building Trust for passengers to have more frequent, shorter trips in an autonomous vehicle.
DISCUSSION
Overall, this paper outlines three key findings; Firstly it has been shown that it is possible to reliably measure Trust in AAVs, secondly, this paper has shown that it is possible to do so repeatedly over a relatively short period or time (in this case around two hours), and thirdly, this paper shows that it is pos- sible to influence an individual’s Trust in AAVs through positive or negative experiences.
Each of the five user trials outlined have demonstrated increases in repor- ted Trust over time as participants are exposed to AAVs. Trials 1 & 2 both
224 Proctor
showed that trust rises over time, with Trial 2 showing that trust continues to rise even after two-dozen exposures to an AAV, although the rate of increase does decrease over time. It would be interesting to repeat this particular trial, but increase the number of participants as only six were tested for Trial 2.
Probably the most important finding within this paper is that it is possible to influence Trust in AAVs as well as how Trust develops over time, through negative experiences. Trials 3 and 4 both sought to influence the building of Trust over time, but did so in different ways. Trial 3 presented a negative expereience to participants after they had several positive exosures, before presenting them with a negative event. Following this negative event there was a drop in reported Trust, but there was an immediate recovery in Trust when participants were once again asked to ride in the test vehicle. It is pos- sible that the previous positive experiences with the vehicle had established a baseline level of the capabilities of the vehicle, with the presented failure potentially being seen as a momentary ‘glitch’, and thus lead to the appro- priate calibration of Trust (Lewandowsky et al., 2000; Riley, 1996; Khastgir et al., 2017, 2018) as well as the perceptions of risk associated with riding in the vehicle (Adams & Bruyn, 2003).
Trial 4 presented participants with a negative incident on their very first ride in the vehicle, compared to the fifth ride for participants in Trial 3. This resulted in a drop in Trust as expected, but in contrast to Trial 3, the recovery profile for Trial 4 was much shallower, and took an additional six rides in the vehicle before Trust receovered to baseline. This is interestesting as it shows first of all that Trust can recover following a negative event, regardles of when this event was experienced, but also further supports the suggestion that continuous positive experiences serve to calibrate trust and influence the perceptions of risk. However, the nature and severity of the negative event will have a significant effect on the drop in trust as well as the recovery of trust over time. In the case of the work outlined in this paper, the actual risks to the participants were low due to, for example, the low speed of the vehicle, and the controlled testing environment.
Trial 5 sought to influence Trust through the length of time that the par- ticipants spent riding in the vehicle. Two groups of participants were given either 4x eight-minute rides, or 8x four minute rides, with the overall amount of time in the vehicle being constant across the two groups at 32 minutes. The data showed that those participants who experienced shorter duration rides in the vehicle reported higher trust than those participants who experienced longer-duration rides.
LIMITATIONS OF THE WORK With all of these findings though, the work outlined in this paper is not without limitations, and caution is advised as to the generalisability of the fin- dings. One of the key limitations is the generally small sample size used during testing. Given that these trials were intended to be either fact-finding trials, or trials that could rapidly be developed, tested, and analysed due to the com- mercial environment, the trials were typically limited to 20–30 participants. While these numbers were useful for giving indications of avenues for deeper
Building Trust in Highly Automated and Autonomous Vehicles 225
investigation, further testing with significantly larger sample sizes is needed for any data to be generalised.
Secondly – and again given the commercial limitations – it was not possible to see how Trust changes over longer time periods, such as weeks or months. It would have been useful to have been able to ask participants to complete the Jian survey several weeks after their rides in the vehicle, or to test them several times over a period of months to investigate any possible ‘decay’ in trust over time.
All of the trials reported in this paper formed part of a larger project, with more than two-dozen user trials conducted over a 2.5 years period in total. Although not outlined in this paper, as part of this wider project, work was undertaken to establish the individual factors that comprise Trust as this is not a single factor, but rather is multi-dimensional, consisting of a number of factors (Adams & Bruyn, 2003). Initial internal work showed that these factors include perceived risk, reliability, and dependability, and shows that their contribution to Trust is not equal. The key to understanding Trust is to understand the contribution that the individual factors make to overall Trust, whatever these factors turn out to be.
CONCLUSION
This paper outlines work undertaken at Jaguar Land Rover Research between 2016 and 2018, with this work investigating Trust of AAVs through a series of pilot user trials in an SAE Level 4 automated vehicle. The data from this work shows that Trust in AAVs can be repeatedly measured, and can be measured several times in quick succession. This paper also shows that trust changes over time, and can be influenced – both positively and negatively – through experiences presented whilst riding in the vehicle, with negative incidents leading to significant reductions in Trust immediately following the incident. Importantly for the automotive industry, this paper has shown that Trust in AAVs will recover when passengers are presented with a positive experience, even if the negative incident is presented on the very first trip in an AAV.
The work outlined here is the first step to wider research into AAVs in the automotive industry, and can serve as the foundation for subsequent research into the topic of Trust in AAVs. In terms of next steps, much of the work discussed here will need replicating with significantly larger samples sizes, and much of this work was conducted as smaller-scale pilot studies designed to probe for avenues of interest for future research.
REFERENCES
Adams, B. D. & Bruyn, L. E., (2003). Trust in Automated Systems Literature Review.
Defence Research and Development Canada Toronto No. CR-2003–096. Dzindolet, M. T., Peterson, S. A., Pomranky, R. A., Pierce, L. G. & Beck, H. P.
(2003). The role of trust in automation reliance. International Journal of Human– Computer Studies, 58, 697– 718. Hoff, K. A. and Bashir, M., 2015. Trust in automation: Integrating empirical evidence on factors that influence trust. Human factors, 57(3), pp. 407–434.
226 Proctor
Jian, J. Y., Bisantz, A. M. and Drury, C. G., 2000. Foundations for an empirically determined scale of trust in automated systems. International journal of cognitive ergonomics, 4(1), pp. 53–71. Khastgir, S., Birrell, S., Dhadyalla, G. and Jennings, P., 2017. Calibrating trust to
increase the use of automated systems in a vehicle. In Advances in human aspects of transportation (pp. 535–546). Springer, Cham. Khastgir, S., Birrell, S., Dhadyalla, G. and Jennings, P., 2018, July. Effect of knowledge of automation capability on trust and workload in an automated vehicle: a driving simulator study. In International Conference on Applied Human Factors and Ergonomics (pp. 410–420). Springer, Cham. Lee, J., & Moray, N. (1992). Trust, control strategies and allocation of function in
human–machine systems. Ergonomics, 35, 1243–1270. Lee, J. D., & Moray, N. (1994). Trust, self-confidence, and operators’ adaptation to automation. International Journal of Human–Computer Studies, 40, 153–184. Lewandowsky, S., Mundy, M., & Tan, G. (2000). The dynamics of trust: Compa-
ring humans to automation. Journal of Experimental Psychology – Applied, 6, 104–123. Madhavan, P., Wiegmann, D. A., & Lacson, F. C. (2006). Automation failures on tasks easily performed by operators undermine trust in automated aids. Human Factors: The Journal of the Human Factors and Ergonomics Society, 48(2), 241–256. Muir, B. M., & Moray, N. (1996). Trust in automation: 2. Experimental studies of
trust and human intervention in a process control simulation. Ergonomics, 39, 429–460. Rotter, J. B., 1967. A new scale for the measurement of interpersonal trust. Journal of personality.
LISTED IN THE AHFE DIGITAL BOOKSTORE CATALOGUE
Explore the complete digital volume
Human Factors in Transportation
Read this individual research paper free through the original publisher, or explore the full digital proceedings book.
ISBN 978-1-958651-71-1
Explore this ISBN in the AHFE Bookstore ↗Listed in the July 2026 bookstore catalogue; search by ISBN to confirm current availability · Digital book purchase optional