Liping Li, Yurong Chen, Jifang Wang, Xiaojun Luo (2023). Chinese Drivers’ Attitudes toward L2+ Level of Driving Automation. In: Human Factors in Transportation. AHFE Open Access, vol. 95, pp. 460–469. https://doi.org/10.54941/ahfe1003831
In addition to SAE 6 levels of driving automation, the industry has introduced Level 2+ driving automation (L2+), which includes features such as Highway Driving Pilot (HDP), Automatic Parking Assist (APA), Valet Parking Assist (VPA) and Remote Parking Assist (RPA). A mixed-methods study was conducted to investigate the daily usage and attitudes of L2+ experienced drivers toward L2+ features. 395 L2+ experienced drivers in China participated in the on-line survey, and 11 of them joined successive validation interviews. The results show that HDP and APA are the most commonly used features. Drivers experience more fun with tech from using parking features, while HDP provide users with relaxing time. Safety concerns are the main reason why drivers do not use L2+ features, which in turn decreases usage and negatively correlates with performance-related reasons for not using them. These findings suggest that drivers hold divergent attitudes towards L2+ features, with a focus on safety or efficiency. Such findings can guide product design and customer education.
In partnership with the International Organization for Standardization (ISO), Society of Automotive Engineers (SAE) recommended 6 levels of driving automation, from Level 0 (no driving automation) to Level 5 (full driving automation) for motor vehicles and their operation on roadways (Society of Automotive Engineers, 2021).
China is currently in the process of transitioning from Level 2 (L2) to Level 3 (L3), and high customer acceptance is an essential requirement for new pro- ducts to enter the market. There has been a certain accumulation of research results related to L2 and L3 user acceptance in both domestic and foreign research.
Public Acceptance Previous research has indicated that drivers generally hold a high level of trust in valid L2 features. In a study conducted by Nordhoff et al. (2021) investigating attitudes towards L2 driving automation, it was found that drivers placed a high level of trust in vehicle speed and distance
Chinese Drivers’ Attitudes Toward Level 2+ Driving Automation 461
maintenance features. However, compared to manual driving, partial automation did lead to increased engagement in secondary tasks such as observing the landscape. Additionally, the study found that perfor- mance expectation was the most influential factor in determining dri- vers’ use of assisted driving systems. In another study by Wilson et al. (2007), lane departure was reduced by 10%-60% with the use of Ada- ptive Cruise Control (ACC), and drivers’ acceptance of this technology was consistently high.
As drivers begin to interact with L3 features, their concerns tend to incre- ase. According to a study of user attitudes and preferences towards L2 to L5, the largest disparity in attitudes and preferences exists between L2 and L3, and safety is the most significant factor of the decline (Lajunen and Sullman, 2021). This further indicates that L3 driving automation is in the water- shed between human and machine-led driving, which puts forward higher demands for man-machine co-driving.
Despite the concerns regarding L3 driving automation, there is still a posi- tive public acceptance towards higher level driving automation applications. Li et al. (2020) conducted a study on 64 published studies related to autono- mous driving public acceptance and identified five major topics: technology acceptance, trust, perception, payment willingness, and usage preferences. The study showed an overall positive public acceptance towards autonomous driving. Trust building is also considered essential for higher level driving automation. Researchers suggest that improving system transparency, techni- cal competence, and situation management could positively affect trust tow- ards L3 automated vehicles and result in increased willingness to use L3 auto- mated vehicles (Choi and Ji, 2015) as well as L5 autonomous vehicles (AV) (Choi and Ji, 2015; Xu et al., 2018).
L2+ Features SAE Level 2 driving automation features provide support to the driver in steering and brake/acceleration control. Lane Centering Control (LCC) with Adaptive Cruise Control (ACC) is a common L2 feature found in private cars. According to IDC, the penetration rate of L2 autonomous driving in China’s passenger car market reached 23.2% in the first quarter of 2022 (IDC, 2022).
On the road to highly automated driving, the industry introduced L2+ features to the market (Mobileye, 2020; Brooke, 2020). The term L2+ was first introduced by Mobileye at the CES in 2018. Mobileye’s L2+ techno- logy adds its Road Experience Management maps to L2 solutions, which enables pseudo-autonomy (Mobileye, 2020) and avoids the cost, complexity and uncertainty of L3 (Brooke, 2020). According to Mobileye’s explanation for L2+ and Manufactures’ introduction, we can observe 4 major features of L2+ assisted driving in China market: highway driving pilot (HDP) (Shuju- bang.com, 2022), automatic parking assist (APA), valet parking assist (VPA) (Research and Markets, 2021) and remote parking assist (RPA) (Tesla, 2020; Xpeng, 2020). The descriptions and representative applications of these 4 features are shown in Table 1.
From 2022 Q1 to Q3, L2+ feature load rate reaches 5.1% in China pas- senger car market, forcasted to surpass 15% in 2025 (Shujubang.com, 2022).
Table 1. 4 major L2+ features.
Table available in the original PDF paper.
Feature name Feature description Representative applications Tesla NOA, Xpeng NGP, NIO NOP Highway Driving Pilot (HDP) The vehicle can drive automatically in the highway pilot map area, controlling its speed, space and lane choice.
The vehicle can detect nearby parking space and park itself.
Tesla Autopark, Xpeng APA, ArcFox APA, BYD APA
Automatic Parking Assist (APA)
Xpeng VPA, Weltmeister AVP
Valet Parking Assist (VPA)
The vehicle can remember parking routes in a mapped area and drive the routes automatically.
Tesla Smart Sumon, Xpeng RPA
Remote Parking Assist (RPA)
Under the control of a phone app or a key outside, the vehicle can move in a certain route slowly.
The industry strives to evolve from L2 to higher lever driving automation and pioneering customers also pay for this new trend, providing study opportu- nities for research. This study aims to explore how drivers actually use L2+ features, as well as their reasons for using or not using them. By investiga- ting customer attitudes in this area, we can gain valuable insights into the adoption of higher-level driving automation.
METHOD
Questionnaire Survey A questionnaire was placed in Baidu Map, CarLife for 2 weeks. Baidu Map is a popular travel assistance APP proceeding billions of service requests daily (Baidu Map, 2020). CarLife is a Baidu-owned screen casting app that requi- res binding with the vehicle, so drivers are the main users (Baidu CarLife+, 2020). Samples were filtered with lie detection questions. For example, Tesla samples who choosing VPA were deleted. Finally, 973 valid data were obtai- ned, including 395 with L2+ experience and 578 with no L2+ experience. The questionnaire also included demographic information: gender, age and driving experience. 91.26% of drivers who participated in the questionnaire were male and 8.74% were female. Most of them were over 30 years old, accounting for 77.7%. Drivers with more than 3 years driving experience accounted for 78.21%.
This section includes the usage frequency of each feature and why it is used/not used. Options are summarized by consulting relevant practitioners. Reasons of using/not using can be multiple-chosen in the questionnaire, with the options appearing in random order (see Table 2). For drivers who had not used L2+ features, general views on HDP and APA was asked.
User Interview 11 questionnaire participants with high L2+ functional attempts were sele- cted for further remote interviews (see Table 3). The interviews are intended to validate questionnaire information.
Chinese Drivers’ Attitudes Toward Level 2+ Driving Automation 463
Table 2. Reasons of using/not using in the questionnaire.
Table available in the original PDF paper.
Reasons of using Reasons of not using Interest in technology Low success rate/ Need to take over frequently Relax and rest Safety concern Use the time to do other things Difficulty in learning/operating Lack of driving pleasure Drive slower than you do Save time Drive worse than you do Drive better than you do Need to change lane (HDP) All drivers use it No fixed parking space (VPA/RPA) Other Other
Table 3. Basic information of 11 drivers in user interview.
Table available in the original PDF paper.
No. Gender Age Occupation L2+ Features Weekly Use Frequency
Driving Experience (year) 1 male 28 Service industry employee >7 >3 2 male 26 Internet industry employee 1–3 >3 3 male 28 Watch industry staff >7 >3 4 male 37 State-owned enterprises employee >7 1-3 5 male 31 Media entrepreneur >7 >3 6 male 28 Employee of public institution 4–7 >3 7 male 38 University staff 4–7 >3 8 male 35 Educational industry employee 1–3 >3 9 male 21 Automobile industry employee 4–7 2 10 male 34 Civil professional 1–3 >3 11 male 32 Administrative assistant 4–7 >3
RESULT
Usage of L2+ Features
Table 4 shows the proportion of different L2+ feature usage. The most expe- rienced feature is HDP, 57.47% of all L2+ drivers tried. APA function was the next, accounting for 51.14% of all L2+ drivers. VPA and RPA were expe- rienced by significantly fewer people, accounting for 16.20% and 18.99% respectively.
HDP and APA were most common features in these L2+ features, 78 dri- vers experienced both HDP and APA, with an overlap of 19.75% of all population. As for both parking assistance features, 28 people experienced
Table 4. Proportion of use of L2+ features.
Table available in the original PDF paper.
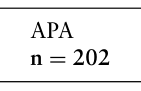
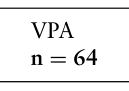
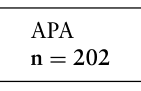
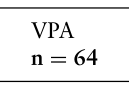
Options-multiple choice n Proportion of All Proportion of L2+ Highway Driving Pilot (HDP) 227 23.33% 57.47% Automatic Parking Assist (APA) 202 20.76% 51.14% Valet Parking Assist (VPA) 64 6.58% 16.20% Remote Parking Assist (RPA) 75 7.71% 18.99% None of abovea 578 59.40%
aMutually exclusive with other options
both VPA and APA, accounting for 7.09%. 49 people experienced both RPA and APA, accounting for 12.15%.
In terms of usage frequency (see Table 5), most drivers only tried several times. The proportion of getting into the habit of using HDP (more than once a week) was the highest, accounting for 42.29%. APA followed with 36.63%, while RPA was 34.67%. VPA had the lowest number of users and a lower regular using rate of 28.12%. In general, the frequency of regular use did not exceed the half.
Proportion of Using/Not Using Reasons Selected The main reason for using parking assistance features was interest in tech- nology, 74.26% for APA, 71.88% for VPA and 70.67% for RPA, shown in Table 6. HDP could make drivers feel relaxed, selecting by 69.16% of whom experienced this feature.
Table 7 represents main reasons of not using was safety concerns. For HDP, the second reason was take-over problems (37.44%) and need to change lane (35.24%). APA completed fewer driving actions and, apart from safety concerns (63.86%), the most prominent problem was driving slo- wer (41.09%), followed by low success rate (32.18%). Relatively less safety concerns in using VPA (59.38%) and RPA (54.67%) and more worries in performance. 29.69% VPA users reported take over frequently problem and 29.33% RPA users complained slow-driving of the system.
Correlation Analysis of HDP Using/Not Using Reasons With over 200 drivers using HDP and APA, the relationship between the use/not-using reasons was further analyzed with Kendall nonparametric correlation analysis (Croux and Dehon, 2010).
Equation reproduced from the original PDF.Equation reproduced from the original PDF.Equation reproduced from the original PDF.
RPA n = 75 Interest in technology 49.78% 74.26% 71.88% 70.67% Relax and rest 69.16% 38.12% 57.81% 34.67% Use the time to do other things 21.59% 17.33% 25.00% 16.00% Lack of driving pleasure 17.62% 14.85% 25.00% 13.33% Save time 14.54% 14.36% 23.44% 18.67% Drive better than you do 23.35% 22.28% 17.19% 14.67% All drivers use it 3.96% 4.95% 10.94% 2.67% Other 5.29% 5.94% 0.00% 8.00%
Chinese Drivers’ Attitudes Toward Level 2+ Driving Automation 465
Table 7. Reasons of not using among L2+ features.
Table available in the original PDF paper.
Equation reproduced from the original PDF.Equation reproduced from the original PDF.Equation reproduced from the original PDF.
RPA n = 75 Low success rate 32.18% 34.38% 34.67% Need to take over frequently 37.44% 29.69% Safety concerns 69.16% 63.86% 59.38% 54.67% Difficulty in learning/operating 12.33% 11.39% 17.19% 17.33% Drive slower than you do 13.22% 41.09% 20.31% 29.33% Drive worse than you do 10.57% 12.87% 9.38% 13.33% Need to change lane (HDP) 35.24% Lack of fixed parking space (VPA/ RPA) 21.88% 21.33% Other 6.61% 4.46% 1.56% 1.33%
Table 8. Correlation between usage frequency of HDP and reasons of using.
Table available in the original PDF paper.
Reasons of using HDP Frequency 1 2 3 4 5 6 7 1: Interest in technology −0.01 2: Relax and rest −0.03 −0.04 3: Use the time to do other things 0.09 0.08 0.00 4: Lack of driving pleasure 0.02 −0.09 −0.02 0.07 5: Save time 0.07 −0.06 −0.13∗ 0.03 0.01 6: Drive better than you do 0.03 −0.01 −0.08 −0.01 0.10 0.27∗∗ 7: All drivers use it −0.03 0.02 −0.06 0.06 0.02 0.11 0.15∗ 8: Other −0.06 −0.12 −0.14 0.02 −0.11 −0.10 −0.13 0.05
**p<0.01; *p<0.05
Table 9. Correlation between usage frequency of HDP and reasons of not using.
Table available in the original PDF paper.
Reasons of using HDP Frequency 1 2 3 4 5 6 1: Need to take over frequently −0.02 2: Safety concern −0.15∗ −0.07 3: Difficulty in learning/operating 0.05 −0.04 −0.13 4: Drive slower than you do 0.04 −0.09 −0.16∗ 0.05 5: Drive worse than you do −0.06 0.06 −0.02 −0.04 0.16 6: Need to change lane 0.09 −0.08 −0.05 −0.14∗−0.02 0.11 7: Other 0.06 −0.17∗−0.24∗∗ 0.01 −0.05 −0.09 −0.05
**p<0.01; *p<0.05
Table 8 shows no significant correlation between usage frequency of HDP and reasons of using. “Save time” was negatively correlated with “Relax and rest” (r = −0.13, p < 0.05). “Driving better than you do” is positively corre- lated with “Save time” (r=0.27, p < 0.01) and “All drivers use it” (r = 0.15, p < 0.05).
Table 9 represents a significant negative correlation between the usage frequency of HDP and “Safety concern”. As the main reason of not using, “Safety concern” was significantly negatively associated with “Driving slo- wer” (r = −0.16, p < 0.05) and “Other” (r = −0.24, p < 0.01). And “Other” was negatively associated with “Need to take over frequently” (r = −0.17, p < 0.05). “Difficulty in learning/operating” was also negatively correlated with “Need to change lane” (r = −0.14, p < 0.05) Overall, safety concerns have dampened the usage frequency of HDP. Safety preference and efficiency preference are slightly separated.
Correlation Analysis of APA Using/Not Using Reasons
Table 10 shows that the usage frequency of APA was positively correlated with “Relax and rest” (r = 0.21, p < 0.01), “Use the time to do other things” (r = 0.14, p < 0.05) and “Save time” (r = 0.17 p < 0.05). “Use the tine to do other things” is positively correlated with “Relax and rest” (r = 0.18, p < 0.05) and “Lack of driving pleasure” (r = 0.25, p˜textless 0.01), and “Save time”is positively correlated with “Lack of driving pleasure”(r = 0.27, p<0.01) and “Drive better than you do” (r = 0.46, p < 0.01). “Interest in technology” is negatively correlated with “Other” (r = −0.28, p < 0.01).
Table 11 shows no significant correlation between usage frequency of APA and reasons of not using. As the main reason of not using, “Safety concern”was significantly negatively correlated with “Drive slower than you do”(r = −0.31 p < 0.01) and “Other”(r = −0.24, p < 0.01). “Drive slower than you do” had a significantly positive correlation with “Drive worse than you do”(r = 0.22, p < 0.01). There is a considerable difference between safety preference and efficiency preference in the reasons of not using APA.
L2+ Non-Use Drivers’ Attitude For drivers who had not used L2+ features, there were 74.40% concer- ned about HDP and 66.60% concerned about APA. Among them, 49.31% said they expected to use HDP and 43.94% expected to use APA. Overall, L2+ features are attracting the attention of drivers.
Users Interview Validation The questionnaire responses from the 11 users shown in Table 3 were gene- rally consistent with the interview validation. 2 users gave slightly different
Table 10. Correlation between usage frequency of APA and reasons of using.
Table available in the original PDF paper.
Reasons of using APA Frequency 1 2 3 4 5 6 1: Interest in technology −0.03 2: Relax and rest 0.21∗∗ −0.12 3: Use the time to do other things 0.14∗ 0.06 0.18∗ 4: Lack of driving pleasure −0.02 −0.01 0.10 0.25∗∗ 5: Save time 0.17∗ −0.15 0.06 0.07 0.27∗∗ 6: Drive better than you do 0.12 −0.09 −0.03 0.07 0.11 0.46∗∗ 7: All drivers use it −0.03 −0.07 0.10 0.02 −0.03 0.10 0.15 8: Other −0.12 −0.28∗∗−0.11 −0.12 −0.10 −0.10 −0.13
**p<0.01; *p<0.05
Table 11. Correlation between usage frequency of APA and reasons of not using.
Table available in the original PDF paper.
Reasons of not using APA Frequency 1 2 3 4 5 1: Low success rate −0.07 1.00 2: Safety concern −0.15 −0.12 1.00 3: Difficulty in learning/operating 0.05 −0.01 −0.12 1.00 4: Drive slower than you do −0.04 0.01 −0.31∗∗−0.05 1.00 5: Drive worse than you do 0.05 −0.01 −0.11 0.09 0.22∗∗ 1.00 6: Other 0.06 −0.05 −0.24∗∗−0.08 −0.13 −0.08
** p<0.01; *p<0.05
Chinese Drivers’ Attitudes Toward Level 2+ Driving Automation 467
feedbacks. User No. 4 reported “no usage” in the questionnaire because of low success rate of VPA. User No. 11, who used APA at a moderate frequency, abandoned it later because of low success rate and slow parking speed.
HDP requires a lot of attention to observe the vehicle even when it is on autopilot because of safety concern in the highway scenes. User No. 1 shared that he could chat with accompanying people and User No. 11 thought it’s better keep focus on driving. Other users participated in the interview part gave similar feedbacks.
APA and VPA have slow speed, allowing users to take breaks and do acti- vities like tuning music, packing belongings and replying to messages. Most users agreed with that except User No.7 and User No.11. They argued that checking vehicle status at the same time is important.
DISCUSSION
Road to Higher Automation Although the public generally welcome the higher level of driving automa- tion, it’s expensive to in terms of large-scale manufacturing. L2+ approach gives a quick and economical trial to private car market. The responses from actual users confirmed that this approach is accepted by pioneering custo- mers, influencing potential buyers. However, safety uncertainty has not solid solved yet in this phase. Safety concerns depressed the usage of HDP signifi- cantly where APA usage frequency was not affected. This suggests that APA and other slow-speed automation, i.e., VPA, may be a more promising option to try higher level of driving automation.
Safety-Sensitive & Efficiency-Sensitive For practitioners, safety and efficiency are often in conflict. The slower the system moves in the self-driving phase, the easier it is to ensure safety and allow drivers to take over in time. However, it’s not always the same case. Sometimes drivers quit using because of lacking efficiency. In this study, we found HDP tend to be safety-sensitive. Safety concern is significant negatively correlated with usage frequency, and also negatively correlated with driving slow. APA tend to be efficiency-sensitive. In interview part, participants refle- cted APA and VPA gave them convenience to do other things, which improved the everyday parking experience. The opportunity of relax, dealing other things simultaneously and saving time attracts drivers to try APA function. These results might be hint for manufactures to carefully design different driving styles regarding to the specific scene.
Limitations & Future Work This study is intended to get a general image of nowadays L2+ users. To dig into acceptance and experience evaluation models, more extended and structured following studies could be applied. Also, the comparison of actual users and other population could be examined via future studies. For example, the safety uncertainty perception difference between long-time
L2+ feature users and the public. These potential study topics will give references for policy makers, manufactures and the public.
CONCLUSION
The study investigates influential factors of the actual usage of L2+ assisted driving. Drivers are safety-sensitive when using HDP. Safety concern hindered HDP usage frequency. While parking assist features, such as APA, are more efficiency-oriented, as drivers use them to save time and multitask. Therefore, we recommend different driving-style-scene design tactics for practitioners to tailor into actual L2+ drivers’ demand.
REFERENCES
Baidu CarLife+. (2020). I’m CarLife+ [Online]Available: https://online.carlife.baidu .com/ [Accessed December 19, 2022]. Baidu Map. (2020). Business Cooperation Center. [Online]Available: https://map-hz
.baidu.com/ [Accessed December 19, 2022]. Brooke, Lindsay. (2020). ‘Level 2+’: Making automated driving profitable, mainstream. [Online]. SAE. Available: https://www.sae.org/news/2020/12/rise-of-sae- level-2 [Accessed January 16, 2023]. Choi, Jong Kyu. Ji, Yong Gu (2015). Investigating the importance of trust on
adopting an autonomous vehicle. International Journal of Human-Computer Interaction, 31(10), pp. 692–702. Croux, Christophe. Dehon, Catherine (2010). Influence functions of the Spearman and Kendall correlation measures. Statistical methods & applications, 19, pp. 497–515. IDC. (2022). Q1 passenger car L2 penetration reaches 23.2%. [Online] Avai-
lable: https://www.idc.com/getdoc.jsp?containerId=prCHC49058722 [Accessed December 19, 2022]. Lajunen, Timo. Sullman, Mark JM (2021). Attitudes toward four levels of selfdriving technology among elderly drivers. Frontiers in psychology, 12, p. 682973. Li, Tang, et al. (2020). Research review on public acceptance of autonomous driving.
Journal of Traffic and Transportation Engineering, 20, pp. 131–146. Mobileye. (2020). Understanding L2+ in five questions. [Online] Available: https: //www.mobileye.com/blog/understanding-l2-in-five-questions/ [Accessed Decem- ber 20, 2022]. Nordhoff, Sina. Stapel, Jork. He, Xiaolin, et al. (2021). Perceived safety and trust in
SAE Level 2 partially automated cars: Results from an online questionnaire. Plos one, 16, e0260953. Research and Markets. (2021). China Automated Parking Assist (APA) and Automated Valet Parking (AVP) Market Report 2021–2023. [Online] Available: https://www.globenewswire.com/en/news-release/2021/06/09/2244115/28124/ en/China-Automated-Parking-Assist-APA-and-Automated-Valet-Parking-AVP- Market-Report-2021-2023.html. Shujubang.com. (2022). 2022 China Passenger Car L2 &L2+ Driving Automa-
tion Report. [Online]. Available: https://db.shujubang.com/home/login/index/gid/ 18833 [Accessed December 18, 2022]. Society of Automotive Engineers. (2021). Taxonomy and definitions for terms Related to driving automation systems for on-road motor vehicles. [Online] Available: https://doi.org/10.4271/J3016_202104
Chinese Drivers’ Attitudes Toward Level 2+ Driving Automation 469
Tesla. (2020). Model S Owner’s Manual-Smart Summon. [Online]. Avai- lable: https://www.tesla.com/ownersmanual/2012_2020_models/zh_cn/GUID-6B 9A1AEA-579C-400E-A7A6-E4916BCD5DED.html [Accessed December 19, 2022]. Wilson, Bruce, et al. 2007. Evaluation of a Road-Departure Crash Warning System.
United States. National Highway Safety Bureau. Xpeng. (2020). G3 Instruction Book-Remote Parking. [Online]. Available: https://www.xiaopeng.com/instruction_book/758?type=page [Accessed Decem- ber 19, 2022]. Xu, Zhigang. Zhang, Kaifan. Min, Haigen, et al. (2018). What drives people to accept automated vehicles? Findings from a field experiment. Transportation Research Part C: Emerging Technologies, 95, pp. 320–334.
LISTED IN THE AHFE DIGITAL BOOKSTORE CATALOGUE
Explore the complete digital volume
Human Factors in Transportation
Read this individual research paper free through the original publisher, or explore the full digital proceedings book.
ISBN 978-1-958651-71-1
Explore this ISBN in the AHFE Bookstore ↗Listed in the July 2026 bookstore catalogue; search by ISBN to confirm current availability · Digital book purchase optional