Software systems are rapidly increasing and diversifying due to technological innovations such as IoT, artificial intelligence, and blockchain. Accordingly, automatic analysis of software logs has recently attracted particular attention as a research area to ensure system reliability. Currently, in the research domain, anomaly detection in text logs using CNN, LSTM, and Transformer-based DNN models has shown high accuracy of over 90%. However, contrary to these excellent results, there are reports that it has not been used in the field of the software development field. We predict that the reason for this lies in the way the models are evaluated and, in the datasets, so we investigate using a representative anomaly detection model and the common dataset BGL. First, we investigate the effect of the splitting ratio of the dataset. As a result, we confirm that the accuracy decreases as the number of unknown anomaly logs increases. As a result, we identify features that are over-learned in all supervised learning models. In addition, we validate the generality of the model with the validation datasets and learning curves. The results show signs of overfitting in both supervised and unsupervised learning models. These results suggest that the composition of the dataset used affects the accuracy of the log-text anomaly detection model. Therefore, we plan to create a dataset with multiple anomaly patterns based on the logs used in the software development domain and create a model that can detect anomalies with the created dataset.
Due to technological innovations such as IoT, AI, and blockchain, software systems are rapidly increasing and diversifying. Accordingly, automatic anal- ysis of software logs has recently attracted particular attention as a research area to ensure system reliability. Currently, in the research domain, anomaly detection in text logs has shown high accuracy of over 90% (Le et al., 2022) using CNN, LSTM, and Transformer-based DNN models. However, contrary to these excellent results, there are reports that it has not been used in the field of software development field (Chen et al., 2022).
Investigation of Weaknesses in Typically Anomaly Detection Methods 279
One of the reasons for this is that in the field of software logging anomaly detection, there are many parameters related to experimental methods. For example, when dividing a dataset, you can shuffle all the datasets first, then divide them into a test dataset and a training dataset, or not. When the dataset is shuffled in advance, log data in chronological order are mixed, so logs with various chronological patterns, regardless of past and future, are sorted into the training and test datasets. In addition, there are two options for calculat- ing anomalies: by session grouping or by Window grouping. Session grouping divides time-series log data by time (e.g., every 6 hours), while window group- ing divides data by fixed windows and slides (e.g., window 10, slide 1). When comparing the accuracy of session grouping and window grouping, it has been reported that window grouping is less accurate (Le et al., 2022). This is thought to be because window grouping is more difficult. After all, it requires a calculation of anomalies in finer units.
Since the software is improved every day, considering the use of anomaly detection systems in the development field, it is necessary to be able to detect anomalies in unlearned logs and as small a unit as possible.
Therefore, we conducted experiments with the following two objectives.
1. Verification of accuracy with different data split ratios. We can validate accuracy with varying proportions of unknown logs in the test data set. 2. Experiments using the Validation dataset and evaluation of overlearning using learning curves. The benchmark study has not been used in the validation dataset.
EVALUATED MODELS In the field of log anomaly detection, there are many models including super- vised learning (CNN (Lu et al. 2018), LSTM (Zhang et al. 2019)) and unsupervised learning (Transformer (Nedelkoski et al. 2020)). In this exper- iment, we evaluated three models - CNN, LSTM, and Transformer - from the Toolkit published by Chen et al. (Chen et al., 2022), which comprises six representative anomaly detection methods. This Toolkit allows for flex- ibility in model setup, including the ability to modify the loss function and determine whether or not to incorporate semantic information from the logs. We exclusively utilized sequential information in this experiment since our experimental setup lacked the necessary computational resources to handle semantic information. Notably, Chen et al. reported comparable accuracies with and without semantic information.
1. Supervised Models Convolutional Neural Network (CNN): The input logs are converted to Id and then to vectors using logkey2vec, which are subsequently fed into the CNN. According to their findings, they achieved an F-measure of 0.98 on the HDFS dataset. Attentional Bidirectional Long Short-Term Memory (BiLSTM): This approach represents log events as fixed-dimensional semantic vec- tors and employs an attention-based Bi-LSTM classification model to detect anomalies.
2. Unsupervised Models Transformer: Existing approaches lack generalization to new, unseen log samples. To overcome this issue, they proposed a novel anomaly detection method, Logsy, based on a self-attention encoder network for hemispherical classi- fication. They formulated the log anomaly detection problem to discrim- inate between normal training data from the target system and samples from an auxiliary log dataset easily accessible from other systems.
EXPERIMENTAL METHOD
1. Dataset:
This experiment used the BGL dataset collected on the commonly used Blue Gene/L supercomputer system. The log data is tagged with anomaly logs. The dataset is from the Loghub (He et al. 2020), repository, which provides a large collection of log datasets for log analysis by AI. 2. Dataset Split Ratio: An Evaluation was conducted using the following three patterns of data set proportions.
2.1. Training dataset : Test dataset = 90[%] : 10[%] 2.2. Training dataset : Validation dataset : Test dataset = 80[%] : 10[%] : 10[%] 2.3. Training dataset : Validation dataset : Test dataset = 90[%] : 5[%] : 5[%] In unsupervised learning model experiments, data with abnormal labels were excluded from the training data. 3. Accuracy Evaluation Method:
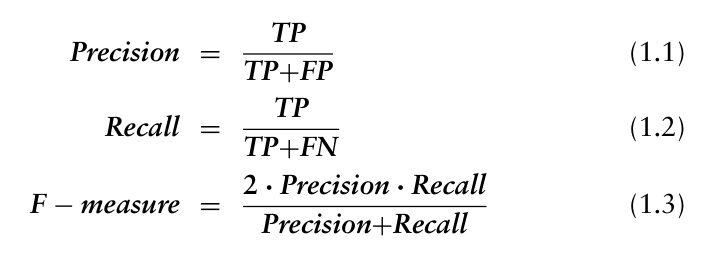
In the accuracy comparison, the accuracy of anomaly detection on the test data is verified using each model after training. Each model is evaluated for classification performance using the F-measure value; The F-measure is an evaluation index that indicates the balance between detection accuracy and the number of anomaly detections. Here, the F-measure is computed as follows.
Equation reproduced from the original PDF.
TP: Anomaly instances correctly classified by the model TN: Normal instances correctly classified by the model FP: Normal instances misclassified by the model FN: Abnormal instances misclassified by the model
Investigation of Weaknesses in Typically Anomaly Detection Methods 281
4. Learning Curve:
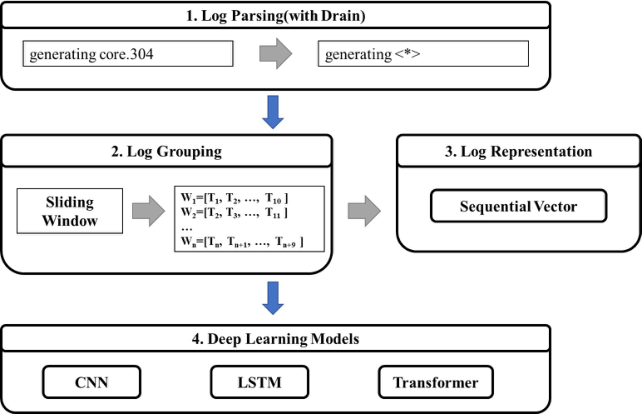
Each set of training consisted of one epoch and was evaluated for accu- racy using training and validation data. The study range included epochs 1 through 10. In experiments without a validation set, the test data was evaluated as the validation set. 5. Anomaly Detection Method The flow of the anomaly detection method is shown in Figure 1. First, logs are converted to a template by Drain (He et al. 2017). Next, Templates are grouped with fixed window = 10 and sliding = 1. After converting them to Sequential Vectors depending on the model, Deep Learning input is used to detect anomalies (see Figure 1).
Figure 1: The flow of the anomaly detection method.
EXPERIMENTAL RESULTS We conducted five trials to eliminate errors in each experiment and evaluated the results using their average.
1. Dataset Split Ratio
Results showed that a higher proportion of the training dataset resulted in higher accuracy (see Table 1 and 2). While this could be attributed to an increase in the number of learning models, we also investigated the number of unknown logs that could affect the results. Table 3 presents the results of this investigation. The Anomaly detection method registers logs in a log2id dictionary during the learning phase, and all logs outside the dictionary are assigned the same id = 0 during the testing phase. We observe a significant decrease in the number of anomaly logs from 9 to 3, and the total number of anomaly logs decreased greatly from 24284 to 3 (see Table 3).
Table 1. Results of dataset with sprit ratio = 80:10:10 (without validation / with validation).
Table 3. Types of logs included in the test dataset.
Table available in the original PDF paper.
Dataset Sprit Ratio Normal types Anomaly types Total anomaly logs 80:10:10 681 9 24284 90:5:5 452 3 3
Therefore, we can infer that the high evaluation accuracy in the 90% train- ing data dataset is due to the extremely low number of anomaly logs. In contrast, the results of the dataset with 80% training data showed a sig- nificantly low recall score, indicating that more anomalies were incorrectly predicted as normal. This result suggests the onset of overfitting.
We can also see that Transformer, which is supervised learning, has low Precision, while CNN and LSTM, which are supervised learning, have low Recall (see Table 1 and 2).
2. Evaluation Using Validation Dataset and Learning Curve
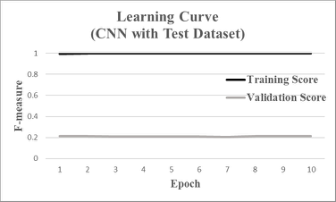
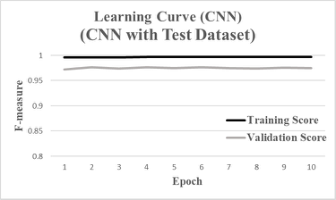
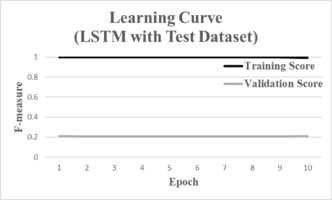
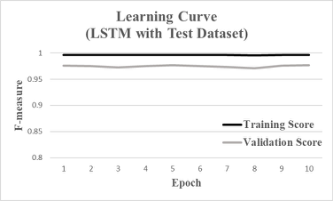
The results are presented in Figure 2 through Figure 5. Upon examining the learning curve, it is observed that the accuracy remains stable after the first epoch, indicating signs of overfitting (see Figure 2 through Figure 5).
It can be observed that the accuracy of LSTM drops significantly when using the Validation dataset. Moreover (see Table 2), the learning curve
Figure 2: Learning curve for CNN with split ratio of 80: 10: 10.
Investigation of Weaknesses in Typically Anomaly Detection Methods 283
Figure 3: Learning curve for CNN with split ratio of 90 5 5.Figure 4: Learning curve for LSTM with split ratio of 80: 10: 10.
shows that the model is overfitting to the validation dataset (see Figure 2 through Figure 5).
Figure 5: Learning curve for LSTM with split ratio of 90 5 5.
CONCLUSION
In this experiment, we investigated the reasons why anomaly detection meth- ods using DNN are not widely used in development sites. Current typical anomaly detection models have a high probability of judging an anomaly log as normal when Window grouping is used. In addition, when Validation data is used, the model over-fits the Validation data, and the learning curve is sta- ble from the first epoch onward. Based on the above results, it is highly likely that overlearning is occurring. However, since only one type of BGL data set was evaluated in this experiment, it is impossible to determine whether it is truly overlearning or not. In the anomaly detection area, only one or two data sets for each type make multifaceted evaluation difficult. Therefore, we plan to create a wide variety of datasets and investigate the feasibility of using many anomaly detection systems in the development field.
ACKNOWLEDGMENT
This work is supported by a grant from Panasonic System Design.
REFERENCES
Chen. Z, Liu. J, Gu. W, Su. Y, and Lyu. M, (2022) “Experience Report: Deep Learning-based System Log Analysis for Anomaly Detection”, Arxiv Website: https://arxiv.org/pdf/2107.05908.pdf He. P, Zhu. J, Zheng. Zm and Lyu. M (2017) “Drain: An Online Log Parsing
Approach with Fixed Depth Tree”, 2017 IEEE International Conference on Web Services (ICWS). He. S, Zhu. J, He. P, R. M, and Lyu. M, (2020) “Loghub: A Large Collection of System Log Datasets towards Automated Log Analytics”, Arxiv Website: https: //arxiv.org/pdf/2008.06448.pdf Lu. S, Wei. X, Li. Y, and Wang. L, (2018) “Detecting Anomaly in Big Data System
Logs Using Convolutional Neural Network”, 2018 IEEE 16th Intl Conf on D Le. V and Zhang. H, (2022) “Log-based anomaly detection with deep learning: how far are we?”, ICSE ‘22: Proceedings of the 44th International Conference on Software Engineering, pp. 1356–1367. Nedelkoski. S, Bogatinovski. J, Acker. A, Cardoso. J and Kao. O, (2020) “Self-
Attentive Classification-Based Anomaly Detection in Unstructured Logs” 2020 IEEE International Conference on Data Mining (ICDM). Zhang. X, Xu. Y, Zhang. H, Dang. Y, Xie. C, Yang. X, Chen. J, He. X, Yao. R, Lou. J, Chintalapati. M and Shen. F, (2019) “Robust log-based anomaly detection on unstable log data”, ESEC/FSE 2019: Proceedings of the 2019 27th ACM Joint Meeting on European Software Engineering Conference and Symposium on the Foundations of Software Engineering, pp. 807–817.
Read this individual research paper free through the original publisher, or explore the full digital proceedings book.
ISBN 978-1-958651-87-2
Explore this ISBN in the AHFE Bookstore ↗Listed in the July 2026 bookstore catalogue; search by ISBN to confirm current availability · Digital book purchase optional