In Japan, the number of diabetics is rapidly increasing due to changes in lifestyle and social environment. In the early stages of diabetes, patients have few subjective symptoms and the disease may be left untreated for a long period of time. However, if metabolic abnormalities in diabetes persist over a long period of time, the likelihood of developing complications increases. Therefore, it is important to complete the diagnosis of diabetes as early as possible. The use of plantar thermography images is expanding as one way to determine diabetes. However, conventional techniques have not been evaluated to take into account the difficulties of acquiring images in actual use environments, such as out-of-focus or low-resolution cameras. This evaluation is essential in a practical diabetes detector. In this method, we created various simulated images assuming realistic usage environments and devices, and evaluated their impact on diabetes determination accuracy using Recall, Precision, and F-measure. The diabetes determination method uses DenseNet201, a convolutional neural network specifically designed for image classification. As a model, training is performed using only the source image, either single-foot images or both-foot images. The dataset consists of plantar thermogram images of 122 diabetic and 45 non-diabetic patients published by Hernandez et al. Due to the small amount of training data, the training was augmented with image processing such as rotation and reduction. For the original image, the Recall and F-measure for the single-foot image were 96.4% and 87.1% for the original image, and 100.0% and 78.9% for both-foot images, respectively. Considering the F-measure, the classification with a single foot as input data is relatively more accurate. Furthermore, even at 87.5% reduction, there was no effect of reduced resolution on the accuracy of diabetes determination, indicating that focusing has a significant effect on the accuracy of plantar thermography images.
The number of diabetics in Japan is rapidly increasing due to changes in lifestyle and social environment, and it has become a serious social prob- lem. According to the Ministry of Health, Labor and Welfare’s National Health and Nutrition Survey, the total number of people who are strongly suspected of having diabetes and those who cannot deny the possibility of diabetes is estimated to reach 20 million (Health Service Bureau, Ministry of Health, Labor and Welfare, 2016). Since diabetes has few subjective symp- toms in its early stages, patients themselves will be unaware of the existence of diabetes, and the disease will be left untreated for a long time. Long- term diabetes-related metabolic disorders affect several organs and can lead to three major complications, neuropathy, retinopathy, and nephropathy, as well as foot gangrene. In order to prevent complications, appropriate treat- ment. According to a diabetes survey conducted by the Ministry of Health, Labor and Welfare, about 30% of the 2,363 males surveyed and about 40% of the 3,413 females surveyed have never been tested for diabetes. (Health Service Bureau, Ministry of Health, Labor and Welfare, 2002). In addition, the discoveries of diabetes delay in a large number of cases, since the fre- quency of diabetes examinations is generally low. Therefore, there is a need
Diabetes Diagnosis Using Plantar Thermogram Based on DenseNet 807
for easy diabetes determination. The use of plantar thermography images is expanding as one of the diagnostic methods for diabetes. The main advan- tage of plantar thermography is that it is a non-invasive method and can acquire a large number of image elements in a very short time compared to other techniques that measure temperature. The plantar temperature dis- tribution in non-diabetic patients has been reported to have an arc-shaped maximum temperature and a symmetrical butterfly pattern compared to dia- betic patients with various plantar thermogram patterns (A W Chan, I A MacFarlane, D R Bowsher, 1991). This suggests that it is possible to deter- mine whether a patient has diabetes by acquiring plantar thermogram images with an infrared camera and using deep learning. However, conventional dia- betes determination techniques using plantar thermograms have not been evaluated taking into account problems that occur when acquiring images in real-world operating environments, such as images that are out of focus or taken with low-resolution cameras. This evaluation is essential for the prac- tical application of diabetes detectors. Therefore, we proposed a diabetes diagnosis method based on deep learning. In this method, created various simulation images assuming realistic usage environments and equipment, and evaluated the impact on diabetes diagnosis accuracy.
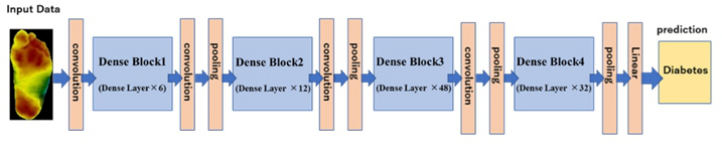
DIABETES DETERMINATION METHOD USING PLANTAR THERMOGRAM IMAGES In this study, plantar thermogram images are used as input images, but they are evaluated using images that have been lowered in resolution or blurred by various image processing methods. The diabetes determination method uses DenseNet201, a convolutional neural network specialized for image classification. Advantages of DenseNet include the reduction of the van- ishing gradient problem and enhancement of feature transfer compared to ResNet which sums the results of skipping between blocks. DenseNet201 is structured using “Dense Block” as the main component, with dense skip con- nections between all Dense Layers as Figure 1. As a model for DenseNet201, training is performed using only the source image, either single-foot images or both-foot images.
Figure 1: Structure of Densenet201.
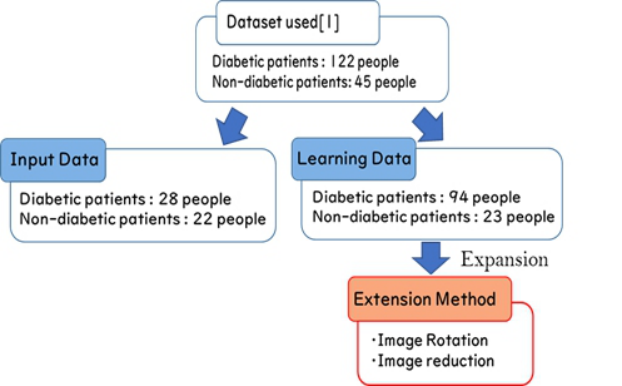
In this study, we used a total of 334 plantar thermogram images of both foot of 122 diabetic and 45 non-diabetic patients published by Hernandez- Contreras et al (Hernandez-Contreras et al., 2016). Figure 2 shows the contents of the dataset. Among them, 94 diabetics and 23 non-diabetics were used as training data, and 28 diabetics and 22 non-diabetics were assigned as
input data. Since the number of training data is small, we performed image processing such as rotation and reduction to expand the number of images to 1542 for a single foot and 771 for both foot. The input data is 100 images for a single foot and 50 images for both foot.
Figure 2: Contents of dataset.
In this study, the Confusion Matrix shown in Table 1 was used as the evaluation index, with Recall, Precision, and F-measure.
Table 1. Confusion matrix.
Table available in the original PDF paper.
Predicted Class Negative Positive
Actual Class Negative True Negative:TN False Positive:FP Positive False Negative:FN True Positive:TP Precision = TP TP + FP[%] (1)
Equation reproduced from the original PDF.
Precision + Recall[%] (3)
PROCESSING OF EVALUATION DATA BY IMAGE PROCESSING Assuming the practical use of a diabetes detector, created evaluation data using various image processing methods in Python. Table 2 shows the assumed situation and the image processing performed. The datasets used in this study were taken in high resolution and under specific conditions, but thermography cameras are too expensive, and the lower the price, the poor
Diabetes Diagnosis Using Plantar Thermogram Based on DenseNet 809
the resolution and number of pixels. Considering the practical use of diabetes detectors, it is necessary to carry out evaluations that take into consideration the actual usage environment, such as the effects of focus shifts and light sources in thermography cameras.
Table 2. The assumed situation and the image processing.
Table available in the original PDF paper.
Assumed situation Image processing Out of focus Gradation Using a camera with poor resolution Reduction Pixel Using a camera with poor image quality Resolution Degration Noise rides Noise Emphasis on temperature distribution Gamma Correction Shooting in non-specific environments Change background color
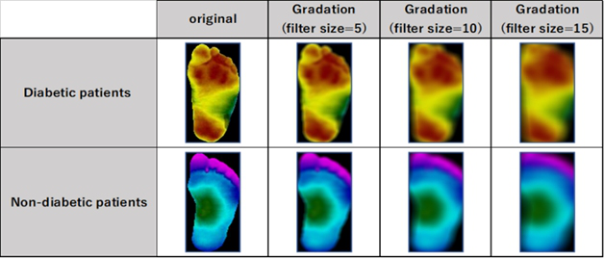
The gradation image processing uses the Python libraries NumPy and Pil- low. The degree of blurring is done by varying the filter size by 5 for filter size = 5, 10, 15. First, the image is read and the RGB values for each pixel are stored as a two-dimensional array (vertical and horizontal). Next, the RGB values of the adjacent vertical and horizontal pixels for each pixel are acquired for the filter size, and the acquired RGB values are reshaped to the square of the filter size in the rows and 3[r, g, b] in the columns as a prepara- tion for averaging. Then, after calculating the average value of each of R, G, and B with the mean function, the calculated average value is set as the RGB value of the corresponding pixel and generated.
The Resolution Degradation image processing uses the Python libraries Pillow. The degree of pixel reduction is done for filter size = 5,10,15 by varying the filter size by 5. First, the image is loaded and converted into a 3-dimensional array whose size is image height x image width x 3 for ease of manipulation. The RGB value of each pixel obtained is an array with 3[r, g, b] elements. Next, starting from the position (x, y), a smaller image is cut from the original image by the set length and width filter size, and the value of each pixel in the smaller image is stored in the array. Then, the number of the pixel with the largest value of r+g+b in the small image is obtained, and a monochromatic image is fitted to each cropped location starting from (x, y) to generate an image.
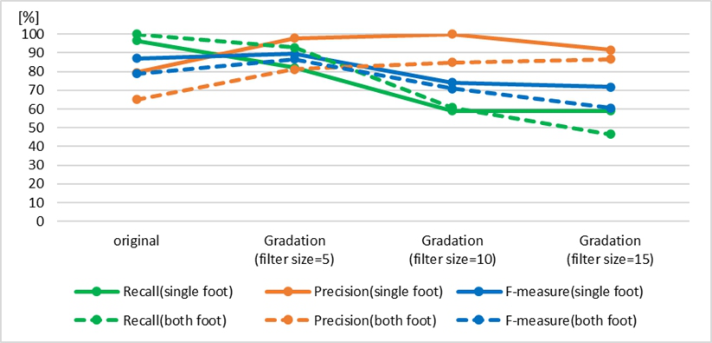
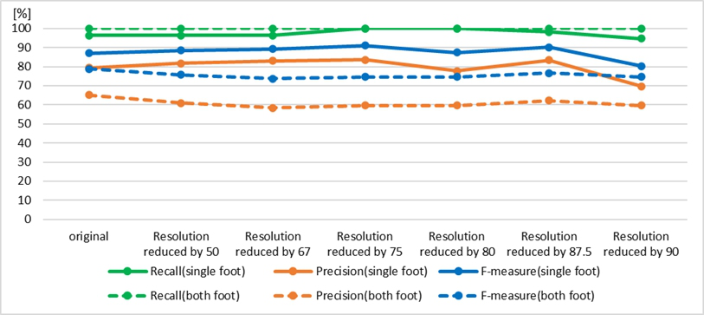
EVALUATION RESULTS For the original image, the Recall, Precision and F value for the single- foot image were 96.4%,79.4% and 87.1% for the original image, and 100.0%, 65.1% and 78.9% for both-foot images, respectively. Considering the F-measure, classification with a single foot as input data is relatively more accurate.
For the gradationed image, the result of creating evaluation data is shown in Figure 3 and the result of classification is shown in Figure 4. The accuracy of the determination of diabetes was found to decrease in proportion to the degree of gradation.
Figure 3: Results of evaluation data generation (gradation).Figure 4: Results of classification (gradation).
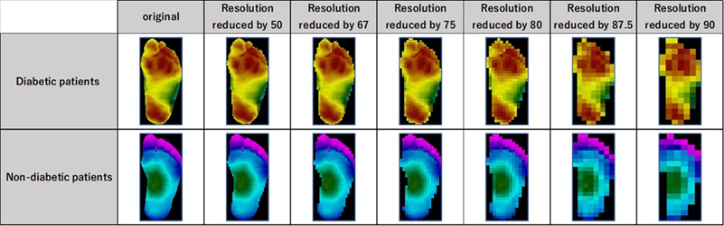
For the Degraded image of the resolution, the result of creating evaluation data is shown in Figure 5 and the result of classification is shown in Figure 6. They show that found that resolution degradation had little effect on the accuracy of diabetes determination.
Figure 5: Results of evaluation data generation (resolution degradation).
Diabetes Diagnosis Using Plantar Thermogram Based on DenseNet 811
Figure 6: Results of classification (resolution degradation).
CONCLUSION
In this paper, we proposed a diabetes determination method using DenseNet201 and evaluated its impact on the accuracy of diabetes determi- nation by creating various simulated images under the assumption of actual usage environments and devices. As a result, it was found that plantar ther- mogram images, which are the input data for the diabetes judging instrument, are better suited with a single foot. Furthermore, This paper found that care must be taken when taking plantar thermogram images because the use of a low-resolution thermographic camera has little effect on accuracy, and focusing has a significant impact.
Future efforts will be conducted by acquiring thermogram images with cameras and sensors, and the optimal acquisition method and camera will be selected. Furthermore, since the number of plantar thermogram images used for training data in this study was small, we plan to augment the training data by actually acquiring plantar thermogram images.
ACKNOWLEDGMENT
I would like to thank my deepest gratitude to Professor Yoshihisa Nakatoh for her guidance and encouragement in carrying out this research.I would also like to thank my sincere gratitude to Assistant Professor Yujie Li and Mr. Hiroki Uchida for their enthusiastic cooperation and guidance.
REFERENCES
A W Chan, I A MacFarlane, D R Bowsher. (1991), “Contact thermography of painful diabetic neuropathic foot”. D. Hernandez-Contreras, H. Peregrina-Barreto, J. Rangel-Magdaleno, J. Gonzalez-
Bernal. (2016), “Narrative review: Diabetic foot and infrared thermography”. Health Service Bureau, Ministry of Health, Labor and Welfare. (2002), Diabetes Survey Report. Ministry of Health, Labor and Welfare website: https://www.mh lw.go.jp/shingi/2004/03/s0318-15.html. Health Service Bureau, Ministry of Health, Labor and Welfare. (2016), National
Health and Nutrition Survey. Ministry of Health, Labor and Welfare website: https://www.mhlw.go.jp/bunya/kenkou/eiyou/h28-houkoku.html.
Read this individual research paper free through the original publisher, or explore the full digital proceedings book.
ISBN 978-1-958651-87-2
Explore this ISBN in the AHFE Bookstore ↗Listed in the July 2026 bookstore catalogue; search by ISBN to confirm current availability · Digital book purchase optional