The worldwide epidemic of the Corona Virus Disease 2019 is forcing many people to stay indoors, indirectly causing more people to gain weight. As a result, people's awareness of the movement grew. The most popular form of simple exercise is walking, and many people use wearable devices to record their movements. Existing wearable devices do not take into account the wearer's walking speed or the road condition, resulting in poor calorie counting accuracy. In this study, we use acceleration and angular rate sensors for gait state estimation. We create a device using an Arduino Uno and a 9-axis sensor module and experimented with the device attached to the waist, thigh, and ankle of the subject. Based on the features obtained here, the objective is to minimize the computational process in the system. We focus on the "x-axis," "y-axis," and "z-axis" of each sensor, and verify what characteristics were observed in various walking conditions. Experiments were conducted on three patterns of "walking," "fast walking," and "running" in three road conditions of "level ground," "uphill," and "downhill," and the feature values were compared. The experiments reveal that the gait state is mainly represented by the y-acceleration and x-angular velocity. Experimental results also confirm the validity and reliability of the proposed method.
The new coronavirus, which began to spread in 2019, has forced many peo- ple around the world to refrain from going out for long periods. This effect caused many people to gain weight throughout the voluntary curfew period. In the survey conducted in 2022, the percentage of people who gained weight was about three times that of those who lost weight, and the percentage of those who said they needed to lose weight regularly was about five times that of those who said they had lost weight. The most popular exercise for weight loss is walking, and its implementation rate has been increasing every year. However, the accuracy of “fitness trackers” used to record various exercises, including walking, is currently insecure. That said, calorie counts on fitness trackers are not highly accurate. A previous study found that calorie counts were only 42 percent accurate at the highest levels. It is considered that the accuracy of calorie counting depends on conditions such as where the device
Estimation of Gait Conditions Using Acceleration and Angular Velocity Sensors 879
is worn, where the user is walking, and how fast the user is walking. This problem should be improved, as calorie counting is an important aspect of weight management. I consider that this problem could be solved by using fitness trackers to estimate the gait state of the wearer while referring to the gait state and the number of steps taken to calculate the calories. Therefore, this study examines the possibility of using fitness trackers to estimate the gait state of the wearer. The acceleration and angular velocity sensors that most fitness trackers on the market today are equipped with are used to cal- culate various gait state features. Another objective of this study is to examine the effective sensor mount position for gait state estimation based on the test data.
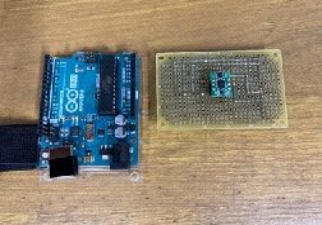
PROPOSED METHOD The device used in the experiments was made by placing a small board on top of the Arduino Uno and mounting a 9-axis sensor module on the board.
The equipment used is shown in Figure 1. Serial communication was per- formed through a direct connection between the created device and a PC, and acceleration and angular velocity data were recorded in text format. Acceler- ation and angular velocity data were recorded. The data were acquired at 0.1 ms intervals. In the experiment, this device is worn at the “waist,” “thighs,” and “ankles” for measurement. This assumes that the fitness tracker is worn at the waist of the pants, in the pocket, and at the ankle.
Figure 1: Equipment used in the experiment.
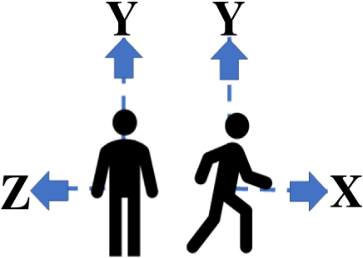
The axial direction of the sensor in the experiment is shown in Figure 2. The items to be discriminated against are as follows.
Measurements of the acceleration sensor and the angular rate sensor attached to the waist can determine the forward/backward motion of the upper body by the amount of change in the X-axis and the left/right motion of the upper body by the amount of change in the Z-axis.
Measurements of the accelerometer and angular rate sensor attached to the thigh, the amount of change in the X-axis can determine hip flexion and extension, and the amount of change in the Z-axis can determine hip adduction and abduction motion.
Measurements of the accelerometer and angular rate sensor attached to the ankle, the amount of change in the X-axis can determine flexion and
extension of the ankle joint, and the amount of change in the Z-axis can determine adduction and abduction motion of the ankle joint.
Figure 2: Axial direction of the sensor.
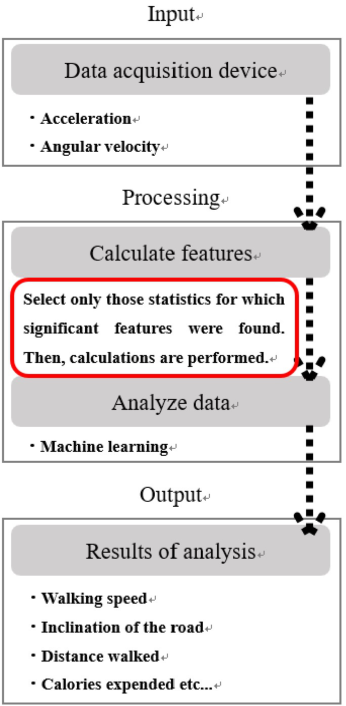
A schematic of the final system is shown in Figure 3. This experiment focuses on the points circled in red.
Figure 3: Axial direction of the sensor.
Estimation of Gait Conditions Using Acceleration and Angular Velocity Sensors 881
EXPERIMENTAL METHOD In the experiment, two male subjects in their 20s were tested walking straight ahead on a paved road. The walking test began with a right foot step and ended with the left foot grounded at the 10th step. When testing, measure- ments are taken under different conditions of “walking speed” and “road slope”. These detailed settings are shown in Table 1. A total of nine test pat- terns were prepared, combining “walking speed” and “road slope” items. Details of the patterns are shown in Table 2. In the experiment, sensor values obtained from the device were organized in Excel and analyzed by creating a frequency distribution plot (histogram) or scatter plot of sensor values using Python. The average of five test data for each pattern was used to organize the data. We compared the data under different conditions of “walking speed” and “slope of the road.” Frequency distribution charts (histograms) or scatter plots of acceleration and angular velocity data were compared side by side, and evaluated by visualizing the number of features for each condition.
Table 1. Walking test conditions.
Table available in the original PDF paper.
Environment of the experiment test subject two males (20s) pattern walking, fast walking, running road condition flat road, uphill, downhill (5% slope) position waist, thigh, ankle number of steps 10 steps number of times each test 5 times
Table 2. Walking test pattern.
Table available in the original PDF paper.
Pattern name Walking speed Road Condition A1 Walking A2 Fast walking Flat load A3 Running
B1 Walking B2 Fast walking Uphill B3 Running C1 Walking C2 Fast walking Downhill C3 Running
EXPERIMENTAL RESULTS In this chapter, after making frequency distribution plots (histograms) of all test data, comparisons were made by focusing on sensors and acceleration and angular velocity data that showed significant differences in feature val- ues in each comparison pattern. In all graphs, the unit of the horizontal axis is [G] for acceleration and [deg/sec] for angular velocity. Below are the results
for each of the following conditions: “different walking speeds,” “different road slopes,” and “different attachment positions”.
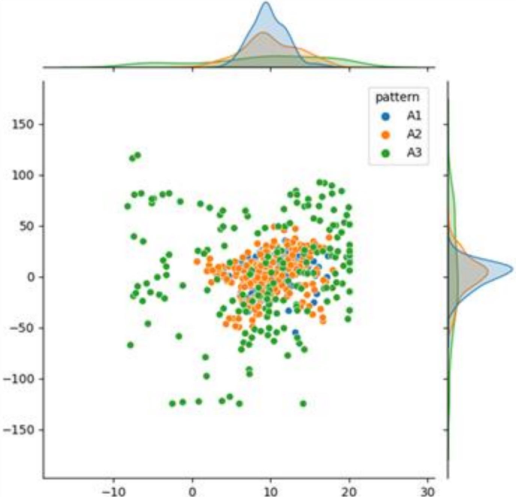
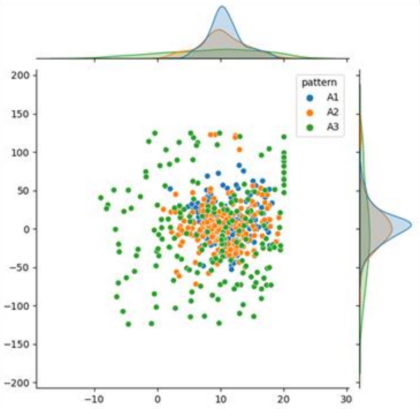
A) When the walking speed is different a) Wearing position: Waist Subject A showed characteristics in the frequency distribution chart of “y acceleration” and Subject B in “y acceleration” and “x angular velocity”. These characteristics were most pronounced in Subject B’s walking test on a flat road. The scatter plot of the sensor values at that time is shown in Figure 4. The horizontal axis is the y-acceleration and the vertical axis is the x-angular velocity. It can be seen from the figure that the scatter of the values tends to increase as the walking speed increases. It is also considered that “y-acceleration” and “x-angular velocity” are effective sensor values for estimating the state at the waist.
Figure 4: Scatter plot of sensors attached to the waist.
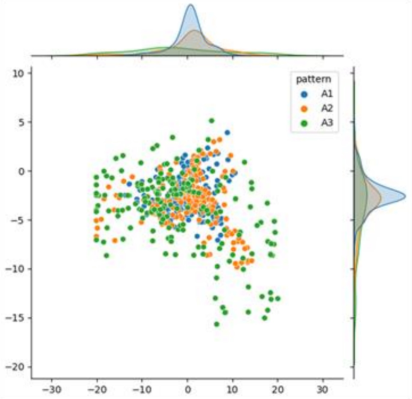
b) Wearing position: Thigh Subject A showed characteristics in the frequency distribution chart of “y acceleration”, and Subject B in “x acceleration”, “y acceleration” and “x angular velocity”. These characteristics were most pronounced in Subject B’s walking test on a flat road. The scatter plot of the sensor values at that time is shown in Figure 5. The horizontal axis is the y-acceleration and the vertical axis is the x-angular velocity. It can be seen from the figure that the scatter of the values tends to increase as the walking speed increases. It is also considered that “y acceleration” and “x angular velocity” are effective sensor values for estimating the state at the thigh.
Estimation of Gait Conditions Using Acceleration and Angular Velocity Sensors 883
Figure 5: Scatter plot of sensors attached to the thigh.
c) Wearing position: Ankle Subject A showed characteristics in the frequency distribution chart of “x acceleration”, “z acceleration” and “x angular velocity” and Subject B in “x acceleration” and “z acceleration”. These characteristics were most pronounced in subject B’s walking test on a flat road. The scatter plot of the sensor values at that time is shown in Figure 6. The horizontal axis is the x-acceleration and the vertical axis is the z-acceleration. It can be seen from the figure that the scatter of the values tends to increase as the walking speed increases. It is also considered that “x-acceleration” and “z-acceleration” are effective sensor values for estimating the state at the ankle.
Figure 6: Scatter plot of sensors attached to the ankle.
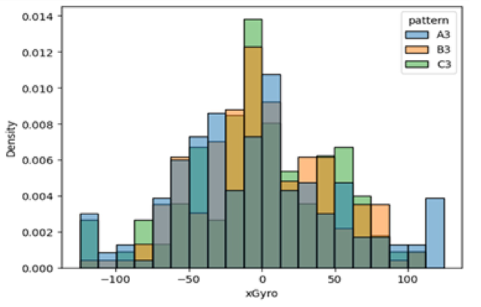
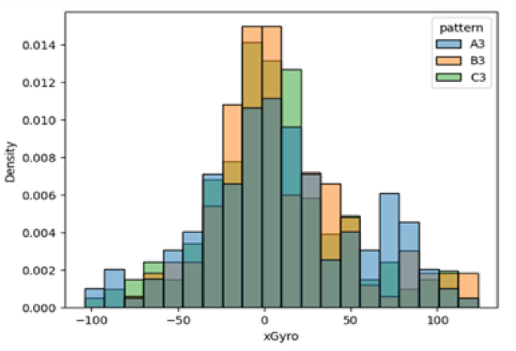
B) When the slope of the road is different a) Wearing position: Waist Subject A showed no characteristics found, and Subject B showed char- acteristics in the “x angular velocity” frequency distribution chart. These characteristics were most pronounced during the running of Subject B’s walk- ing test. The figure is shown in Figure 7. It can be seen from the figure that the scatter of “x angular velocity” tends to gather in the center when walking on a sloped path. It is also considered that “x angular velocity” is an effective sensor for estimating the state at the waist.
Figure 7: Histogram of sensors attached to the waist.
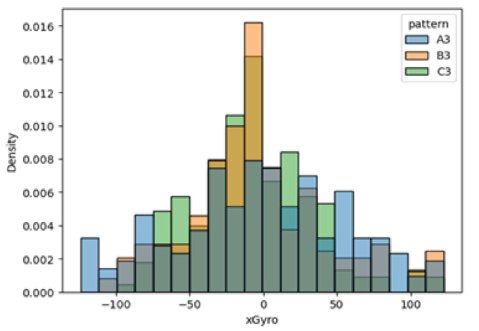
b) Wearing position: Thigh Subject A showed a characteristic in the frequency distribution chart of “x angular velocity” and Subject B in “x angular velocity”. These charac- teristics were most pronounced in Subject A’s walking test during running. The figure is shown in Figure 8. It can be seen from the figure that the scat- ter of “x angular velocity” tends to gather in the center when walking on a sloped path. It is also considered that “x angular velocity” is an effective sensor for state estimation at the thigh.
Figure 8: Histogram of sensors attached to the thigh.
Estimation of Gait Conditions Using Acceleration and Angular Velocity Sensors 885
c) Wearing position: Ankle Subject B showed no characteristics found, while Subject A showed charac- teristics in the frequency distribution chart for “x angular velocity”. These characteristics were most pronounced in Subject A’s walking test during run- ning. The figure is shown in Figure 9. It can be seen from the figure that the scatter of “x angular velocity” tends to gather in the center when walking on a sloped path. It is also considered that “x angular velocity” is an effective sensor for state estimation at the thigh.
Figure 9: Histogram of sensors attached to the ankle.
CONCLUSION
In this study, we examined the possibility of using acceleration and angular velocity sensors to estimate walking speed and road incline during walking and verified the effectiveness of each sensor through walking tests. The char- acteristics of each sensor at different walking speeds are summarized below. The scatter of “y acceleration” and “x angular velocity” values tended to increase as the walking speed increased for both the waist and thigh-mounted sensors. The scatter of “x-acceleration” and “z-acceleration” values tended to increase as the walking speed increased for the ankle-mounted sensor. The characteristics of each sensor at different road inclinations are summarized below. For the sensors attached to the waist, thighs, and ankles, the scatter of “x angular velocity”tended to gather in the center when all walked on a road with an incline. Through this study, it has also been suggested that the hip or thigh may be an effective sensor attachment site for gait state estimation.
Through this study, we can infer the effective factors for identifying the walking speed of sensor wearers. However, few data showed characteristic differences in acceleration and angular velocity values in the walking test at different road inclinations, and the only data that did show characteris- tics of “x angular velocity” showed only minor differences. Therefore, it can be said that there is insufficient material for judgment in this test to infer
the factors which determine the slope of the road. Further research could be conducted by comparing the data obtained from the sensors by conducting walking tests on gentle and steep slopes. Other conditions for the gait testing, such as ascending and descending stairs and sitting, remain as future work to be done beyond the conditions used in this study.
ACKNOWLEDGMENT
I would like to express my deepest gratitude to Professor Yoshihisa Nakatoh. I would also like to thank him for his guidance and encouragement in carry- ing out this research. I would like to thank Assistant Professor Yujie Li and Hironori Uchida for their enthusiastic cooperation and guidance.
REFERENCES
Daniel Fuller, Emily Colwell, Jonathan Low, Kassia Orychock, Melissa Ann Tobin, Bo Simango, Richard Buote, Desiree Van Heerden, Hui Luan, Kimberley Cullen, Logan Slade, and Nathan G A Taylor. (2020). Reliability and Validity of Com- mercially Available Wearable Devices for Measuring Steps, Energy Expenditure, and Heart Rate: Systematic Review. Eatori Corporation, -Eatori conducts survey on “diet”-. Eatori Corporation Website:
https://newscast.jp/news/9416389 H. Kurasawa, Y. Kawahara, H. Morikawa, and T. Aoyama. (2006). Posture Estimation Method Using 3-Axis Acceleration Sensor Considering Sensor Mounting Location. Kyoko Numa, Tomoyuki Yashiro. (2011). Proposal of a State Estimation Method
for Pedestrians Using SVM. Ministry of Health, Labour and Welfare, Dictionary of Health Terms (2019) New Balance Japan Inc., One in two people in their 20s walk habitually. Walking is clearly on the rise among the younger generation. New Balance Japan Inc. Website: https://prtimes.jp/main/html/rd/p/000000863.000029460.html Sasagawa Sports Foundation, Walking and strolling rates. Sasagawa Sports Founda-
tion Website: https://www.ssf.or.jp/thinktank/sports_life/data/walking.html Tanita Corporation, Survey on Changes in Living Habits and DYET. (2022). Tanita Corporation Website: https://api-img.tanita.co.jp/files/user/news/press/pdf/2022/ lifestyle_research.pdf?_ga=2.220890513.886592083.1675314581-152138899. 1675314581
Read this individual research paper free through the original publisher, or explore the full digital proceedings book.
ISBN 978-1-958651-87-2
Explore this ISBN in the AHFE Bookstore ↗Listed in the July 2026 bookstore catalogue; search by ISBN to confirm current availability · Digital book purchase optional