The study proposes a digital stethoscope to assist physicians who are not respiratory specialists to diagnose specific diseases from lung sounds in local areas which lacks specialists and advanced medical equipment. The digital stethoscope presents a spectrogram of the auscultatory sound that illustrates changes in its feature values to visually present the area where the abnormal sound occurs. It not only assists non-specialist physicians in diagnosis but also provides easier explanations for patients. Accurate auscultation requires specialized knowledge and experience. Non-specialist physicians have difficulty distinguishing the characteristics of abnormal sounds among lung sounds which include a wide variety of sounds. Even if they find an abnormal sound suspected to be a disease, physicians will provide patients with only oral diagnosis explanations which would prevent patients from understanding their conditions in depth. The proposed method converts lung sound data collected by a digital stethoscope into a visual spectrogram showing the frequency features. The method uses the short-time Fourier transform as a method to extract the frequency features of lung sounds for each short segment in the whole time series of the lung sound. The converted spectrogram is used to detect disease-specific abnormal sounds comprehensively. The degree of abnormal sounds that appears in the inspiratory and expiratory phases varies with disease progression. The proposed method identifies abnormal sounds in the inspiratory and expiratory phases. Based on the inspiratory and expiratory phases recorded in the diagnostic by specialists, the method derives whether the abnormal sound occurs in each phase. It enables the method to detect specific respiratory diseases along with the degree of their progression. Furthermore, it also allows the method to visually present the location of detected abnormal sounds to patients. This paper uses a short-time Fourier transform as a method for extracting frequency features of lung sounds in a certain range. It also shows that feature extraction as a spectrogram that emphasizes the low frequency band, which is the human audible range, is effective in assisting the non-specialist physician in diagnosis. This paper prepares experimental data from real diagnoses so that data noise and disease features can be taken into account. The diagnostic accuracy is evaluated with a method of segmenting spectrogram images to extract frequency features at specific times. The method constructs a model for detecting fine crackles using the machine learning algorithm Decision Tree. The experimental results have shown that the accuracy of detecting fine crackles is 0.89. The high accuracy obtained from this model allows us to confirm the effectiveness of the proposed method for supporting for non-specialist physicians to distinguish abnormal sounds. The successful detection of fine crackles in the expiratory or inspiratory phase suggests that the progression degree of the disease could be estimated with the proposed digital stethoscope. The digital stethoscope will make it possible to accurately diagnose respiratory diseases along with a comprehensive explanation of diagnosis results to patients in areas with poor medical facilities. It also provides non-specialists with dependable diagnostic aid.
Currently, lung diseases are generally diagnosed by physicians using a steth- oscope. Auscultation with a stethoscope is a diagnostic method that can be performed easily and quickly in any medical setting (Hafke-Dys et al. 2019). By analysing the data obtained from the digital stethoscope, it is possible to quantitatively analyse the features of respiration and disease (Nguyen et al. 2022). The physician uses a stethoscope to distinguish abnormal lung sounds from normal ones to detect disease. Since lung sounds are much smaller and lower in frequency than the sounds humans hear in daily life, it is difficult for phy- sicians with little experience in auscultation to distinguish the features of abnormal sounds specific to each disease. Much experience is necessary to derive highly accurate diagnostic results from lung sounds (Pramono et al. 2017). In addition, if the physician performing the auscultation gets old, it becomes increasingly difficult to accurately distinguish lung sounds due to age-related hearing loss. A highly accurate diagnostic method is required to provide accurate auscultation for physicians, regardless of skills. It should be independent of their physical abilities.
Digital stethoscopes and analog stethoscopes have one thing in com- mon: they both listen for sound by pressing the chestpiece, which is the
sound-collecting part, against an area close to the organ where sound is gene- rated. Since the sound is heard differently depending on how the chestpiece is held, a certain skill is required to hear the sound accurately. The previous study (Li et al. 2016) (Zulfiqar et al. 2021) used machine learning to identify patients with lung disease with high accuracy from respiration sounds and adventitious sounds collected by digital sound collection technology. The previous study (Brown et al. 2020) used machine learning to predict with high accuracy whether a patient is positive for coronavirus based on respira- tion and coughing sounds. However, these studies have not clarified how to present abnormalities comprehensively to patients as well as to physicians. Researchers (Gurung et al. 2011) showed that the Fourier transform and neural network algorithms can classify wheeze and fine crackle pronunciati- ons present in adventitious sound with about 80% accuracy. Though neural networks often identify with high accuracy, they are computationally expen- sive to run. They require powerful computing environments which is difficult for many clinics to prepare. This technique compromises the advantage of simple and rapid auscultation with a stethoscope.
LUNG SOUND ANALYSIS WITH DIGITAL STETHOSCOPE Target Disease of the Study
Human lung sounds consist of respiratory sounds and adventitious sounds. Respiratory sounds occur due to normal respiration, while adventitious sounds are abnormal sounds produced by respiratory movements when a patient is suffering from a lung disease (Sarkar et al. 2015). Adventitious sounds are heard with different features depending on the part of the body where the sound originates. Adventitious sounds are classified into rales and other adventitious sounds because the proportion of rales is high.
Some of the rales are continuous, while others are discontinuous. They are roughly classified into the following four categories (Bohadana et al. 2014) : coarse crackle with coarse intermittency rale features, fine crackle with fine discontinuity rale features, wheeze with high pitch continuity rale feature, and Rhonchi with bass continuity rale features.
In this study, interstitial pneumonia is targeted as a disease that can be estimated by auscultation using a digital stethoscope. Normal vesicular respi- ratory sounds consist of sounds below about 1200 Hz, with sound peaking mainly below about 100 Hz and a sharp drop in sound energy between about 100∼200 Hz (Sarkar et al. 2015). Fine crackles listened to in interstitial pneumonia consist of sounds of approximately 60∼2000 Hz (Sarkar et al. 2015).
Mel-Spectrogram In this study, short-time Fourier transform is applied to lung sound data obtained from a stethoscope. In the short-time Fourier transform, the spe- ctrum, which is the result of Fourier transforming a signal at a certain time point, is arranged continuously along the time axis. An image representation of these is called a spectrogram.
Respiratory Disease Diagnosis Through Comprehensive Analysis of Spectrograms 575
The spectrogram consists of time, frequency components, and intensity of them. A spectrogram allows us to visualize the time variation of the freque- ncy features of a particular sound (Aviles-Solis et al. 2020). It enables us to capture the features of the sound visually. However, since lung sounds are generally small in amplitude and low in frequency, the features obtained by auscultation are concentrated in the range of small intensity and low freque- ncy. It is difficult to visually present the features of lung sounds as differences in color.
To extract low frequency features, a log-spectrogram applies a loga- rithmic scale to the amplitude of the spectrogram. The study utilizes a mel-spectrogram, which considers that human hearing is sensitive to low-frequency sounds and insensitive to high-frequency sounds. In the mel- spectrogram, the frequencies of the spectrogram are converted to mel, a measure of the perceived height of sound in human hearing, by applying a filter called a mel filter bank to the spectrogram. A mel filter bank achieves higher resolution for the lower frequency components while lower resolution for the higher frequency components.
ASSISTING NON-SPECIALISTS IN DIAGNOSING INTERSTITIAL PNEUMONIA Diagnosis Based on Disease Progression
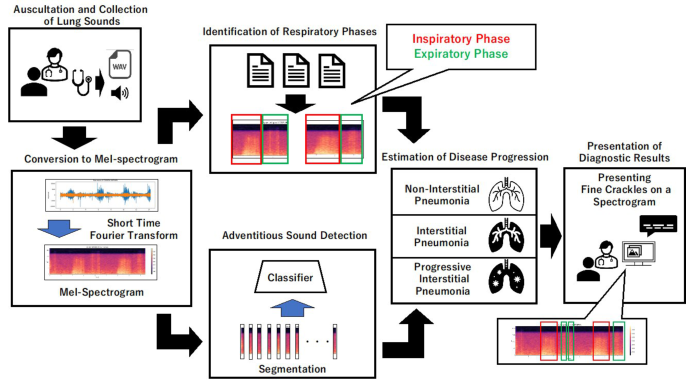
In this study, disease and degree of disease progression are estimated from abnormal sounds in lung sounds heard with a digital stethoscope. The study also proposes a presentation method of detection results to assists non- specialists to diagnose objectively. Figure 1 shows a schematic diagram of the proposed diagnostic method.
First, the physician listens to lung sounds from the patient using a digital stethoscope to sample the discrete signal data. The mel-spectrogram is gene- rated by applying a short-time Fourier transform, filtering, and logarithmic
Figure 1: Diagnostic system to assist non-specialists.
scaling. The spectrogram is divided equally into fine segments. The method detects adventitious sound in the segment to identify the period during which the fine crackles occurred.
In the early stage of interstitial pneumonia, fine crackles generally appear only in the inspiratory phases. To examine it, the physician generally instructs the patient on the timing of respiration during auscultation. The collected lung sound data can be labeled with the start and end times of the inspiratory and expiratory phases by the physician’s instructions. The labels are used as the time information of the respiratory phases. Integrating the time when the adventitious sound is detected with the time information of the respiratory phase, we can determine whether the adventitious sound is generated in the inspiratory phase or the expiratory phase. It contributes to the estimation of the degree of progression of the disease.
In addition to the results of estimating the presence and progression of the disease, the proposed method visually highlights the periods when adventi- tious sound is detected by framing them on the spectrogram. These are the diagnostic results presented to the non-specialist physician and the patient.
Conversion to Mel-Spectrogram The study obtains spectrograms from lung sounds. It extracts frequency fea- tures of lung sounds effectively, by converting them into the log scale, along with the application of the mel filter bank. The results are referred to as mel- spectrograms. The mel-spectrogram is used as an explanatory variable of a machine learning algorithm to search for adventitious sound. In addition, a visualized mel-spectrogram is presented together with the diagnostic results. It is used as an element to promote understanding of the diagnostic results to the physician and the patient.
Adventitious Sound Detection From Image-Represented Lung Sounds Instead of using the spectrogram of a single patient as it is, the proposed method divides the mel-spectrogram into segments of equal size along the time axis. Each segment is used as a single piece of data. All segments are combined with the time information of the original lung sound data. The spectrogram of lung sounds in patients with lung diseases has unique fre- quency features. Adventitious sound is detected by building a classification model in which the segment data are used as explanatory variables with a supervised machine-learning algorithm.
Identification of Respiratory Phases In actual medical practice, it is assumed that a physician listens to about 3 to 5 respirations during auscultation of a single patient. The patient’s lung sound data includes the inspiratory phase and the expiratory phase. During the auscultation, the physician instructs the patient to start each respiration. This allows the physician to mark the start and end times of the patient’s inspiratory and expiratory phases.
Respiratory Disease Diagnosis Through Comprehensive Analysis of Spectrograms 577
Estimation of Disease Progression The proposed method uses the information obtained in 3.3 and 3.4 to esti- mate whether the examinee has a disease and the progression of the disease. The progression is estimated by whether the time information given to the segment of the detected adventitious sound coincides with the duration of a particular respiratory phase.
In the interstitial pneumonia addressed in this study, patients are diagno- sed free from interstitial pneumonia when fine crackles do not occur during the respiratory phase. Patients are doubted interstitial pneumonia when fine crackles occur during the inspiratory phase. If the fine crackles are observed only in the expiratory phase, the diagnosis of non-interstitial pneumonia is made on the assumption that the fine crackles are observed due to another disease or noise. The diagnosis of a patient with severe interstitial pneumo- nia with progressive symptoms is made when fine crackles are detected in the inspiratory and expiratory phases.
The results of the diagnosis and the spectrogram of lung sound data pre- pared in 3.1 are presented to the physician and the patient to promote understanding of the diagnosis by the physician and the patient.
EXPERIMENTS Outline of the Experiment
Lung sound data are collected from 10 healthy subjects and 17 patients with interstitial pneumonia. In this experiment, a skilled respiratory speci- alist listens to lung sounds using a digital stethoscope. All lung sound data are recorded by the specialist for the duration of the respiratory phase and for the presence of fine crackles. The presence of fine crackles is used as the correct label for adventitious sound detection.
The feature extraction method described in 3.2 is applied to the acquired lung sound data to verify whether the machine learning algorithm can discri- minate fine crackles. This experiment uses XGboost, which often achieves relatively high accuracy without requiring a large amount of computational processing. For the detection of fine crackles using XGboost, the validity of the proposed detection method is confirmed with the detection accuracy which is one of the performance indices.
Frequency Feature Extraction In order to use the mel-spectrogram of the lung sound data, a short-time Fourier transform is applied to all lung sound data using librosa (McFee et al. 2020), a speech processing library. The parameters of the short-time Fourier transform are set to 2048 for the window size, 512 for the shift width, and Hanning window for the window function. The converted mel-spectrograms of the lung sound data are images of 256 pixels and 1584 pixels in height and width, respectively. The format is standardized for all subjects.
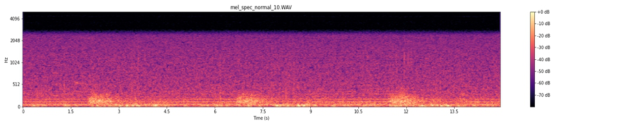
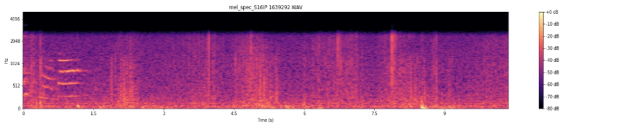
The spectrograms generated are shown below. Figure 2 shows a mel- spectrogram of normal lung sound, Figure 3 shows a mel-spectrogram of
Figure 2: Mel-spectrogram of normal lung sound.Figure 3: Mel-spectrogram of interstitial pneumonia lung sound.Figure 4: Mel-spectrogram of progressive interstitial pneumonia lung sound.
Interstitial pneumonia lung sound, while Figure 4 shows a mel-spectrogram of progressive Interstitial pneumonia lung sound.
On the mel-spectrogram of patients with interstitial pneumonia, longitu- dinal peaks of short duration are observed, leading from a low-frequency component to a high-frequency component. Referring to the time of onset of the fine crackles recorded by the physician at the time of diagnosis, the visually observed peak coincides with the fine crackles. It is confirmed that the mel-spectrogram can extract the frequency features of the fine crackles.
Fine Crackles Detection 12 data from patients with interstitial pneumonia and 8 data from healthy subjects are used to detect fine crackles. The process of classification is shown below.
1. convert spectrogram image to grayscale, 2. segment gray-scaled spectrograms at specific intervals, 3. convert a 2D segment to a 1D segment, 4. separate all segment data into training data, validation data, and test data, 5. generate a fine crackles classifier, using training and validation data, 6. predict data for testing with the fine crackles classifier, and 7. evaluate classification performance based on evaluation indicators
Respiratory Disease Diagnosis Through Comprehensive Analysis of Spectrograms 579
In the detection of fine crackles, the spectrogram is divided equally, con- sidering the feature that the fine crackles are Discontinuous short sounds. machine learning requires that all explanatory variables have the same num- ber of dimensions. For this purpose, the time axis of the mel-spectrogram is equally divided to generate segments of 256 pixels and 12 pixels in height and width, respectively. The segments are generated at intervals of less than 0.1 second per segment for one subject, which makes 132 segments in total. Based on the onset time of the fine crackles recorded by the specialist physi- cian, segments containing the fine crackles are labeled with 1 while segments without the fine crackles are labeled with 0. The set of labeled segments is divided into training data, validation data, and test data, to build and evalu- ate machine learning algorithms. The ratio of training data to validation data is 8:2. Test data for evaluating the generalizability of the model are randomly left out from the pre-training data so that the ratio of training data to test data is 8:2. Making the label proportion uniform, 348, 87, and 109 segments are used for training, validation, and test, respectively.
The confusion matrix, the F1-score, the precision, and the recall are used as evaluation indices for the classification model. Test data including healthy subjects and patients with interstitial pneumonia are fed to the constructed model to check whether the model correctly classifies them.
DISCUSSION
Detecting Fine Crackles
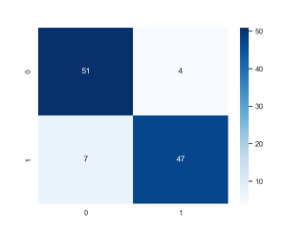
Figure 5 shows confusion matrix of the predictions made by the classification model on the test data. The figure shows the correspondence between the labels predicted by the classifier and the correct labels in terms of numbers, where 1 in the figure indicates fine crackles while 0 indicates a non-fine- crackles segment. The values of each of the evaluation indices described in previous chapter are calculated to show the test results of the classification of the samples. The values are shown in Table 1. Table 2 shows the percentage of correct answers for the training and the test data.
The non-fine-crackles are classified with a precision of 0.88 and a recall of 0.93. The fine crackles are classified with a precision of 0.92 and a recall of 0.87. The model has achieved 0.90 both in the F1-score and the accuracy.
Figure 5: Confusion matrix.Table 1. Recall, precision, and f1-score of the classification model.
For this test data, the classification model classifies fine crackles and non- fine crackles with an F1-score of about 0.90 with little difference in their precision and recall, which indicates that the model represents the features of fine crackles and non-fine crackles without bias. The accuracy is slightly higher for the training data than for the test data, indicating a slight overfit- ting of the model. However, since the percentage of correct answers for the test data is above 0.8, the model is regarded to achieve generalization fairly well.
From the results of this experiment, it turns out that the fine crackles, an adventitious sound of interstitial pneumonia, can be detected from the frequ- ency features of the lung sound collected with a digital stethoscope. Table 5.1 shows that the recall is slightly lower than the precision for the fine crackles classification model. This may be due to the fact that the label data for fine crackles includes a small number of non-fine crackles. In this experiment, the time when the fine crackles feature appears in the patient’s lung sounds is marked by the expert physician to be used as a training label. Since the fine crackles are discontinuous and short, there are segments labeled as ones con- taining fine crackles even though they contain no fine crackle. It is difficult for the classification model to classify them accurately.
When physicians diagnose patients suspected of having a disease, they should avoid missing patients with a disease. We should detect spectrograms with even a small suspicion of fine crackles. It is desirable to create a model that is higher in recall than in precision. The trend of precision and recall often varies with the parameters specified at building the model. The para- meters should be tuned to construct a model with a higher recall. In addition, the recall would be increased with a new method of segmenting spectrograms to detect features that have even a small possibility of fine crackles.
Estimation of Disease Progression One healthy subject, one patient with early interstitial pneumonia, and one patient with interstitial postural pneumonia with advanced symptoms are prepared to detect fine crackles. In addition, it is checked whether it is pos- sible to highlight fine crackles that are the basis of detecting the disease. Figures 6, 7, and 8 show a visualization of the fine crackles for each test data.
Respiratory Disease Diagnosis Through Comprehensive Analysis of Spectrograms 581
Figure 6: Visualization results of normal lung sound.
Figure available in the original PDF paper.
Figure 7: Visualization results of interstitial pneumonia lung sound.
Figure available in the original PDF paper.
Figure 8: Visualization results of progressive interstitial pneumonia lung sound.
Figure available in the original PDF paper.
On a mel-spectrogram with grid lines drawn for the time width of the segment, the segment containing the detected fine crackles is surrounded with colored lines. In the mel-spectrogram of a normal subject shown in Figure 6, there are a few peaks containing high-frequency components that visually resemble the features of fine crackles. However, only about 3.0% of the total segments are detected as ones containing fine crackles., All other segments are classified as ones without fine crackles. Frequency features other than high- frequency components are also considered to contribute to the classification of fine crackles.
For the patient with early interstitial pneumonia shown in Figure 7, it is confirmed that fine crackles are detected during inspiration phases. Since it is consistent with the general features of interstitial pneumonia, the classifi- cation model is considered to cover the characteristics of the disease to be detected. However, a few segments outside of the inspiratory phase are clas- sified as ones with fine crackles. It is necessary to investigate whether these are erroneous judgments by the learned model or very small features of fine crackles that physicians would miss.
In the mel-spectrogram of the interstitial pneumonia patient with pro- gressive symptoms shown in Figure 8, it is confirmed that fine crackles are detected in the periods of the inspiratory and the expiratory phases. Though noise including high-frequency components is heard near the beginning of auscultation, the segments around the noise are classified as ones with- out fine crackles. Since such noise is correctly discriminated, the proposed method is independent of noise with features different from those of fine crackles.
CONCLUSION
In this study, to assist non-specialists in auscultation, abnormal sounds that are criteria for a disease are detected in the lung sound collected with digital stethoscopes. In addition, the respiratory phase in which the abnormal sound appears is identified using the marks made by the physician. The paper has confirmed that it is possible to estimate the degree of progression of the dis- ease, investigating the percentage of respiratory phases in which abnormal sounds occur. In addition, the proposed method visualizes the evidence of diseases to assist non-specialists in diagnosis.
In the experiment, it is verified the proposed method is effective in detecting fine crackles, which are abnormal sounds specific to interstitial pneumonia. The results show that the classification accuracy of the fine crackles is 0.89.
It is expected that the method will not only reduce the burden on non- specialist physicians, but also increase patients’ satisfaction with the results of medical examinations.
In the future, we will investigate a method to automatically determine the respiratory phase based on frequency and time series features. Since the num- ber of data is currently small, additional experiments should be conducted to collect more lung sound data from healthy subjects and patients. It would enable the proposed method to be robust with noise and to detect other diseases.
ACKNOWLEDGMENT
I thank Prof. S. Hiromitsu for technical assistance with the experiment. We would like to thank the professors of Kyoto Prefectural University of Medicine for their cooperation in the lung sound collection experiment.
REFERENCES
Aviles-Solis JC, Storvoll I, Vanbelle S, Melbye H. The use of spectrograms improves the classification of wheezes and crackles in an educational setting. (2020 May 21) Sci Rep. 10(1):8461. doi: 10.1038/s41598-020-65354-w. PMID: 32440001; PMCID: PMC7242373. Bohadana A, Izbicki G, Kraman SS. Fundamentals of lung auscultation. (2014
Feb 20) N Engl J Med.370(8): 744–51. doi: 10.1056/NEJMra1302901. PMID: 24552321. Chloë Brown, Jagmohan Chauhan, Andreas Grammenos, Jing Han, Apinan Hasthanasombat, Dimitris Spathis, Tong Xia, Pietro Cicuta, and Cecilia Mascolo. (2020) Exploring Automatic Diagnosis of COVID-19 from Crowdsourced Respiratory Sound Data. In Proceedings of the 26th ACM SIGKDD International Conference on Knowledge Discovery & Data Mining (KDD ‘20). Association for Computing Machinery, New York, NY, USA, 3474–3484. https://doi.org/10.1145/3394486. 3412865 Gurung A, Scrafford CG, Tielsch JM, Levine OS, Checkley W. (2011 Sep) Compu-
terized lung sound analysis as diagnostic aid for the detection of abnormal lung sounds: a systematic review and meta-analysis. Respir Med. 105(9): 1396–403. doi: 10.1016/j.rmed.2011.05.007. Epub 2011 Jun 14. PMID: 21676606; PMCID: PMC3227538.
Respiratory Disease Diagnosis Through Comprehensive Analysis of Spectrograms 583
Hafke-Dys H, Br¸eborowicz A, Kleka P, Koci´nski J, Biniakowski A. (2019) The accuracy of lung auscultation in the practice of physicians and medical students. PLoS One. 2019 Aug 12;14(8): e0220606. doi: 10.1371/journal.pone.0220606. PMID: 31404066; PMCID: PMC6690530. J. Li and Y. Hong. (2016) “Crackles detection method based on time- frequency features analysis and SVM,” 2016 IEEE 13th International Con- ference on Signal Processing (ICSP), Chengdu, China, pp. 1412–1416, doi: 10.1109/ICSP.2016.7878059. McFee, B, Lostanlen, V, McVicar, M, Metsai, A, Balke, S, Thomé, C, Raffel, C, Malek,
A, Lee, D, Zalkow, F et al. LibROSA/LibROSA: 0.7.3. 2020. Available online: https://librosa.org (accessed on 6 August 2022). Nguyen, Truc & Pernkopf, Franz. (2022). Lung Sound Classification Using Co- Tuning and Stochastic Normalization. IEEE Transactions on Biomedical Engine- ering. pp. 1–1. 10.1109/TBME.2022.3156293. Pramono RXA, Bowyer S, Rodriguez-Villegas E. (2017 May 26) Automatic adventi-
tious respiratory sound analysis: A systematic review. PLoS One.12(5): e0177926. doi: 10.1371/journal.pone.0177926. PMID: 28552969; PMCID: PMC5446130. Sarkar M, Madabhavi I, Niranjan N, Dogra M. (2015 Jul-Sep) Auscultation of the respiratory system. Ann Thorac Med. 10(3): 158–68. doi: 10.4103/1817- 1737.160831. PMID: 26229557; PMCID: PMC4518345. Zulfiqar R, Majeed F, Irfan R, Rauf HT, Benkhelifa E, Belkacem AN. (2021 Nov 17) Abnormal Respiratory Sounds Classification Using Deep CNN Through Artificial Noise Addition. Front Med (Lausanne). 8:714811. doi: 10.3389/fmed.2021.714811. PMID: 34869413; PMCID: PMC8635523.
Read this individual research paper free through the original publisher, or explore the full digital proceedings book.
ISBN 978-1-958651-87-2
Explore this ISBN in the AHFE Bookstore ↗Listed in the July 2026 bookstore catalogue; search by ISBN to confirm current availability · Digital book purchase optional