Humans wear comfortable clothing depending on time, place, and occasion (TPO) to improve their quality of life. The wearing comfort of clothes varies with the microclimate formed between the skin and the clothes, referred to as the intra-clothing climate. Though comfort is related to the intra-clothing climate, comfort can be sacrificed to some extent, depending on the TPO.This study refers to unbearable discomfort as UD. Clothing giving UD differs depending on the TPO. In addition, the temperature and humidity inside the clothes affect the probability people feel UD. The study aims to find the relationship of the probability of UD with the temperature and humidity inside the clothes for each TPO to recommend clothes that prevent UD from occurring according to the TPO.The study assumes that the probability density of comfort at a specific TPO follows a two-dimensional Gaussian distribution of the temperature and humidity inside the clothes. It means not the temperature and humidity inside the clothes around the mean of the Gaussian distribution but those at the foot of the distribution are assumed to cause UD. The paper proposes a method to verify the assumption through a temperature and humidity sensor in the clothing. A temperature/humidity sensor in a small mesh case is attached between the clothes and the skin with a strap around the neck, to obtain temperature/humidity data. In addition, the comfort at each TPO is obtained by questionnaire in the range of "0 (uncomfortable)" to "4 (comfortable)". The distribution of comfort for the climate inside clothes from the sensor data is compared with questionnaire results.Experiments with 3 male subjects in their 20s during the 2-week experiment period have been conducted to observe the climate inside clothes in real life. The observed data are examined to extract the relationship with comfort for each TPO. The experiment has shown that the degree of comfort changes like a mountain on the two-dimensional plane of the temperature and humidity inside the clothing for a specific TPO of the subject. It also demonstrates that the degree of unbearable comfort increases at its foot. The data with the highest comfort level for each TPO of each subject are extracted to be applied for the GMM, to obtain a mixed normal distribution representing the area with the highest comfort level. The result accounts for the degree of unbearable comfort increasing at the tail of each Gaussian model. These results can be used for clothing recommendation considering comfort for each TPO based on the temperature and humidity sensed inside the clothing.
Humans wear comfortable clothes according to time, place and occasion (cal- led as TPO in below) to improve their quality of life. However, depending on the TPO, comfort may be sacrificed to some extent. The degree how uncom- fortable clothing a person can accept is dependent on the TPO.The comfort of a clothing associates with the intra-clothing climate. Our goal is to develop a clothing recommendation system based on an appropriate intra-clothing climate with a focus on comfort for each TPO. To realize such the system, we aim to estimating whether the clothes worn by a person are unbearably com- fortable or not by using sensors, weather data, and kinematics to measure the intra-clothing climate related to comfort. In this research, we hypothesize that “the comfort distribution for the intra-clothing climate under a certain TPO is represented by one or more mixed normal distributions”. To test this hypothesis, we propose a method to test the hypothesis via a temperature /humidity sensor inside the clothing.
Sensing Intra-Clothing Climate to Increase Comfort According to TPO 103
In this method, a temperature/humidity sensor is placed in a small mesh case and worn between the skin and clothing with a strap around the neck to obtain the intra-clothing temperature and humidity data. The comfort level at each TPO is obtained by a questionnaire, whose answer ranges from “0 (uncomfortable)” to “4 (comfortable)”. From the sensor data and the results of the questionnaire, we obtain the distribution of the comfort level for the climate inside the clothing. The experimental results showed that the comfort level for a specific TPO had a mountain-shaped distribu- tion on the two-dimensional plane of the intra-clothing climate, with the degree of unbearable comfort increasing toward the base of the mountain. We also extracted the data with the highest comfort level for each TPO for each subject and applied the Gaussian Mixture Model (GMM) clustering to obtain a mixed normal distribution representing the region with the highest comfort level. These results indicate that the degree of unbearable discom- fort increases as the intra-clothing climate is more closed to the foot of the mountain.
THE NEED FOR CLOTHING RECOMMENDATION SYSTEM BASED ON COMFORT Relationship Between Intra-Clothing Climate and Comfort
Fabric refers to a material of clothes, except in special circumstances, such as when there are restrictions on clothing. Clothing fabrics are broadly classi- fied into natural and synthetic fibers. There are also various types of natural fibers, such as vegetable and animal fibers. Because fibers have different characteristics, the intra-clothing climate varies greatly depending on the clothing fabric (MIZUNASHI, 1971). The intra-clothing climate is the micro- climate formed between the garment and the skin surface. The factors of intra-clothing climate include temperature and humidity (TAMURA, 1995). In addition, the intra-clothing climate influences comfort because clothing is associating with the insensible excretion and perspiration environment, which are considered to be human physiological phenomena involved in comfort and discomfort (MAEDA, 2008) (TOKURA, 1984).
TPO and Comfort of Clothing Clothing worn by a person differs depending on the TPO. For example, a person must wear a suit for a job interview. When relaxing at home, he/she can freely choose what to wear. In the former, the importance of forma- lity is emphasized, thus the importance of comfort decreases (FUKUOKA, TAKAGI and KOUYAMA, 1998) (NAKAGAWA, 1997). Therefore, they can endure to some extent even if they are uncomfortable to wear. On the other hand, in the latter, he/she can choose the clothes of their choice. He/she can only tolerate clothes that are comfortable to wear. Therefore, the degree of comfort that he/she can tolerate depends on the TPO. This means that the range of the in-clothing climate that provides comfort can differ depending on the TPO.
Current Status of Clothing Recommendation Our research aims to development of clothing recommendation system. As an example of existing recommendation, Cheng et al. proposed a method to accurate model of user preferences for items for each user/item pair (Cheng et al. 2019) (Cheng et al. 2019). This research focuses on prefe- rences. Yu et al. proposed introducing aesthetic information that is highly relevant to user preferences into a clothing recommendation system (Yu et al. 2018) (Yu et al. 2021). This research focuses on aesthetics. However, these studies do not consider the comfort of clothing. Our research focu- ses on comfort and aims to recommendations based on the intra-clothing climate.
OBSERVATION OF COMFORT TRANSFORMATION PER TPO FOR CLOTHING RECOMMENDATION Extraction of Comfort Distribution Using Wireless Temperature and Humidity Sensors
Aiming to a clothing recommendation based on intra-clothing climate, we consider to estimate how a kind of clothing is comfort for a person in a TPO from the temperature and humidity inside the clothing. In this research, unbearable discomfort is abbreviated as UD (Unbearable Discomfort). The type of clothing perceived as UD differs depending on TPO. The temperature and humidity inside the clothing affect the degree of UD.
In this research, we hypothesize the following relationship between the degree of UD and the temperature and humidity inside clothing. We con- sider that the degree of UD at a particular TPO has a two-dimensional mountain-shaped distribution with the intra-clothing temperature and humi- dity as variables. In other words, we hypothesized that the intra-clothing temperature and humidity corresponding to the center of gravity for each TPO would not be UD, that a normal distribution of degree of non-UD would form for each TPO, and that the intra-clothing temperature and humidity at the base of the distribution give UD of higher level.
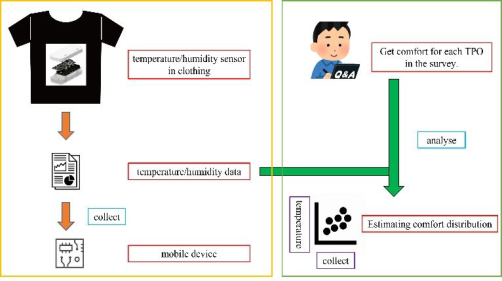
The methodology used to test the hypotheses is shown in Figure 1.
Figure 1: Method outline figure.
Sensing Intra-Clothing Climate to Increase Comfort According to TPO 105
Subjects routinely attach a wireless sensor to their clothing to measure the temperature and humidity in their clothing at each time point, and the sensor data is collected on a mobile device. The temperature and humidity inside the clothes change from moment to moment, thus the data can be obtained as time-series data.
The subject is asked to answer a questionnaire about the comfort level at each TPO.
We also gain comfort related to each TPO at each point in time and whe- ther the subject was in UD at that time or not, which is evaluated with the degree of comfort. In this research, each TPO is defined by when the time of the day, where, and what a person is doing. The comfort is obtained on a five-point scale according to the questionnaire: “comfortable (I want this situation to continue forever)”, “slightly comfortable (I still have a good situ- ation)”, “normal, slightly uncomfortable (I still have a good situation, but I have no choice)”, and “uncomfortable (I want to get out of this situation)”. The answer of “uncomfortable” is regarded as UD.
Plotting the comfort on a two-dimensional plane of the temperature and humidity in clothing for each TPO confirms how the comfort is distributed. Then, the distributions of the temperature and humidity in the clothes that are the “comfortable” are extracted for each TPO, and how they are distributed is estimated using GMM (Gaussian Mixture Model).
Estimation of Comfort Distribution We aggregate data on the temperature/humidity and the comfort in cloth- ing for each TPO to estimate comfort distribution. The comfort at each time point is quantified as follows: comfortable = 5, slightly comfortable = 4, normal = 3, slightly uncomfortable = 2, and uncomfortable = 1. When the comfort level for each TPO was plotted on a two-dimensional plane of the intra-clothing temperature and humidity, we can verify whether the plots spread out like a mountain shape with the highest comfort level at the center or not. We can verify whether a normally distributed mountain of the com- fort was formed for each TPO or not, and whether the degree of UD was higher at the base of the mountain or not. The intra-clothing temperature and humidity of the data that are the “comfortable” for each TPO are extra- cted, and the distribution of the “comfortable” data is obtained as a mixed normal distribution when GMM∼(Gaussian Mixture Model) ∼is applied. The degree of UD is considered to increase toward the base of each normal distribution 2.
Clothing Recommendation Using Comfort Distribution If the “comfort”data is mixed-normally distributed, the mixed-normal distri- bution estimated by the method in the previous sections could be used for clothing recommendation. A state change model is applied from time series data of the intra-clothing climate, the amount of walking, and the weather for a specific TPO to estimate the state inside the clothing.
EXPERIMENT Experimental Summary
An experiment was conducted to observe the intra-clothing climate in a real life and to extract the relationship between the intra-climate clothing and comfort for each TPO. The purpose of this experiment was to test the hypo- thesis that the comfort level in each TPO with respect to the intra-clothing climate is distributed in a mountain shape.
The experimental period was two weeks and three male subjects in their 20s who belonged to our laboratory were selected. Hereafter, the subjects are referred to as Subject A, B, and C. The experi- mental period for Subject A was 10 days from November 28 to December 7, that of Subject B was 15 days from November 28 to December 12, and that of Subject C was 8 days from November 28 and 30 and December 1, 2, 6, 8, 11, and 12. The subjects were asked to wear TWELITE PAL, a small wireless tag with a temperature and humidity sensors, and Fitbit Charge5, a wristwatch-type exercise meter. The sensor data was collected from one hour after waking until bedtime. The subjects were not given any special instructions regarding their clothing during the experiment. The subjects were free to choose what to wear and to change their clothing, such as putting on and taking off a raincoat when it rained.
Data Collection TWELITE PAL is placed in a small mesh-like case. The case is worn between clothing and skin with a strap around the neck. Temperature and humidity data are collected every minute.
To collect sensor data observed by TWELITE PAL, the subjects were instructed to carry a mobile device, Raspberry Pi, with them throughout the experiment. It was placed in a drawstring bag and kept within a radius of 2 m at all times. At first, we inserted a mobile battery into the Raspberry Pi mobile device and started the Raspberry Pi. Next, a wireless PAN module called MONOSTICK is inserted into the Raspberry Pi. This makes MONOSTICK the parent unit, which wirelessly connects to a TWELITE PAL, a child unit, to collect temperature and humidity data. The Raspberry Pi aggregates data through serial communication with the MONOSTICK via USB.
The Fitbit Charge 5 collects the amount of walking. The amount of walking is acquired every minute.
At the end of each experimental day, the subjects answered the TPOs of the day and the comfort level for each the TPO in a questionnaire using Google Form. The TPOs were freely described. The subjects were asked to answer each comfort level one by one, even if the same TPO appeared multiple times in a day. The subjects were asked to answer the comfort level for each TPO on a five-point scale.
In addition, photographs of the day’s worn clothes and their tags, as well as meteorological data, were also collected. The clothing was photographed when it was changed.
Sensing Intra-Clothing Climate to Increase Comfort According to TPO 107
EXPERIMENT RESULT Details of the TPOs
Each subject was asked to perform at least once a week four given TPOs, two of which were expected to be “comfortable” and other two of which were expected to be “uncomfortable” in terms of the questionnaire answer of comfort. The subjects could answer with arbitrary comfort levels for these TPOs regardless of our expectation.
A TPO that was assumed to be “comfortable” was “Driving with a moto- rcycle.” The TPOs that were assumed to be “unpleasant” were “Face-to-face lecture” and “Driving with a motorcycle in bad weather”. These TPOs are common among the subjects. Another “comfortable” TPO was given to indi- vidual subject. The “comfortable” TPOs were “Eating out” for Subject A, “Entertainment” for Subject B, and “Eating” for Subject C, respectively.
Regarding the TPOs obtained during the experiment, Subject A had 17 TPOs: “Working at home,” “Motorcycle (jacket),” “Face-to-face class,” “Motorcycle,” “Relaxing at home,” “Convenience store,” “Motorcycle (rai- ncoat),” “Store,” “Supermarket,” “Motorcycle (coat),” “Spending time in the club room,” “Walking (coat),” “Eating out (coat)”, “Hot spring”, “Convenience store (coat)”, and “Watching the World cup”. Subject B had “Recreation at home,” “Shopping,” “Working at home,” “Eating,” “Online lecture,” “Biking,” “Face-to-face lecture,” “Cleaning,” “Eating and walking,” “Transportation,” “Walking,” “Recreation at home (spe- cial),” “Store,” and “Online briefing session” for 14 items. Subject C had 9 of the following: “Shopping by train,” “Sleeping,” “Face-to-face lecture,” “Eating,” “Meeting,” “Shopping,” “Napping,” “Watching soccer games,” and “Making plastic models.
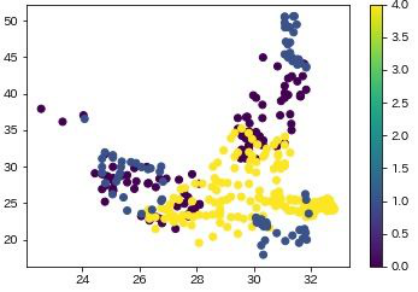
Comfort Distribution by TPO The comfort level of each subject for each TPO was encoded to a label from 0 (uncomfortable) to 4 (comfortable). Figure 2 shows a plot of the comfort level of Subject B for the TPO “Shopping” on a two-dimensional plane of temperature and humidity in the clothing.
Figure 2: Subject B’s “Shopping” temperature and humidity.
In Subject B’s “Shopping” the temperature range is 22-33
C and the humi- dity range is 15-50%, with high comfort data concentrated in the center and lower data concentrated toward the outside. In other words, the comfort level has a mountain-shaped distribution.
The result shows that the comfort level has a mountain-shaped distribution on the two-dimensional plane of temperature and humidity in the clothing for Subject B’s TPO “Shopping” with the degree of UD increasing toward the base of the mountain.
Modelling of Comfort Zone for Each TPO The data with the highest comfort level for each TPO for each subject were extracted, and a mixture normal distribution representing the region where comfort level 4 was obtained was obtained using GMM∼(Gaussian Mixture Model) ∼.
The number of clusters in the GMM was set to 5. The mean temperature and humidity for each cluster and the variance-covariance matrix for each cluster was obtained from the GMM. These results indicate that the degree of UD increases as the temperature and/or humidity are closed to the base.
CONSIDERATION When the comfort was encoded into the labels from 0 (uncomfortable) to 4 (comfortable) and graphed on a two-dimensional plane of temperature and humidity in the clothing, there were the cases that an uncomfortable point was in the center of the comfortable points’ areas. In Subject A’s TPO “Motorcycle (coat),” there existed data with the comfort level of 1 (sligh- tly uncomfortable) in the area of the temperature 23-31
C and the humidity 30-40%, where data with a comfort level of 4 (comfortable) concentrate. It occurred when Subject A was riding his motorcycle with his coat on. The cause could have been traffic congestion or bad weather. A possible reason for this is that even if the wearer is comfortable, he or she may not continue to feel good in some environments.
As can be seen in Figure 1, the temperature and humidity in the clothes of the data with the comfort level of 1 (slightly uncomfortable) spread over a wide area, whereas the data with the comfort level of 0 (uncomfortable) spread locally. It is thought to be caused by feeling a little uncomfortable, which can be tolerated to some extent, unless the environment is quite bad.
CONCLUSION
Humans may sacrifice some degree of comfort of clothing depending on TPOs. How acceptably comfort a person feels when wearing a clothe depends on TPOs. Such the comfort is affected by the intra-clothing climate. In this research, we focus on comfort in each TPO and propose a method for obtai- ning the distribution of the intra-clothing climate, which expresses whether the clothes worn by a person are unbearably comfortable or not.
In this method, a person wears wireless temperature and humidity sensors inside their clothing daily to collect sensor data. The comfort level at each
Sensing Intra-Clothing Climate to Increase Comfort According to TPO 109
time point for each TPO is also obtained based on the questionnaire. The comfort level distribution for the intra-clothing climate in each TPO can be extracted from the sensor data and the questionnaire results.
The experimental results showed that the comfort level distribution for temperature and humidity in the garments under each TPO was represen- ted by one or more peaked distributions for each TPO. Comfort level was higher at the center of the temperature and humidity distribution and lower at the foot. It was found that a mixed normal distribution was obtained by extracting the most comfortable data at each TPO by applying GMM.
Future work is to examine the log-likelihood for each TPO to see if clothing recommendations can be feasible.
REFERENCES
Akiko MAEDA (2008), “The Relations between Clothing to Wear Clothing Based on Microclimate”, Sen’i Gakkaishi Journal of the Society of Fiber Science and Technology, Japan, Volume 64, No. 12, pp. 424–427 (in Japanese). Cheng et al. (2019), “Explainable Recommendation by Leveraging Reviews and
Images”, ACM Transaction on Information Systems, Volume 37, No. 2. Cheng et al. (2019), “Personalized Outfit Generation for Fashion Recommendation at Alibaba iFashion”, KDD ‘19: Proceedings of the 25th ACM SIGKDD Interna- tional Conference on Knowledge Discovery & Data Mining, pp. 2662–2670. Hiromi TOKURA (1984), “Thermal Physiology of Comfort”, Journal of the Japan
Research Association for textile end-uses, Volume 25, No. 7, pp. 340–344 (in Japanese). Sanae NAKAGAWA (1997), “Studies on Clothing Norms (Part 1)”, Journal of the Textile Machinery Society of Japan, Volume 50, No. 3, pp. 155–159 (in Japanese). Sawako MIZUNASHI (1971), “Studies on How to Wear Clothing Based on Micro-
climate”, Journal of home economics of Japan, Volume 22, No. 1, pp. 1–9 (in Japanese). Teruko TAMURA (1995), “IV. Warmth, coolness, moistness, and comfort of the garment”, Journal of the Japan Research Association for textile end-uses, Volume 36, No. 1, pp. 31–37 (in Japanese). Yoshiharu FUKUOKA, Osamu TAKAGI and Susumu KOUYAMA, eds. (1998), “Stu-
dies on Clothing Norms (Part 1)”, Journal of the Japan Research Association for textile end-uses, Volume 39, No. 11, pp. 868–875 (in Japanese). Yu et al. (2018), “Aesthetic-based Clothing Recommendation”, Proceedings of the 2018 World Wide Web Conference, pp. 649–658. Yu et al. (2021), “Visually aware recommendation with aesthetic features”, The
VLDB Journal - The International Journal on Very Large Data Bases, Volume 30, No. 4, pp. 495–513.
Read this individual research paper free through the original publisher, or explore the full digital proceedings book.
ISBN 978-1-958651-87-2
Explore this ISBN in the AHFE Bookstore ↗Listed in the July 2026 bookstore catalogue; search by ISBN to confirm current availability · Digital book purchase optional