Alexander Van Gastel, Annemiek Awater, Daphne Mulkers, Lien Vancraenendonck, Vincent Vanderhaeghen, Stijn Verwulgen (2025). How Intensity-to-Capacity (IC) Ratios on Cycleways Impact Cyclists' Perceived Safety, Flow, and Comfort. In: Advances in Human Factors of Transportation. AHFE Open Access, vol. 186, pp. 171–177. https://doi.org/10.54941/ahfe1006506
As cities assess old and new cycleways to accommodate more cyclists, understanding the capacity limits of these paths has become crucial to sustainable growth. Cyclists’ safety, comfort, and flow determine these capacity limits, and traditionally, researchers have assessed them through on-site observations and surveys. This study introduces an alternative method, utilizing an off-site cycling simulator to investigate how increasing intensity-to-capacity (IC) ratios influence perceived safety, comfort, and flow on a high-capacity Antwerp cycleway. The key metric, IC ratios, assesses traffic volume, i.e., intensity, in relation to the estimated road capacity. Researchers tested three increased IC ratios compared to the current IC ratio of 0.269: 0.33 (mild: +22.68%), 0.51 (moderate: +89.59%), and 0.69 (high: +156.51%). Fourteen participants provided post-session feedback using Likert-scale questionnaires (1-5 scale). The results indicated that as the IC ratio increased, perceived safety and comfort declined, while flow interruptions became more frequent. Although the study did not identify a critical threshold where these factors significantly deterred cyclists, it is possible that the highest IC ratio tested was not sufficient to reveal such a point, though the methodology appears capable of detecting it at higher values. Notably, participant responses aligned with expectations, suggesting the simulator’s potential as a tool for analyzing IC ratios in future research. This methodology offers urban planners a controlled, off-site approach that provides flexibility and efficiency compared to traditional in situ studies, which lack controllability. Lastly, this methodology provides a way to analyze potential future high-intensity scenarios.
Antwerp anticipates increased cycleway usage in coming years based on past growth numbers and the city’s initiatives promoting cycling as a sustainable transport mode (APPM i.s.m. Tour de Force, 2022). The expected growth has prompted urban developers to analyze current and future cycleway capacities to support and encourage the rising number of cyclists.
Consequently, the Flemish government and Antwerp have invested in data collection, evaluation, and benchmarking of their cycling infrastructure (Fietsbarometer, 2025; ArcGIS Dashboards, 2025). This includes, but is not limited to, data on: 1) cycling accidents, including location and severity (Fietsbarometer); 2) intensity, tracking the number of cyclists passing at any given time (Fietsflow); 3) surface roughness, measured through vibration intensity (Profilometer, Meetfiets); 4) cycleway width (Fietsbarometer); 5) intersection camera’s, monitoring movement, speed and identifying near-miss incidents and unsafe behavior (Viscando); 6) intersection types (Fietsbarometer); 7) central reservation width and buffer zones (Fietsbarometer); 8) speed limits; and 9) bottlenecks, identifying specific issues such as obstacles and hazardous conditions (Fietsbarometer).
However, a key challenge remains in converting this data into actionable insights that can guide decision-making for infrastructure improvements and sustainable development. This paper addresses this gap by introducing a newly developed methodology utilizing a cycling simulator to investigate the impact of intensity-to-capacity (IC) ratios on cyclists’ perceived comfort, safety, and flow. The IC ratio metric quantifies traffic volume, i.e. intensity, relative to the estimated road capacity (Fietsberaad Nederland, 2021). A cycling simulator enables controlled, off-site experiments with high repeatability, allowing researchers to assess future growth scenarios. However, as with all simulated environments, a trade-off exists between control and realism.
The primary research question is: To what extent can an off-site cycling simulator can differentiate the impact of varying IC ratios on cyclists’ perceived safety, flow, and comfort, and how can this method be applied to assess future high-intensity scenarios? This is examined under the hypothesis that an off-site cycling simulator is valid to capture differences in perceived safety, flow, and comfort across varying IC ratios, making it a potential tool for evaluating future high intensity cycling scenarios.
METHOD
The F11 Antwerp-Lier cycleway (51
10′08.5′′N 4
29′01.7′′E–51
10′31.4′′N 4
28′31.7′′E), a well-maintained cycle highway capable of supporting current traffic levels, was selected for this case study. Three scenarios were filmed on the cycleway to analyze varying IC ratios of 0.33, 0.51, or 0.69. The rationale behind these values and methods to control them is detailed in section 2.2: Intensity-to-Capacity Ratios.
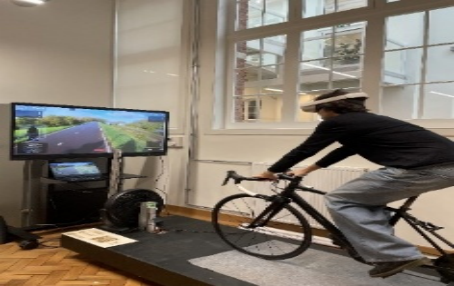
The recordings were processed and integrated into the Frontal Area Analysis and Simulation Technology (FAAST) software - an indoor cycling system that simulates an outdoor experience using video, VR, audio, and simulated drag forces (Peeters et al., 2020; Gastel et al., 2024). FAAST was configured to interface with a Kickr Smart Trainer (Wahoo), a Meta Quest 2 (Meta) VR headset, and a RealSense Depth Camera D435 (Intel) to capture the participant’s drag area on the bicycle. In the simulation, speed, drag resistance, hill incline, visuals, and sounds were represented. Following
How Intensity-to-Capacity Ratios on Cycleways 173
the quadratic law of drag, an increase in the cyclist’s speed or drag area resulted in a proportional increase in drag resistance, which was simulated by increasing resistance on the Kickr Smart Trainer. Furthermore, the simulator was equipped with an automated platform that adjusted the hill gradient to match the real-world incline angle during a bridge section of the cycling path. Resistance on the Kickr Smart Trainer was simultaneously adjusted to reflect the actual effort required on the gradient, also taking account speed, posture and drag forces.
Participants were instructed to complete a GDPR consent form and a questionnaire detailing their age, height, weight, and weekly cycling distance. They were then seated on the simulator with the saddle height adjusted to ensure a comfortable riding posture (see Figure 1). FAAST was configured with the participant’s age, height, and weight. The Meta Quest 2 headset was fitted, and proper visibility was confirmed. After completing the first scenario, the participant dismounted the bicycle and completed a questionnaire evaluating their perceived comfort, safety, and flow of the ride. They then cycled through the second and third scenarios, completing a questionnaire after each. The different scenarios were alternated to minimize fatigue as a potential influence on responses.
Figure 1: Participant using the cycling simulator, which replicates outdoor riding conditions through video, VR, audio, and dynamic resistance adjustments.
POPULATION Fourteen cyclists (ten males and four females) participated in the simulator study, with a mean age of 21 and a mean body mass of 70.07 ± 7.88 kg. Participants cycled an average of 22.46 ± 21.04 kilometers per week.
INTENSITY-TO-CAPACITY RATIOS The intensity-to-road capacity ratio, as shown in equation (1), provides a measure of how congested a cycleway is at a given time.
IC Ratio = Traffic Volume
Road Capacity (1)
According to one source (Agentschap Wegen en Verkeer and Fietsberaad Vlaanderen, 2024) the road capacity for a Flemish cycling highway with a width ≥4.00 m is 500 cyclists per hour. Data on traffic volume for the F11 cycleway was gathered from an on-site cyclist counter, which has collected measurements over the past four years and is made available by the city. To calculate the current rush hour traffic volume, morning and evening rush hours on weekdays were analyzed between 2021–2024. During morning rush hour (7:00–9:00), the traffic volume averaged 152 cyclists per hour, while during evening rush hours (16:00–18:00), traffic volume averaged 117 cyclists per hour. Therefore, the F11 experiences an average rush hour traffic volume of 134.5 cyclists per hour. The corresponding current IC ratio was calculated to be 0.269, as shown in Equation (2).
134.5
Equation reproduced from the original PDF.
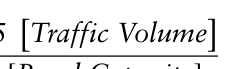
To estimate the number of cyclists within the test section, the travel time for an average cyclist had to be determined. The distance of the section is 1.1 km, and the estimated average cycling speed is 16.5 km/h, resulting in a travel duration of ∼4 minutes. Subsequently, it can be calculated how many people would cycle in that section. Based on Equation (3), approximately 9 cyclists would be expected within the test section at a given moment during peak hours.
134.5 [Traffic Volume] 60 [Min] × 4 [min] = 8, 966 [Cyclists] (3) For the study, the current rush hour scenario was defined as Situation 1. The subsequent test scenarios aimed to increase the IC ratio by 0.1 increments, with the target number of cyclists calculated accordingly (see Table 1).
Table 1: Target intensity-to-capacity ratios and the # cyclists.
Along the selected path, four checkpoints were designated from which actors would depart by bike. The departure timing of each actor was carefully coordinated to minimize variability between test scenarios. Filming was conducted using a HERO 12 (GoPro) action camera mounted on the lead cyclist’s head. Since the cycleway remained open to regular users, additional unforeseen cyclists, mopeds, runners, and pedestrians contributed to variations in intensity. After filming, the final number of cyclists in each scenario was counted, and the actual IC ratios, used in the simulator, were revised accordingly (see Table 2).
How Intensity-to-Capacity Ratios on Cycleways 175
Table 2: Final intensity-to-capacity ratios and the # cyclists.
Table available in the original PDF paper.
Situation A Situation B Situation C Intensity ratio 0.33 0.51 0.69 # Cyclists 11 17 23
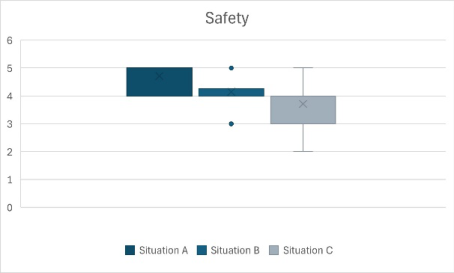
RESULTS & DISCUSSION The results indicate that IC ratio = 0.69 consistently received the lowest ratings for perceived safety, flow, and comfort. Safety scores (see Figure 1) show that Situation A had the highest perceived safety, followed by Situation B, while Situation C was rated the least safe.
Figure 2: Safety scores (lower is worse): Situation A) Max = 5, Min = 4; Situation B) Max = 5, Min = 3; Situation C) Max = 5, Min = 2.
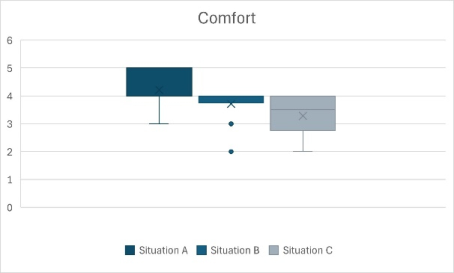
Similarly, the comfort levels (see Figure 3) follow the same trend. Situation A is perceived as the most comfortable, followed by Situation B, while Situation C is rated the least comfortable.
Figure 3: Comfort scores (lower is worse): Situation A) Max = 5, Min = 3; Situation B) Max = 4, Min = 2; Situation C) Max = 4, Min = 2.
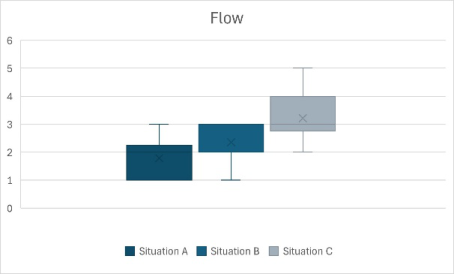
Lastly, a similar relationship is observed for flow scores (see Figure 4). Situation A is considered the most fluent, followed by Situation B, while Situation C experiences the most interruptions.
Figure 4: Flow scores (lower is better): Situation A) Max = 3, Min = 1; Situation B) Max = 3, Min = 1; Situation C) Max = 5, Min = 2.
To further evaluate the effectiveness and trade-offs of the methodology used in this study, a comparison of traditional on-site observations and the cycling simulator was conducted (see Table 3). Each method presents distinct advantages and disadvantages that influence its suitability for assessing IC ratios and their impact on cyclists’ perceived safety, flow, and comfort.
Table 3: Advantages & disadvantages.
Table available in the original PDF paper.
Advantages Disadvantage
1) Disrupts normal traffic flow
1) Uses real-world cyclists and actual traffic dynamics
Traditional On-Site Observations
2) Captures authentic and spontaneous reactions
1) Can simulate future high-intensity scenarios
2) Logistically complex and time-consuming 3) Real-time reaction 3) Weather-dependent and influenced by external conditions Cycling Simulator
2) Initial calibration and scenario design require high effort
1) Lacks full real-world realism (e.g., distractions, unpredictable events) 2) Enables controlled experiments with repeatable conditions
3) Allows for reusable test recordings for further analysis
3) Expensive equipment and setup costs 4 Safe, low-risk test environment
How Intensity-to-Capacity Ratios on Cycleways 177
CONCLUSION
This study examined the impact of increasing intensity-to-capacity (IC) ratios on cyclists’ perceived safety, flow, and comfort using a cycling simulator. While higher IC ratios led to worsened ratings across all three dimensions, this study was unable not identify a clear tipping point where conditions became significantly unfavorable.
A possible explanation is that the highest IC ratio (0.69) may not have been high enough to cause a substantial decline in perceived safety, comfort, or flow. Additionally, the cycling simulator may not fully replicate real- world dynamics, such as unpredictable cyclist interactions, environmental distractions, and minor infrastructural imperfections. Another consideration is that the cycleway’s actual capacity may be higher than initially estimated, allowing it to accommodate the IC ratios of Situations A and B, without significantly impacting cyclists’ experience.
Future research should explore higher IC ratios to determine whether a clear tipping point can be determined. Additionally, validating the simulator’s effectiveness through real-world observations would help assess its applicability for analyzing high intensity cycling conditions.
Despite the absence of a definitive threshold, this study provides valuable insights into the current state of the F11 cycleway. Situation A closely reflects average rush hour conditions, while Situation C represents a substantial 156.51% increase in IC ratio but remains within an acceptable range. These findings suggest that no immediate infrastructure investments are necessary to improve this cycleway soon.
REFERENCES
APPM i.s.m. Tour de Force (2022). Nationaal Toekomstbeeld Fiets De Kracht Van De Fiets Volop benut!. Agentschap Wegen en Verkeer and Fietsberaad Vlaanderen (2024). Vademecum
fietsvoorzieningen. Versie 1.1. Brussels: Agentschap Wegen en Verkeer. Available at: https://wegenenverkeer.be/ [Accessed 20 February 2025]. Fietsberaad Nederland (2024). Capaciteitsbepaling Fietspaden. [online] Available at: https://fietsberaad.nl/Kennisbank/Rapport-Capaciteitsbepaling-Fietspaden [Accessed 20 February 2025]. Provincieantwerpen.be (2023). Fietsbarometer. [online] Available at: https://fietsbaro
meter.provincieantwerpen.be/geoloketten/?viewer=fietsbarometer [Accessed 20 February 2025]. Province of Antwerp (2024). ArcGIS Dashboards. [online] Available at: https:// provincieantwerpen.maps.arcgis.com/apps/dashboards/98e5f6f12fae45a6b9bd6 ad5a651e06b [Accessed 20 February 2025]. Peeters, T., Garimella, R. and Verwulgen, S. (2020). An Indoor Training Bike to
Provide Real-Time Feedback on the Aerodynamic Cycling Position Using Frontal Area Calculations. [online] doi: https://doi.org/10.15221/20.24. Van Gastel, A., Hermans, K., Vleugels, J. and Verwulgen, S. (2024). ‘Uphill Cycling: Investigating the Effects of Saddle Incline on Comfort, Frontal Area, and Power Output’, 3DBODY. TECH Journal - International Journal of 3D Body Technologies, 1, pp. 53–60. Available at: https://doi.org/10.15221/24.53 [Accessed 20 February 2025].
LISTED IN THE AHFE DIGITAL BOOKSTORE CATALOGUE
Explore the complete digital volume
Advances in Human Factors of Transportation
Read this individual research paper free through the original publisher, or explore the full digital proceedings book.
ISBN 978-1-964867-62-5
Explore this ISBN in the AHFE Bookstore ↗Listed in the July 2026 bookstore catalogue; search by ISBN to confirm current availability · Digital book purchase optional