Despite the increase in respiratory diseases, the number of respiratory specialists is decreasing. The shortage of respiratory specialists has made the COVID-19 pandemic more serious. The pandemic has revealed the difficulty of controlling transmission, diagnosing, monitoring disease status, and responding to symptoms of infectious respiratory diseases. The global outbreak of the new virus infections has reminded us of the fragility of the conventional healthcare system.The most effective examination in the examination of respiratory disease is auscultation. However, features of abnormal sounds the disease brings are too obscure for doctors who are not specialists in respiratory to distinguish abnormal sounds from normal ones. Furthermore, due to aging, we would suffer from difficulty in hearing high-pitched sounds, which obliges even specialists often make mistakes in diagnosis. Diagnosis by auscultation depends on subjective judgment and the skill of the specialist. Today, when specialists are in short supply, information technology is expected to support even non-specialists to be able to diagnose respiratory diseases with high accuracy based on objective criteria. Utilizing the technologies, we should prepare for new pandemics.Specialists diagnose respiratory diseases by listening for peculiar sounds from the auscultatory sounds of patients who are suffering from lung disease. The study proposed in the paper transforms lung sounds collected by auscultation into a spectral image using the short-time Fourier transform. If auscultatory sounds contain disease-specific sounds, specific features should also appear in the spectral image of lung sounds. Deep learning techniques for analyzing images have made remarkable progress.Images can provide objective judgment criteria even to non-specialists. Analysis of images allows both specialists and non-specialists to diagnose objectively, unaffected by hearing loss due to aging. Doctors have accountability for patients on diseases. Images have comprehensive explanatory power for patients.Only a short-time Fourier transform of the spectral image of auscultatory sounds does not sufficiently highlight features specific to respiratory disease. The proposed method converts auscultatory sounds from the lung into a spectral image that emphasizes the frequency region of the sound recognizable to humans. The study refers to it as a mel-spectrogram, which facilitates finding disease features. The proposed method detects disease-specific features appearing in mel-spectrograms with Yolo, an object detection technique based on deep learning. The proposed method has discriminated auscultatory sounds obtained from actual patients with an accuracy of 0.7 in the F1-Score.Deep learning analysis of images provides evaluation criteria that are objective and independent of the skill of doctors. This study will enable non-specialists in respiratory medicine to examine whether persons are suffering from respiratory diseases, which would eliminate the shortage of specialists. This is diagnostic support for nonspecialists to address the explosion of patients due to respiratory infection outbreaks in the pandemic. It contributes to preventing the collapse of health care.
According to WHO, respiratory diseases are reported to be the third to fifth leading cause of death and seventh leading cause of death worldwide. Despite this, there is a serious shortage of physicians who can diagnose respiratory diseases. The recent pandemic caused by a new type of coronavirus infection has exposed the inadequacy of medical systems capable of diagnosis, disease monitoring, and symptom control. One of the main reasons for this is the lack of physicians who can diagnose respiratory diseases.
In general, through a series of examinations of a patient, physicians nar- row down possible respiratory diseases. The most effective examination in the diagnosis of respiratory disease is auscultation. Respiratory specialists diagnose many symptoms by listening to lung sounds. However, respira- tory diseases often overlap. The sub-noise, an abnormal sound in lung sounds, varies depending on the type of disease, site of lesion, and path- ology (Bohadana et al., 2014). Furthermore, abnormal sounds vary with age, gender, body size, and other factors. The pattern of abnormal sounds is enormous. Identifying abnormal sounds is not easy, even for specialists. In
addition to that, humans have difficulty hearing high-pitched sounds as they age. Because of aging, even specialists often misdiagnose.
Auscultation requires subjective judgment (Gurung et al., 2011). The judgment of whether lung sounds contain abnormal sounds is based on subje- ctive criteria developed through experience (Gurung et al., 2011). Diagnosis by auscultation depends on the skill of the specialist. Although electronic stethoscopes are commercially available, they can only store auscultatory sounds as digital data. They do not have advanced functions to detect sub- noises from the auscultatory sounds and present them to the physician to assist in diagnosis. The shortage of respiratory specialists today requests information technology to enable non-specialists to diagnose with a high degree of accuracy.
If auscultatory sounds contain disease-specific sounds, then specific fea- tures should also appear in the spectral image of lung sounds. Specialists hear these characteristics with their ears. However, diagnosis by hearing, which requires experience, cannot solve the physician shortage. This study will enable non-specialists to diagnose respiratory diseases by imaging lung sounds collected from a stethoscope and detecting areas on the image that are characteristic of respiratory diseases.
Short-time Fourier transform converts the lung sounds collected by auscul- tation into a spectral image. In this study, lung sounds are converted into mel-spectrograms, spectral images that highlight the areas of sound diagno- sed by a specialist. The proposed method detects disease-specific features that appear in mel-spectrogram images with YOLO, a method for detecting obje- cts with specified features based on deep learning. If images are objectively analyzed with deep learning, the decision criteria do not depend on the skill of the diagnostician (Gurung et al., 2011). This study allows non-specialists in respiratory medicine to examine patients suffering from respiratory diseases.
This study solves the shortage of specialist physicians. If non-specialists can see patients with respiratory illnesses, we can deal with the explosion of patients that occurs during an epidemic of respiratory infections. This method provides a means of preventing the collapse of healthcare.
Imaging of Targeted Auscultatory Sounds Targeted Diseases and Their Characteristics Human lung sounds consist of respiratory sounds and sub-noises. Breath sounds are the sounds produced by normal breathing. A sub-noise is an abnormal sound produced by breathing movements when a person is suf- fering from a disease. The characteristic sound of the sub-noise is different depending on the site where the sound is generated (Pramono et al., 2017). Some sub-noises are continuous, while others are intermittent.
In this paper, we consider the detection of twisting sounds that are cha- racteristic of interstitial pneumonia. The twisting sound is a fine crackle of intermittency. The twisting sound is a discontinuous sound with a short dura- tion. There is a pause when the sound is observed as a waveform on a time axis.
Detection of Abnormalities in Imaged Lung Sounds Based on Deep Learning 767
Mel-Spectrogram In this study, frequency features of sub-noise in lung sound data collected with a digital stethoscope are extracted using machine learning. Assuming support for non-specialists, auscultatory sound data is represented visually so that the evidence of disease is presented objectively.
The short-time Fourier transform is used to transform the lung sounds into a spectral image that is represented in three dimensions: time, frequency, and intensity (Aviles-Solis et al., 2020). In a spectral image, the elapsed time and the frequency are represented with the horizontal axis and the vertical axis, respectively, while the intensity is visualized with color. We can recognize how intense the sound of frequency ω is when time t has elapsed after the start of the observation, by the sequence of colors on time t.
Auscultatory sound data collected using a digital stethoscope is conver- ted from analog signals to discrete digital signals (Lakhe et al., 2016). The A/D conversion performs sampling so that the frequency features of the auscultatory sound data are retained.
Characteristics that appear in the frequencies of respiration and sub- noise in auscultatory sounds are those below about 2,000 Hz (Sarkar et al., 2015). To extract frequency features with the short-time Fourier transform, sampling is performed at frequencies above about 4,000 Hz, based on the sampling theorem. In this study, auscultatory sound data are collected using a digital stethoscope that samples digital signals at a sampling frequency of 10,000 Hz. This makes it possible to extract frequency features below appro- ximately 5,000 Hz contained in the auscultatory sound data with a short-time Fourier transform.
Humans are much more sensitive to features in the low-frequency range than in the high-frequency range. Specialists also diagnose disease by liste- ning for sounds specific to pulmonary disease from auscultatory sounds in the low-frequency range. More emphasis should be placed on extracting the low-frequency features that make up the auscultatory sound from the spe- ctral image to which the Fourier transform has been applied. The results of the short-time Fourier transform are log-transformed to emphasize the low-frequency region over the high-frequency region. A mel-filter bank, which further emphasizes human-sensitive frequency regions, is applied to the results. In this way, a mel-spectrogram expressed in log-scale can be calculated.
In this study, the frequencies and intensities in the mel-spectrogram at each time point are used as explanatory variables given by machine learning. The mel-spectrogram calculated from the auscultatory sound data is used as the image data when presenting the location of the twisting sound as a result.
Proposed Method In this study, as data preprocessing, auscultatory sound data collected using a digital stethoscope is transformed into a mel-spectrum, which is expressed in three dimensions of time, frequency, and intensity, using a short-time Fourier transform (Zulfiqar et al., 2021). Segment mel-spectrum image data over a short period.
Next, the mel-spectrum image data calculated from the auscultatory sound data is used to detect the portion corresponding to abnormal lung sounds using YOLO, a deep learning method. Object detection is a technique for recognizing the location, number, and label of specific objects in an image (Diwan et al., 2023). When the twisting sound characteristic of interstitial pneumonia is included in the lung sounds, the mel-spectrum image data converted from the lung sound is considered to have a region corresponding to the specific frequency and intensity at the time when the twisting sound occurred (Gulzar et al., 2023).
YOLO (You Only Look Once) uses a detector that has been pre-trained to detect the characteristics of this region in a way that surrounds the region corresponding to the twisting sound in the mel-spectrum image data. YOLO indicates the area detected by the bounding box.
Y O LO (2016) is an object detection method that enables faster object detection than other object detection methods such as R-CNN. Learning takes time, but the inference is fast.
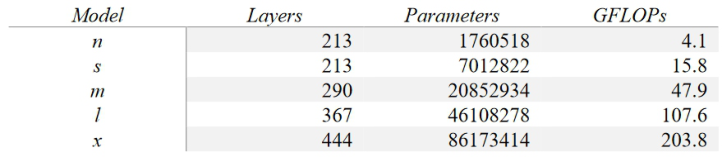
There are various versions of YOLO, ranging from YOLOv1 to YOLOv5. There are five types of YOLOv5: YOLOv5n, YOLOv5s, YOLOv5m, YOLOv5l, and YOLOv5x, each with a different number of parameters in the algorithm and number of layers. In this case, YOLOv5s will be used to detect the twisting sound region.
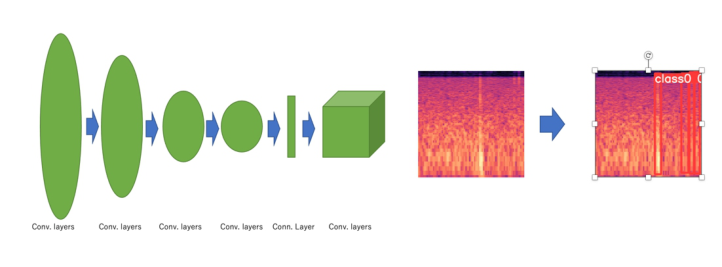
The basic algorithm of YOLO is shown in Figure 1 below. As Figure 1 shows, the YOLO structure consists of two networks: a convolutional network and a YOLO network (YOLO, 2016). Convolutional networks extract various features of the input image. The YOLO network computes where the pre-registered objects are located in the image based on the extracted features. The YOLO network outputs the coordinate informa- tion of the bounding box and the confidence level that the area it corresponds to is a registered object (YOLO, 2016).
In this study, mel-spectrum image data are input to YOLO. YOLO detects the area corresponding to the abnormal sound. YOLO outputs the Con- fidence Score and the coordinates of the bounding box, where the region represents the twisting sound. This output can be used to visually indi- cate areas where twisting sounds are occurring by surrounding them with bounding boxes.
Figure 1: The basic algorithm of YOLO.
Detection of Abnormalities in Imaged Lung Sounds Based on Deep Learning 769
In this study, mAP will be used as the evaluation index. The mAP is an evaluation index that is the mean of the AP obtained from the precision and the recall for all registered object classes. It takes a value between 0 and 1.
Experiment and Results The details of the YOLO parameters addressed in this study are shown in Table 1 below.
Table 1. The details of the YOLO parameters.
Table available in the original PDF paper.
In this study, model S will be used among YOLO v5. The data will be 40 training data, 18 validation data, and 10 test data for training and inference. The result is shown in Figure 2 below.
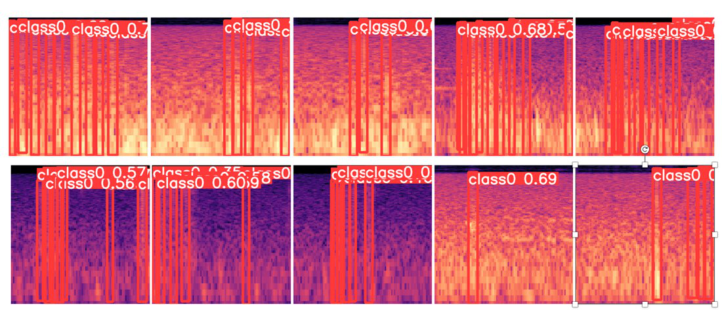
An experiment gives precision of 0.769, recall of 0.714, and mAP of 0.779. Figure 3 shows the detection results of the test data.
From Figure 3, it can be seen that the bounding box is displayed within the audible range of the twisting sound. Class 0 indicates that there is a twisting sound there. The value to the right of it represents the Confidence Score.
Figure 2: The result of inference, precision, recall, mAP.Figure 3: The result of inference, bounding box, confidence score.
DISCUSSION
The experimental results of this study yield a precision of 0.769, a recall of 0.714, and an mAP of 0.779. Both the precision and recall are above 0.7, indi- cating that YOLOv5 detects the twisting sound with fairly good accuracy. As shown in Figure 3, which visualizes the inference results of the test data, the bounding box surrounds the twisting sound. The visualization can objectively show that the twisting sound is generated in a way that is easily understood by non-specialists and patients, rather than a subjective evaluation by the auditory sense.
CONCLUSION
This study visually demonstrates that twisting sounds are generated by ima- ging human lung sound data to non-specialists and patients alike. The accuracy was 0.779 in mAP. Future experiments should be conducted using more data obtained from various patients and healthy subjects. The accu- racy of the detection results in these experiments should be compared with the results of the present experiment.
REFERENCES
Aviles-Solis JC, Storvoll I, Vanbelle S, Melbye H. The use of spectrograms improves the classification of wheezes and crackles in an educational setting. Sci Rep. 2020 May 21;10(1):8461. doi: 10.1038/s41598-020-65354-w. PMID: 32440001; PMCID: PMC7242373. Bohadana A, Izbicki G, Kraman SS. Fundamentals of lung auscultation. N Engl
J Med. 2014 Feb 20;370(8): 744–51. doi: 10.1056/NEJMra1302901. PMID: 24552321. Diwan, T., Anirudh, G. & Tembhurne, J. V. Object detection using YOLO: challenges, architectural successors, datasets and applications. Multimed Tools Appl 82, 9243–9275 (2023). https://doi.org/10.1007/s11042-022-13644-y Gulzar, Hafsa and Li, Jiyun and Manzoor, Arslan and Rehmat, Sadaf and Amjad,
Usman and Jalil Khan, Hadiqa, Transfer Learning Based Diagnosis and Analysis of Lung Sound Aberrations (March 15, 2023). International conference on Health Informatics (HEIN 2023), Available at SSRN: https://ssrn.com/abstract=4389141 or https://dx.doi.org/10.2139/ssrn.4389141 Gurung A, Scrafford CG, Tielsch JM, Levine OS, Checkley W. Computerized lung sound analysis as diagnostic aid for the detection of abnormal lung sounds: a systematic review and meta-analysis. Respir Med. 2011 Sep;105(9): 1396–403. doi: 10.1016/j.rmed.2011.05.007. Epub 2011 Jun 14. PMID: 21676606; PMCID: PMC3227538. Lakhe A, Sodhi I, Warrier J, Sinha V. Development of digital stetho- scope for telemedicine. J Med Eng Technol. 2016;40(1): 20–4. doi: 10.3109/03091902.2015.1116633. Epub 2016 Jan 5. PMID: 26728637. Pramono RXA, Bowyer S, Rodriguez-Villegas E. Automatic adventitious respiratory
sound analysis: A systematic review. PLoS One. 2017 May 26;12(5): e0177926. doi: 10.1371/journal.pone.0177926. PMID: 28552969; PMCID: PMC5446130. Sarkar M, Madabhavi I, Niranjan N, Dogra M. Auscultation of the respiratory system. Ann Thorac Med. 2015 Jul-Sep;10(3): 158–68. doi: 10.4103/1817- 1737.160831. PMID: 26229557; PMCID: PMC4518345.
Detection of Abnormalities in Imaged Lung Sounds Based on Deep Learning 771
You Only Look Once: Unified, Real-Time Object Detection, Joseph Redmon, Santosh Divvala, Ross Girshick, Ali Farhadi; Proceedings of the IEEE Conference on Computer Vision and Pattern Recognition (CVPR), 2016, pp. 779–788 Zulfiqar R, Majeed F, Irfan R, Rauf HT, Benkhelifa E, Belkacem AN. Abnor-
mal Respiratory Sounds Classification Using Deep CNN Through Artifi- cial Noise Addition. Front Med (Lausanne). 2021 Nov 17;8:714811. doi: 10.3389/fmed.2021.714811. PMID: 34869413; PMCID: PMC8635523.
Read this individual research paper free through the original publisher, or explore the full digital proceedings book.
ISBN 978-1-958651-87-2
Explore this ISBN in the AHFE Bookstore ↗Listed in the July 2026 bookstore catalogue; search by ISBN to confirm current availability · Digital book purchase optional