Helena Wasle, Anne Goralzik, Birte Thomas-friedrich, David Schackmann, Esther Bosch (2023). When Something Is in the Way: Parameters of Perception and Reaction Speed in Train Drivers. In: Human Systems Engineering and Design (IHSED 2023): Future Trends and Applications. AHFE Open Access, vol. 112, pp. 281–291. https://doi.org/10.54941/ahfe1004139
A challenge for automation in open track railway systems is the lack of safety standards for obstacle detection and benchmarks for the performance of automated systems. In this work, the foundation for such a benchmark was established with the help of two studies aimed at understanding the reaction time mechanisms of this task. A simulator experiment with professional train drivers and an online study with a larger sample of non-train-drivers were conducted to analyze the reaction time to obstacles along the tracks. The size and contrast of the obstacles, as well as driving speed and use of train protection systems, were varied in a within-subjects design and their effects on reaction time were analyzed with a linear regression model on log-transformed data. The results show that larger obstacles and those with higher contrast are detected significantly faster. Obstacles that are approached at a higher speed were also detected significantly faster. However, varying the train protection system produced ambiguous results. The findings from this research provide a baseline for further research on train driver sensory capabilities and safety standard definition for future automation.
The introduction of computer vision into driving tasks and the increasingly successful implementation of automated trains in metro systems begs the question why such technology is rarely available for longer-distance trains. One of the challenges for automation on long-distance, open-track systems is a lack of research on reasonable safety standards for obstacle detection, including benchmarks for performance of automated systems. This study aims to measure how train drivers perform in safety-critical situations – when they encounter obstacles on the tracks – to better understand this task and provide a foundation for such a benchmark.
Detailed knowledge of train conductors’ ability to perceive and react to objects along the tracks is required to estimate the status quo of safety. Cur- rently, estimates for reasonable reaction times are lacking and there is limited
knowledge on which factors influence the reaction time for train driving tasks.
ATO and Automation in the German Railway System Since automation presents ample opportunity for increasing safety, reliability and efficiency in railway operations, Automated Train Operation (ATO) sys- tems have been the subject of research going back decades (compare Milroy, 1980; Quintin & Eanes, 1975) and continuing to the present day (com- pare Yin et al., 2017). Highly automated trains are already in operation in some urban railway systems across the world, including metro lines in Paris, Barcelona, and Sydney (“Barcelona Metro Line 9,” 2012; Cuenca, 2020; Sydney Metro, 2023).
In trains outside of metro systems, adoption of ATO has been much slower, partially due to the additional ambient risks present in train operations on open tracks. Keeping passengers and other non-professionals at a safe dis- tance from the tracks and preventing outside interference with train operation is more feasible in urban metro lines, where much of the route lies above or below street level, as opposed to high-speed and long-distance rail, where this separation is not feasible to the same extent.
Therefore, ensuring safety during operation is more complicated in open- track train operation and in the implementation of ATO on open-track systems. There is a need to define what requirements technology has to fulfill to be deemed safe enough – in Germany and internationally. The requirements for the safety of ATO technology should be modeled on the performance of train drivers, introducing a need for benchmarks of human performance. This applies specifically to the recognition of obstacles on the tracks, as persons, animals, and objects can enter the track environment more easily in long-distance, open-track train operation.
Train Driver Vision and Performance Train drivers are at the heart of train operation – and their constant moni- toring of the tracks for dangerous situations like obstacles appearing along the tracks is a largely visual task. While there is a lack of research on train drivers’ vision with regards to obstacle recognition specifically, their visual performance under different circumstances has been investigated in different tasks.
For example, visibility has been identified as a contributing factor to rail- way accidents and incidents in several studies (Kyriakidis et al., 2012; Van Der Flier & Schoonman, 1988). Driving speed can also impact visual per- ception through the way it modifies gaze behavior. Specifically, train drivers show more vertical and fewer horizontal gaze fixations at higher speeds, and more horizontal gaze movements and side-to-side gaze fixations at lower speeds (Suzuki et al., 2019). The use of train protection systems may also influence driver performance. Train drivers using a PZB train protection sys- tem, the point-wise train protection system commonly employed in Germany, were found to allocate less attention to monitoring the tracks and more atten- tion to the driver’s desk than those not using the PZB system (Giesemann &
When Something Is in the Way: Parameters of Perception and Reaction Speed 283
Naumann, 2015). Another study found similar results for UK train drivers operating trains equipped with ETCS (Naghiyev et al., 2017).
Overall, both environmental and operational parameters influence how train drivers perform in visual tasks. In order to better understand the task of obstacle recognition along the tracks, both types of variables should therefore be considered.
METHODS
Two studies were conducted to establish a benchmark and identify factors that influence the reaction speed of train drivers – a simulator experiment with professional train drivers as subjects and a larger-sample online study with non-professionals, to provide converging evidence on the identified influential factors. A sample description can be found in Table 1.
Table 1. Sample description of participants for both studies. *Gender data was missing for five participants of the online study due to technical issues.
Table available in the original PDF paper.
n Age Range (mean, SD) Gender (male/female)
Professional Experience Range in Years (mean, SD) Simulator Study 25 22-57 (33.68, 11.39) (25/0) 1-39 (9.92, 11.01) Online Study 70 19-65 (31.95, 11.74) (31/34)* -
In the simulator study, participants were asked to drive a train and react to obstacles represented by stimuli on the tracks, using the high-fidelity RailSET® simulation environment with VIRES simulation technology (Johne & Busse, 2016). In the online study, participants watched videos from the simulator of the approach on the stimulus and were asked to react to stimu- lus appearances. Stimuli appeared on the tracks 800m ahead of the train and were visible continuously until they were passed. Shortly before passing the stimulus, the stimulus would move to a location next to the tracks to avoid the simulated train passing through them. Stimuli appeared as uniform-color cubes.
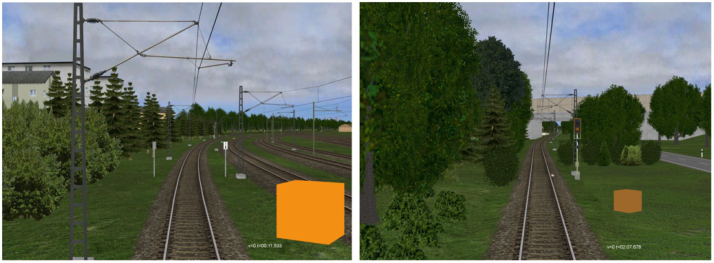
Design Both studies followed a within-subjects design with an incomplete 2x2x3x3 design, with reaction time as a dependent variable. For both studies, reaction time was measured from stimulus appearance to a button press by the par- ticipant. Both stimulus properties (size, contrast) and operational parameters (train speed, train operation condition) were considered in the hypotheses regarding the impact on reaction time. All independent variables and their levels are shown in Table 2. Examples of the visual appearance of stimuli can be found in Figure 1.
Not all possible combinations of train speed and train operation condition were tested. Instead, only two plausible speed conditions were chosen for PZB and ETCS, respectively. Since slow, self-determined driving speed and speed adjustments are an important aspect of on-sight driving, this condition was only evaluated in the simulator study and reduced in scope, only including a variation in stimulus contrast. All tested conditions are laid out in Table 3.
Table 2. Independent variables in the study and their levels. Not all possible combinations of the included levels were tested in the study.
Figure 1: A large, high contrast stimulus (left) and a small, low-contrast stimulus (right) as shown in both studies.Table 3. Overview of the conditions tested in both studies. On-sight driving was only tested in the simulator study.
In addition to measurements of reaction time, participants were asked to rate their sleepiness using the Karolinska Sleepiness Scale (Shahid et al., 2011).
Hypotheses Size and contrast were expected to influence stimulus salience, and were therefore expected to influence reaction time, with lower contrast as well as
When Something Is in the Way: Parameters of Perception and Reaction Speed 285
smaller stimuli leading to increased reaction times. Driving speed and train operation condition – represented by the use of different train protection systems – were included as operational parameters of train driving. Higher driving speed was expected to bring appearing stimuli into focus faster due to increased verticalization of gaze behavior, thus decreasing reaction time. The train protection systems were expected to influence reaction time via atten- tional demands – while the ETCS keeps much of the driver’s attention on the driver’s desk and the controls, the PZB system relies much more on drivers focusing their attention close to the tracks. In on-sight driving, driver atten- tion is almost entirely focused on the tracks. Reaction times were expected to be shorter in conditions with lower attentional demands at the driver’s desk in the simulator study. In the online study, the train protection system in use was expected to have no impact, since there were no tasks to complete at the driver’s desk for the online study participants. The hypotheses can be summarized as follows:
H1: Reaction time is increased for small stimuli compared to large stimuli.
H2: Reaction time is increased for low-contrast stimuli compared to high- contrast stimuli.
H3: Reaction time is increased at low speeds compared to high speeds.
H4.1: Reaction time is increased when using a train protection system compared to driving on-sight.
H4.2: Reaction time is increased when driving with PZB compared to ETCS in the simulator study, but not the online study.
Data Analysis The reaction time data was preprocessed by removing button presses out- side the stimulus appearance window and excluding online study trials where participants reported technical difficulties. This resulted in 426 observations from 25 participants for the simulator study and 925 observations from 68 participants for the online study.
For hypothesis testing, reaction times were log-transformed and analyzed using a linear regression model. An initial model comparison revealed a sig- nificant improvement of model fit when including a subject-specific intercept in the online study (L-Ratio = 454.94, p < 0.01), but not the simulator study (L-Ratio = 1.35, p = 0.25). Therefore, simple regression was chosen for the simulator study, while the online study was evaluated using a multilevel approach.
where α is the intercept, ui the subject-specific intercept adjustment for each subject i only present for the online study, β1−4.2 the parameters determining slope, and the variables coded as shown in Table 4.
Table 4. Variable coding as used in the simulator study. Where differing codes were used in the online study, they are added in round brackets.
Hypotheses were tested as one-sided t-tests over model parameters at α = 0.05. The impact of sleepiness and demographic variables on reaction time was evaluated descriptively.
RESULTS
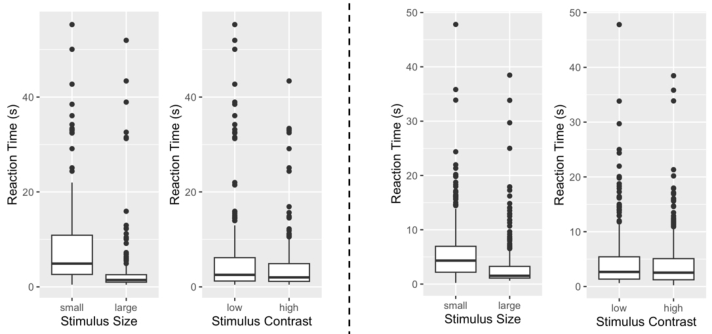
Reaction Time Small stimuli were expected to be associated with higher reaction times (H1). Median and geometric mean reaction time was higher for small stimuli than large stimuli as expected in the simulator study (small/large, Med: 4.91s/1.45s, GM: 5.09s/1.77s) and in the online study (small/large, Med: 4.33s/1.53s, GM: 3.97s/1.98s). Similarly, median and geometric mean reaction time was higher for low-contrast stimuli in the simulator study (low/high, Med: 2.54s/2.0s, GM: 3.16s/2.49s) and online study (low/high, Med: 2.66/2.53, GM: 2.88s/2.69s), confirming hypothesis H2. Figure 2 provides an overview of the data for both studies.
Figure 2: Reaction time with regards to stimulus properties size and contrast, for the simulator study (left) and the online study (right).
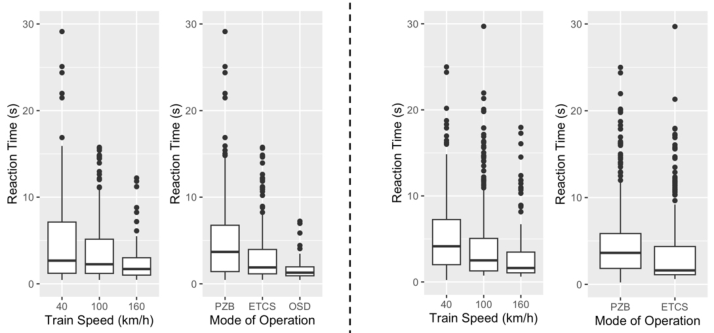
The reaction times observed at different train speeds also confirmed the hypotheses: Reaction times were higher at lower speeds (H3), both in the simulator study (40/100/160km/h, Med: 8.08s/2.29s/1.77s, GM: 7.8s/2.58s/1.76s) and in the online study (40/100/160km/h, Med: 4.22s/2.51s/1.62s, GM: 3.94s/2.75s/1.96s).
When Something Is in the Way: Parameters of Perception and Reaction Speed 287
Regarding the train protection system, the observed data was less con- sistent with the hypotheses. It was expected that reaction times would be lowest for on-sight driving (H4.1) and higher in ETCS driving than when using the PZB system (H4.2). In the simulator study, observed reaction times were lower for the ETCS condition than the PZB condition, and even lower in the on-sight driving condition (PZB/ETCS/On-sight, Med: 4.49s/1.91s/1.29s, GM: 4.32s/2.21s/1.47s). Reaction times were also lower in the ETCS condition than the PZB condition in the online study (PZB/ETCS, Med: 3.67s/1.61s, GM: 3.53s/2.18s). Compare Figure 3 for an overview of the distribution of the data regarding the operational parameters.
Figure 3: Reaction time with regards to operational parameters train speed and train operation condition, for the simulator study (left) and the online study (right).
The results of the linear modeling approach and the associated hypothesis tests can be found in Table 5 for the simulator study, and in Table 6 for the online study.
Table 5. Results of linear modelling and hypothesis tests in the simulator study. The model accounted for just under 50% of variance in the sample (R2 = 0.4535, R2adj = 0.446).
All tested factors except train operation condition (ETCS versus PZB in the simulator study) were found to have a significant effect on reaction time, in the expected directions. Therefore, the hypotheses that reaction time is
increased for small stimuli and low contrast can be accepted (H1, H2). Regarding train speed, the analysis shows that reaction time was higher at 40 km/h than at faster speeds, and higher at 100 km/h than at 160 km/h, con- firming H3. Regarding train operation conditions in the simulator study, the hypothesis that driving on-sight would decrease reaction time can be accepted (H4.1), while the variation of the train protection system in use (PZB/ETCS) did not in fact show a significant effect. Instead, a significant difference could be observed in the online study, where it was not expected. Therefore, H4.2 was not accepted.
Table 6. Results of linear modelling and hypothesis tests in the online study. The model accounted for about 25% of variance in the sample (R2 = 0.25, R2adj = 0.2459).
Evaluating the exponentiated coefficients of the model for the simulator study to predict geometric mean reaction times as a benchmark reveals the differing impacts the independent variables have on the predicted reaction time. The resulting model predicts a 175% increase in the geometric mean reaction time for small stimuli, a 25% increase for low-contrast conditions, and 104% longer reaction time for train protection system conditions com- pared to on-sight driving. Slower speeds also led to increased reaction times, with 120% increased predicted geometric mean reaction time at 40km/h compared to fast driving, and a 54% increase at 100 km/h compared to driving at 160km/h.
OTHER VARIABLES Demographic variables and sleepiness ratings were not included in the linear model, but analyzed descriptively. Age had a minimal correlation with reac- tion time in the simulator study (Spearman’s Rank Correlation, r = 0.062) as well as the online study (Spearman’s Rank Correlation, r = −0.087). The correlation of reaction time with years of experience as measured in the sim- ulator study was small as well (Spearman’s Rank Correlation, r = 0.108). Because of the all-male sample of the simulator study, the impact of gender could only be evaluated in the online study, where the difference in reaction time was negligible (male/female, GM: 2.64/2.50).
An evaluation of sleepiness shows that sleepiness ratings differed more widely in the online study, where participants rated their sleepiness between the items “extremely alert” (1) and “sleepy, but some effort to keep awake” (8). In the simulator study, participants rated their sleepiness between “very alert” (2) and “some signs of sleepiness” (6).
When Something Is in the Way: Parameters of Perception and Reaction Speed 289
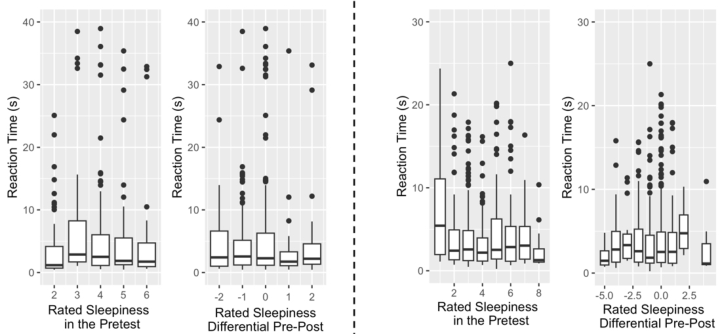
Figure 4: Reaction time with regards to sleepiness. Sleepiness rating before the exper- iment and reaction time and sleepiness differential before and after the experiment plotted against reaction time for the simulator study (left) and the online study (right). Sleepiness was rated from 1 to 10, with higher values indicating increased sleepiness.
Despite the large range of sleepiness ratings, an inspection with regards to reaction time reveals no clear patterns based on sleepiness rating in the pretest or based on the differential of pretest sleepiness to posttest sleepiness (compare Figure 4).
DISCUSSION & CONCLUSION The implementation of ATO technology in open-track railway systems depends on the development of requirements for the safety of the ATO sys- tem. Human train divers should be used as a benchmark in the development of these safety requirements. Therefore, it needs to be determined how human train drivers perform with regard to obstacle detection. Previous research has identified variables that influence train drivers’ visual ability, but a specific benchmark for obstacle recognition tasks and a comprehensive understand- ing of how train drivers perform at this task under different conditions is still lacking. The aim of this research was to lay the foundation for establishing a benchmark by evaluating train drivers’ reaction speed when encountering obstacles along the tracks.
The results of the studies confirm most of the hypotheses based on previous research. They show that obstacle size and contrast as well as train speed have a clear impact on reaction time. The results are also consistent with the hypothesis that driving on-sight should lead to lower reaction times, as more attention is allocated to the track environment. However, the hypothesis that driving equipped with ETCS should lead to higher reaction times compared to the PZB condition could not be confirmed. One reason for this could be the differences in track design between ETCS and PZB routes. The PZB route is more varied with regards to vegetation and buildings, the route curves more, and is not framed by overhead line masts. This may offer more salient cues
outside the track environment, leading to more visual exploration away from the tracks and therefore higher reaction times.
Overall, the results regarding train protection system are inconclusive and the design of tracks may be a variable that should be investigated for its significance in influencing reaction time in future research.
The findings from this research also provide a baseline for further research on train driver sensory capabilities and safety standard definition for future automation. While the predictive model generated in this research is mathe- matically very simplistic and does not adequately capture the full complexity of the task, it represents a first attempt to better describe the impact of a variety of factors on the obstacle recognition task in train driving.
The studies conducted have some limitations: Although a sophisticated simulation environment was used for the simulator study, a laboratory envi- ronment cannot fully replicate the real-world environment and experience of driving a train. Therefore, the results may not be fully generalizable to real-world scenarios. Especially the train protection system, which did not lead to the expected effects in either study, should be investigated further in a real-world testing paradigm.
The research conducted also makes no claim to completeness - the work of train drivers is a highly complex one and even the task of obstacle detection along the tracks is influenced by a complicated interplay of variables, not all of which could be accounted for in the studies.
Overall, automation provides opportunities to make our railway networks safer and more efficient. To take full advantage of the developments in this field, research on how humans perform at potentially automatable tasks is a vital frame of reference. This research can provide an idea of what human performance can look like in the specific task of obstacle detection, and how it can be studied.
ACKNOWLEDGMENT
This research was conducted as part of a project commissioned by the Ger- man Centre for Rail Traffic Research. The authors would like to acknowledge the many people that have contributed to project ATO-Sense for their work. Sincere thanks also belong to our participants, especially the train drivers who supported this research with their time and expertise.
REFERENCES
Barcelona Metro Line 9. (2012, October 3). Railway Technology. https://www.rail way-technology.com/projects/barcelona-metro-line-9/ Cuenca, O. (2020, December 15). Paris inaugurates Line 14 extension. Interna-
tional Railway Journal. https://www.railjournal.com/passenger/metros/paris-ina ugurates-line-14-extension/ Giesemann, S., & Naumann, A. (2015). The Effect of Train Protection Systems on Train Drivers’ Visual Attention. Johne, M., & Busse, M. (2016). RailSiTe®(Rail Simulation and Testing). Journal of
large-scale research facilities JLSRF, 2, A88-A88.
When Something Is in the Way: Parameters of Perception and Reaction Speed 291
Kyriakidis, M., Majumdar, A., Grote, G., & Ochieng, W. Y. (2012). Development and Assessment of Taxonomy for Performance-Shaping Factors for Railway Opera- tions. Transportation Research Record, 2289, 145–153. https://doi.org/10.3141/ 2289-19 Milroy, I. P. (1980). Aspects of Automatic Train Control [Dissertation]. Loughbor-
ough University. Naghiyev, A., Sharples, S., Carey, M., Coplestone, A., & Ryan, B. (2017).
ERTMS Train Driving-Incab vs. Outside: An Explorative Eye-Tracking Field Study. Contemporary Ergonomics and Human Factors 2014: Proceedings of the International Conference on Ergonomics & Human Factors 2014, 343. Quintin, W. P., & Eanes, T. S. (1975). BART Progress Report. 1975 Automotive Engineering Congress and Exposition. Shahid, A., Wilkinson, K., Marcu, S., & Shapiro, C. M. (2011). Karolinska Sleepiness
Scale (KSS). In STOP, THAT and One Hundred Other Sleep Scales (pp. 209–210). Springer New York. https://doi.org/10.1007/978-1-4419-9893-4_47 Suzuki, D., Yamauchi, K., & Matsuura, S. (2019). Effective Visual Behavior of Railway Drivers for Recognition of Extraordinary Events. Quarterly Report of RTRI, 60(4), 286–291. Sydney Metro. (2023). Sydney Metro: Australia’s Biggest Transport Project. https:
//sydneymetro.info Van Der Flier, H., & Schoonman, W. (1988). Railway Signals Passed at Danger: Situational and Personal Factors Underlying Stop Signal Abuse. In Applied Ergonomics (Vol. 19). Yin, J., Tang, T., Yang, L., Xun, J., Huang, Y., & Gao, Z. (2017). Research and
Development of Automatic Train Operation for Railway Transportation Systems: A Survey. Transportation Research Part C: Emerging Technologies, 85, 548–572. https://doi.org/10.1016/j.trc.2017.09.009
LISTED IN THE AHFE DIGITAL BOOKSTORE CATALOGUE
Explore the complete digital volume
Human Systems Engineering and Design (IHSED 2023): Future Trends and Applications
Read this individual research paper free through the original publisher, or explore the full digital proceedings book.
ISBN 978-1-958651-88-9
Explore this ISBN in the AHFE Bookstore ↗Listed in the July 2026 bookstore catalogue; search by ISBN to confirm current availability · Digital book purchase optional