Nahyun Lee, Jieming Zhang, Yongho Lee, Taekun Kim, Hyewon Kim, Hong Jin Jeon (2023). Classification of Depression Based on Functional Near-Infrared Spectroscopy (fNIRS) Signals Using Machine Learning Algorithms. In: Human Systems Engineering and Design (IHSED 2023): Future Trends and Applications. AHFE Open Access, vol. 112, pp. 416–425. https://doi.org/10.54941/ahfe1004154
Depression is a significant mental health issue affecting individuals worldwide. In this study, we aimed to classify healthy, depressed, and suicidal individuals using functional nearinfrared spectroscopy (fNIRS) signals combined with machine learning algorithms. The dataset consisted of fNIRS measurements collected from participants in different mental states. Our experiment indicates that the implementation of the histogram based gradient boosting algorithm (HGBM) achieved the highest accuracy rate of 78.76% and the highest precision rate of 92% for depressed category. The HGBM outperformed other algorithms such as k-NN and CatBoosting. The study highlights the potential of fNIRS and machine learning in the detection and classification of depression.
Major depressive disorder (MDD) is one of the most prevalent mental health problems globally, impacting approximately 280 million people worldwide (World Health Organization, 2017). Moreover, MDD is a nontrivial social concern due to its strong correlation with suicide. MDD is implicated in up to 87% of completed suicides (Cai et al., 2021). Therefore, early identification of MDD and suicidal ideation is crucial for the prompt provision of appropri- ate medical intervention to the MDD patients and for helping to lower global suicide rates. Traditional approaches for diagnosing and monitoring mental illnesses rely on self-assessment and clinical evaluation, which are subjective
Classification of Depression Based on fNIRS Signals Using Machine Learning Algorithms 417
measures based on patients’ perspectives. As a result, the accuracy and effi- cacy of the diagnosis heavily rely on the consistency and reliability of how the patient evaluates their current situation and effectively communicates this to medical experts.
Functional near-infrared spectroscopy (fNIRS) is a non-invasive functional imaging modality that utilizes near-infrared light to measure changes in cere- bral blood flow and oxygenation, providing valuable insights into brain activity. Due to its favorable spatial resolution, cost-effectiveness, and porta- bility, it has gained popularity recently as a method for observing brain activity (Kazuki and Tsunashima, 2014). This makes fNIRS an attractive tool for studying mental health conditions such as MDD and suicidal ideation, allowing for potential advancements in early detection and intervention strategies.
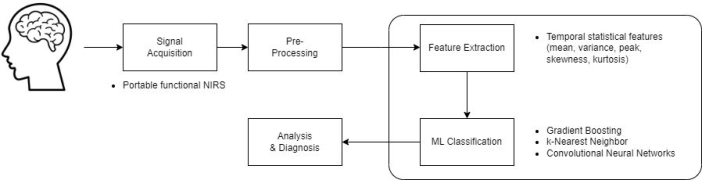
Therefore, the objective of the present study is to develop an fNIRS-based MDD and suicidality diagnosis system, as in Figure 1. The study aims to differentiate the fNIRS signals obtained from healthy individuals, MDD patients without suicidal ideation, and MDD patients with suicidal ideation using machine learning classification algorithms. Initially, the fNIRS signals will undergo preprocessing to remove noise and motion artifacts, followed by the extraction of statistical features from the data. Subsequently, var- ious machine learning algorithms will be investigated, including gradient boosting-based ensemble learning, k-nearest neighbor (k-NN), and categor- ical boosting (CatBoosting), to evaluate their performance in the accurate classification of the aforementioned three classes.
Figure 1: Detailed pipeline of the system.
RELATED WORKS In this section, we present previous studies that are relevant to the objective of our research, which is to develop an fNIRS based Major Depressive Disorder (MDD) and suicidal ideation diagnosis system capable of differentiating between healthy individuals, MDD patients without suicidal ideation, and MDD patients with suicidal ideation using machine learning classification algorithms.
Previous studies have attempted to compare fNIRS data between pairs of the three classes: healthy controls, depressed individuals, and individuals with suicidal tendencies. Pu et al., (2015) investigated changes in oxy- genated hemoglobin (oxy-Hb) and deoxygenated hemoglobin (deoxyHb) in the prefrontal cortex of MDD patients during Verbal Fluency Test
(VFT). They observed distinct hemodynamic changes in MDD patients with suicidal ideations, emphasizing fNIRS’ potential in detecting suicidal tendencies.
Similarly, Tsujii et al. (2017) utilized a 52-channel fNIRS device to record hemoglobin concentration changes during VFT in MDD patients. Their findings demonstrated unique patterns of fNIRS signals in the left precentral gyrus region of MDD patients with suicidal behaviors, further supporting the link between fNIRS measurements and suicidal tendencies.
Furthermore, Baik et al. (2019) examined prefrontal asymmetry using fNIRS during VFT to assess suicidality in MDD patients. Their study emphasized the asymmetry in activity between the left and right brain hemi- spheres, revealing higher prefrontal cortex activation in participants with suicidal ideations. This underscores fNIRS’ potential in detecting suicidal tendencies.
Moreover, Zhu and Mehta (2017) utilized fNIRS data to train a machine learning classification model for the identification of depression. Their study involved placing fNIRS probes bilaterally between F7 and F8 based on the international EEG 10–20 system. By extracting statistical features and train- ing simple classification models such as support vector machine (SVM) and logistic regression (LR), they achieved an accuracy rate of up to 85% in detecting MDD using fNIRS data.
While previous studies have explored various aspects of fNIRS data anal- ysis in the context of MDD and suicidal ideation, our study aims to extend their work by developing a comprehensive system that can differentiate all three classes (healthy individuals, MDD patients without suicidal ideation, and MDD patients with suicidal ideation) using machine learning classi- fication algorithms. Building on prior studies, our aim is to advance the accuracy and efficacy of fNIRS-based diagnostic systems for MDD and suicidal ideation, contributing to the existing knowledge in this field.
METHODOLOGY
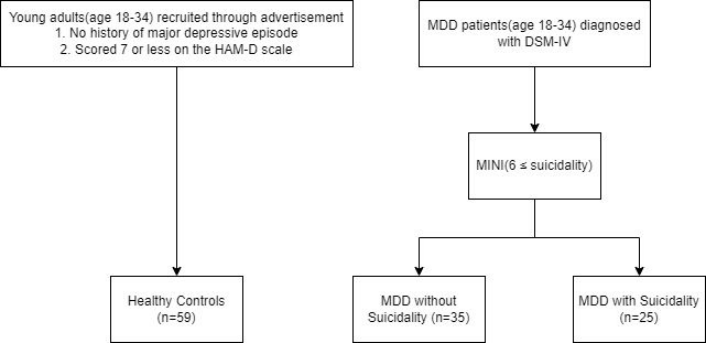
Dataset The fNIRS data is obtained from Samsung Medical Center in Seoul, Republic of Korea. 60 patients with MDD (35 without suicidality and 25 with suici- dality) and 59 healthy controls (HC) aged between 18 and 34 participated, as demonstrated in Figure 2). Patients with MDD were recruited through the outpatient clinic of Samsung Medical Center in Seoul, Republic of Korea, and HCs were recruited from the community through advertisements released by the Clinical Trial Center of Samsung Medical Center between July 2018 and October 2020. Diagnosis of MDD and evaluation of suicidality were conducted based on the Korean version 5.0.0 of the Mini International Neu- ropsychiatric Interview (MINI) and the Diagnostic and Statistical Manual of Mental Disorders IV (DSM-IV). Among MDD patients, subjects who scored moderate or high on the MINI suicidality item are labeled as the suicidal group.
Classification of Depression Based on fNIRS Signals Using Machine Learning Algorithms 419
Figure 2: Dataset subject flowchart.
The participants underwent assessments for oxy-Hb changes in the pre- frontal cortex during VFT using fNIRS at baseline, 4 weeks, and 8 weeks. In addition, psychological indices and demographic information were also collected.
The device used for data collection is a high-density fNIRS (NIRSIT, OBELAB, Seoul, Republic of Korea) with 24 dual wavelength laser diodes (780/850 nm) and 32 photodetectors. The laser and detector pairs were sep- arated by a distance of 3 cm at 48 sensing areas; the optical signal variation for each channel was sampled at a rate of 8.138 Hz. Additional details con- cerning the data collection protocol may be found in the research of Kim et al., (2022).
Preprocessing During fNIRS preprocessing, light intensity measurement is converted into changes in optical density (OD), and to changes in hemoglobin concentra- tion using the Modified Beer Lambert Law (MBLL), a mathematical equation that describes the relationship between light attenuation and pathlengths (Kocsis et al., 2006).
Prior to converting the raw light intensity measurements into changes in OD, the acquired fNIRS raw data is quality assessed to remove physiological and instrument noise. The raw data is filtered using a low-pass filter at 0.5 Hz using a sixth-order zero-phase Butterworth filter, and the quality of each channel is checked based on two criteria mentioned below (Shin et al., 2017) coefficient of variance(CV) = 100 ∗σ/µ < 40
light intensity < 10
µ and σ indicate the mean and standard deviation of the signal acquired during a single session. The entire channel is rejected if more than one crite- rion is not met for one of the two wavelength measurements. After the quality assessment, we derive changes in hemoglobin concentration using Homer-3 (MATLAB 2017b).
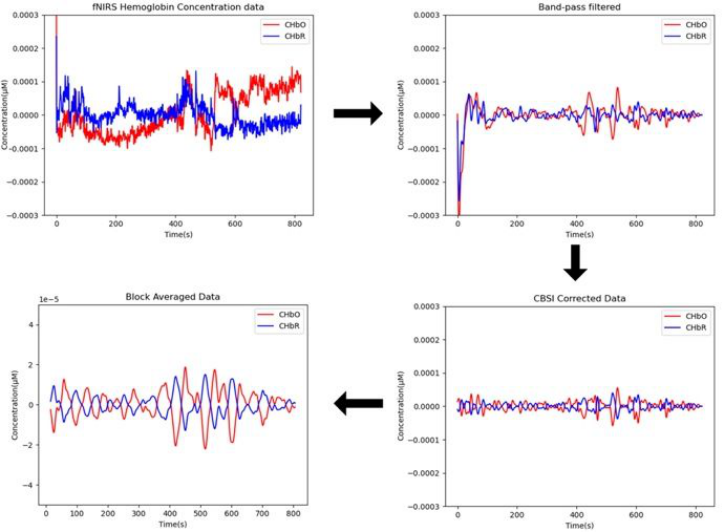
The converted hemoglobin data is band-pass filtered at 0.01-0.09 hz with a 6th order zero-phase Butterworth filter, and then is further corrected using CBSI (Correlation Based Signal Improvement) method. Finally, the signals are block averaged for further noise reduction and signal improvement as in Figure 3.
Figure 3: Preprocessed hemoglobin data.
Feature Extraction The features of the brain activity signal will be derived from temporal anal- ysis of the 1cHbO signal. In the context of conventional machine learning (ML) algorithms, five distinct statistical measures (mean, variance, skewness, kurtosis, and peak) of change in oxy-Hb signals may be derived (Hamid et al., 2022). In this study, the 5 statistical measures are calculated for each channel, resulting in a maximum of 240 features per patient data.
Machine Learning Algorithms for Classification
1) Histogram-based Gradient Boosting Algorithm: The objective of ensemble learning is to train weak learners and combine them into strong learn- ers. Boosting is an ensemble learning algorithm that reduces deviation in supervised learning. Gradient boosting, a specific variant, employs gradient descent optimization and treats training as an additive model for iterative improvement. The Histogram-Based Gradient Boosting Algorithm (HGBM) combines histogram binning and gradient boosting principles. It discretizes
Classification of Depression Based on fNIRS Signals Using Machine Learning Algorithms 421
numerical features using histogram binning and performs gradient-boosting iterations. Each iteration involves the following steps: a. Gradient computation; b. Histogram construction; c. Histogram gradient computation; d. Tree construction; e. Prediction updates by HGBM (by adding the prediction of the latest constructed tree weighted by the learning rate).
2) Categorical Boosting Algorithm: The categorical boosting algo- rithm (CatBoosting) is an effective gradient-boosting framework. It focuses on efficiently handling categorical features by employing spe- cialized algorithms for categorical data. CatBoosting can handle cate- gorical features directly without explicit encoding. It internally includes an algorithm called “Symmetric tree” to optimally partition categorical features.
3) K-Nearest Neighbors Algorithm: The k-Nearest Neighbors (k-NN) algorithm is used to classify new data points according to the majority class of the “k”nearest neighbors in the feature space. In other words, k-NN deter- mines the class of an unlabeled data point by checking the class labels of its nearest neighbors.
Evaluation Metric To evaluate the performance of our methodology, we will utilize accuracy, precision, sensitivity, and F1-score as the evaluation metrics. Accuracy repre- sents the ratio of correctly classified samples to the total, measuring overall correctness. Precision is the ratio of true positives to the sum of true positives and false positives, indicating the relevance of predicted positives. Sensitivity, also known as recall, is the ratio of true positives to the sum of true posi- tives and false negatives, assessing the classifier’s ability to identify positive samples.
The F1-score is the harmonic mean of precision and recall, giving equal importance to both metrics. It offers a balanced measure when consid- ering both precision and recall simultaneously, particularly in imbalanced datasets.
RESULTS AND ANALYSIS Implementation Details
After preprocessing, the remaining amount of data in our dataset is 335, including 172 HC, 98 depressed (DP), and 65 suicidal (SC). We split the data according to an 8:2 ratio for training and testing data, respec- tively. As a result, there are 268 samples for training and 67 samples for testing. For HGBM, we set the learning rate to 0.1, number of iterations to 100, and number of bins to 256. For k-NN, we set the number of neighbours to 1 and 2. For CatBoosting, we set the learning rate to 0.1, and choose
decision tree as the estimator, for which the number of estimators will be set to 100.
Since the lack of data hinders the performance of the machine learning algorithms, we propose to use Gaussian noise to augment the data features. We set µ and σ to 0 and 0.1, respectively. After we extract the features, we augment the DP class once and the SC class twice to make the classes more balanced. The total number of samples for the new feature set is 563, which is consisted of 172 HC, 196 DP, and 196 SC. We observe the splitting rate, so there are 450 samples for training and 113 samples for testing.
Classification Based on Machine Learning Algorithms Firstly, we evaluate the augmentation effectiveness. We conducted experi- ments before and after augmentation using the HGBM algorithm. Table 1 illustrates that before augmentation, the model had an accuracy of 51%, where the precision for depression was 53% and the sensitiv- ity was 39%. After augmentation, the precision of the model improves to 78.76%, and the accuracy of the classification of depression is 92%, which is the highest among the three categories, and the sensitivity is 77%.
Table 1. Comparison of results between original and augmented data using HGBM.
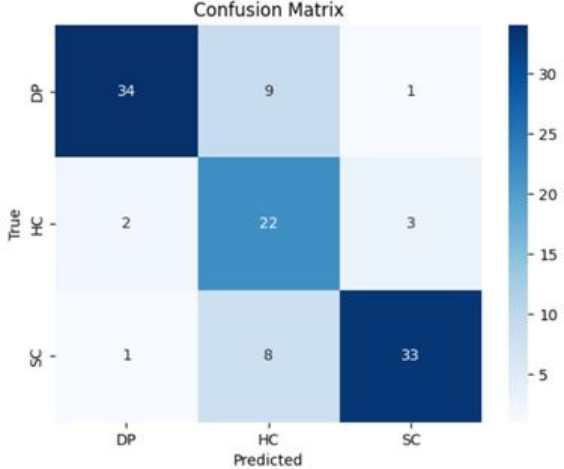
We compare the results acquired through HGBM with other machine learning algorithms, using augmented data (Table 2). Notably, the k-NN algorithm achieves a sensitivity of 93% for the depressed class at n = 2. The CatBoosting algorithm achieves the highest accuracy rate of 89% for the depressed class. However, when considering accu- racy, sensitivity, and the balanced F1-score evaluation, the HGBM algo- rithm achieves the highest F1-scores of 84% for depression and the suicidal class. The overall model accuracy is 78.76%. The confusion matrix visualization (Figure 4) shows the best performance of the HGBM algorithm.
Classification of Depression Based on fNIRS Signals Using Machine Learning Algorithms 423
Figure 4: Confusion matrix for HGBM algorithm.Table 2. Comparison of analysis results using various algorithms.
Our analysis reveal that the HGBM outperforms other algorithms. The reason for this is believed to be because of certain factors detrimental to the accurate measurement of data, which are outside of the control of the
researchers. These factors may include signal loss due to mechanical reasons, and undetected outliers which are impervious to the preprocessing meth- ods used in this study. However, the HGBM’s class-wise binning enhances robustness against these factors. Grouping similar feature values during bin- ning makes the algorithm insensitive to individual extreme values. Moreover, the HGBM only requires storing histogram bins instead of individual feature values, improving memory efficiency and training time.
CONCLUSION
In this study, we aimed to develop a portable fNIRS based diagnostic system for MDD and suicidal ideation. By employing ML classifiers, we successfully classified the three classes of HC, DP, and SC.
Through experimentation on the fNIRS dataset, we find that the HGBM algorithm achieves the best performance, with the highest accuracy of 92% for depression, the highest F1-score of 84% for the DP and SC classes. The overall accuracy of the model is 78.76%.
Nevertheless, it is important to acknowledge the limitations of our approach. In this study, we utilized five commonly used statistical features that are frequently employed in fNIRS classification studies and proven to be effective. However, we recognize the need to engineer more suitable fea- tures for our specific research context. Also, as we aimed to propose a system that is highly portable and easy to use outside of laboratory conditions, we conducted the experiments under the premise that the task location was not available. This may have also resulted in lower performance compared to other research which took into account the exaction of activity set data. In future studies, we intend to enhance classification accuracy by incorporating additional features, such as automatic active region detection and connectiv- ity based spatial features. Also, by improving the feature selection process, we aim to create a more effective feature set, thereby improving the overall classification performance of our diagnostic system.
ACKNOWLEDGMENT
Funding This work was supported by the Technology Innovation Program (or Industrial Strategic Technology Development Program-Source Technology Development and Commercialization of Digital Therapeutics) (20014967, Development of Digital Therapeutics for Depression from COVID19) funded By the Ministry of Trade, Industry & Energy(MOTIE, Korea) and Healthcare AI Convergence Research & Development Program through the National IT Industry Promotion Agency of Korea(NIPA) funded by the Ministry of Science and ICT(No. S1601-20-1041).
Computing Resources: This work was supported by the Artificial Intelligence Industrial Conver-gence Cluster development project funded by the Ministry of Science and ICT(MSIT, Korea) & Gwangju Metropolitan City the authors would like to acknowledge.
Classification of Depression Based on fNIRS Signals Using Machine Learning Algorithms 425
REFERENCES
Baik, S. Y., Kim, J.-Y., Choi, J., Baek, J. Y., Park, Y., Kim, Y., Jung, M., & Lee, S.-H.
(2019). Prefrontal asymmetry during cognitive tasks and its relationship with suicide ideation in major depressive disorder: An fNIRS study. Diagnostics, 9, 193. Cai, H., Xie, X.-M., Zhang, Q., Cui, X., Lin, J.-X., Sim, K., Ungvari, G. S., Zhang, L., & Xiang, Y.-T. (2021). Prevalence of suicidality in major depressive disor- der: A systematic review and meta-analysis of comparative studies. Frontiers in Psychiatry, 12. Hamid, H., Naseer, N., Nazeer, H., Khan, M. J., Khan, R. A., & Shahbaz Khan, U.
(2022). Analyzing classification performance of fNIRS-BCI for gait rehabilitation using deep neural networks. Sensors, 22, 1932. Kazuki, Y., & Tsunashima, H. (2014). Development of portable brain-computer interface using NIRS. In 2014 UKACC International Conference on Control (CONTROL) (pp. 702–707). Kim, H., Choi, J., Jeong, B., Fava, M., Mischoulon, D., Park, M. J., Kim, H. S., &
Jeon, H. J. (2022). Impaired oxygenation of the prefrontal cortex during verbal fluency task in young adults with major depressive disorder and suicidality: A functional near-infrared spectroscopy study. Frontiers in Psychiatry, 13. Kocsis, L., Herman, P., & Eke, A. (2006). The modified Beer–Lambert law revisited.
Physics in Medicine & Biology, 51, N91. Pu, S., Nakagome, K., Yamada, T., Yokoyama, K., Matsumura, H., Yamada, S., Sugie, T., Miura, A., Mitani, H., Iwata, M., Nagata, I., & Kaneko, K. (2015). Suicidal ideation is associated with reduced prefrontal activation during a ver- bal fluency task in patients with major depressive disorder. Journal of Affective Disorders, 181, 9–17. Shin, J., Kwon, J., Choi, J., & Im, C.-H. (2017). Performance enhancement of a brain-
computer interface using high-density multi-distance NIRS. Scientific Reports, 7, 16545. Tsujii, N., Mikawa, W., Tsujimoto, E., Adachi, T., Niwa, A., Ono, H., & Shirakawa, O. (2017). Reduced left precentral regional responses in patients with major depressive disorder and history of suicide attempts. PLoS ONE, 12. World Health Organization. (2017). Depression and other common mental disor-
ders: Global health estimates (Tech. Rep. No. WHO/MSD/MER/2017.2). World Health Organization. Zhu, Y., & Mehta, M. R. K. (2017). Machine learning approach on frontal lobe activity to assess depression in adults: Implications for rehabilitation outcomes. In 2017 International Symposium on Wearable Robotics and Rehabilitation (WeRob) (pp. 1–2).
LISTED IN THE AHFE DIGITAL BOOKSTORE CATALOGUE
Explore the complete digital volume
Human Systems Engineering and Design (IHSED 2023): Future Trends and Applications
Read this individual research paper free through the original publisher, or explore the full digital proceedings book.
ISBN 978-1-958651-88-9
Explore this ISBN in the AHFE Bookstore ↗Listed in the July 2026 bookstore catalogue; search by ISBN to confirm current availability · Digital book purchase optional