Victoria Lopez, Pavel Llamocca, Diego Urgelés, Yury Jiménez, Cesar Guevara, Carlos Viñals, Maria Espinosa (2023). Verification of the integration process of algorithms and sensor data for mental health applications. In: Human Systems Engineering and Design (IHSED 2023): Future Trends and Applications. AHFE Open Access, vol. 112, pp. 457–466. https://doi.org/10.54941/ahfe1004158
Mood disorders are becoming more frequent and, especially after the pandemic years, the importance of analysing and preventing such disorders has become clear. In the worst cases, people can suffer from depression or bipolar disorder leading to hospitalization or sick leave with serious economic and social consequences for the individual and their environment. Thanks to the development of technology, there are increasingly useful portable devices for monitoring individual daily activity. The data collected is very useful for understanding not only the individual's environment but also for characterizing their emotional profile. However, good monitoring requires the use of a diverse set of information sources. Medical consultations are the traditional source of information but in many cases this information is lacking or insufficient. The new sources of information are diverse: smart devices such as smart watches or even the mobile phone itself, portable sensors of various types and even activity records on social networks. All these data can be integrated and processed in such a way that a characterization profile of behaviour related to the emotional state of the individual is determined. However, the manufacturers of these devices apply aggregation algorithms to the monitored data to provide the client with a friendlier and easier to interpret version, but they do not usually provide the raw data collected by the sensors (accelerometer, gyroscope, temperature, etc.). There is still no regulated standardization that obliges the manufacturer to provide the data to the owners of the devices. Both raw data and aggregation algorithms work like a black box in most cases. The information presented by the device applications (generally apps) is very relevant and the interpretation of the users has direct consequences on their behaviour (behaviour modification, medication administration, etc.). For this reason, it is essential to verify the algorithms used in the previous process, guaranteeing that the information integrated (and presented) really corresponds to the information collected by the sensors. In this paper we present a suitable system for the verification of aggregated data from personal activity monitoring sensors. The system includes a parsing algorithm that makes the data structure and relates it to the output. The effectiveness of the algorithm has been tested with real data over a period of two years and for both daytime activity and sleep quality monitoring. The algorithm is perfectly scalable to be used on any device, so the computer system presented can be useful for future computer auditing of this type of process.
Personalized medical (PM) treatment is becoming popular (Tyler, Choi, & Tewari, 2020) in the medical and healthcare industries. PM is about tailoring an individualized treatment specifically for a disease, and it might include the detection of medical conditions through the processing of real-time signals.
A relevant aspect of this field is to have reliable data that can provide accurate information about people’s health state. There are several issues that must be solved before using a medical personalized system, such as data heterogeneity, data treatment and storage, and data processing because this data can be collected from different data sources in real time (Díez Pérez-Villacastín, 2022).
Smartwatches are extensively used nowadays. According to recent statis- tics, the global number of users in the smartwatches segment of the dig- ital health market was forecast to continuously increase and it is esti- mated around 229.51 million users in 2027. The COVID-19 pandemic has prompted many people around the word to be more cautious on the main- tenance of their well-being (López & Cukic, 2021). The growing consumer inclination towards technological devices is due to the attributes to help sim- plify their life. For instance, according to a recent study, companies of the technological industry are shifting their attention towards parents, with the idea of increasing awareness on how smartwatches could enhance the lives of their children by allowing them to be more physically active. Covering many customer necessities can help strengthen customer loyalty. According to the same study, authors mention that more consumers are increasingly putting effort into owning a device that assists in upholding their health.
Several recent research works used smartwatches to monitor people’s men- tal health, as it is an issue that affects millions of people worldwide. The num- ber of cases of mental disorders is increasing, and the resulting economic and social consequences are highly relevant (Llamocca, López, & ˇCuki´c, 2022) (Llamocca, López, Santos, & ˇCuki´c, 2021). According to statistics from the World Health Organization, approximately one in four people will suf- fer from a mental disorder throughout their lives and between 35% and 50% will receive either no treatment or inadequate treatment (Inkster & (DMHDIG), 2021).
Monitoring nocturnal and diurnal motor activities have been considered relevant to prevent a state of crisis ( ˇCuki´c, López, & Pavón, 2020). Detecting an emotional crisis continues being a challenge because it can be triggered differently for each person. This makes it necessary to have a personalized treatment, and therefore have precise and detailed data about the relevant variables, such as sleep patterns (Doncel Pedrosa, 2022), activity levels, and even heart rate, to detect or predict if a person is entering an emotional crisis.
Data provided by companies to the end users is usually aggregated. The rapid development of sensor-based technologies favors the indiscriminate use of unverified results, especially in the areas of the Internet of Things and artificial intelligence, as evidenced in (Datta et al., 2020). To perform the aggregation, raw data is processed, using aggregation algorithms. For this reason, process verification of sensor data aggregation algorithms is a con- stantly evolving research topic. There are different approaches and techniques
Verification of the Integration Process of Algorithms and Sensor Data 459
to address this problem, and various solutions have been proposed to improve the accuracy and efficiency of these algorithms. One of the most widely used techniques for aggregating sensor data is machine learning. Machine learning models are used to classify and predict user behaviour based on data collected by sensors. In addition, signal processing techniques are used to improve the accuracy of the data collected by the sensors. Another approach used in pro- cess verification of sensor data aggregation algorithms is the integration of different data sources. The integration of data from different sensors allows to obtain a more complete picture of user behaviour, which improves the accuracy of data aggregation algorithms. In addition, several solutions have been proposed to improve the scalability of these algorithms. For example, some researchers have proposed the use of distributed architectures to pro- cess large amounts of sensor data in real time (Cortés, Bonnaire, Marin, & Sens, 2015).
In this work, we compare aggregated data provided by a provider with raw data processed using our own aggregated algorithm to compare the precision of the information provided for the provider. The structure of this article is as follows. After this brief introduction, the data used in the study and how the different structures differ are described. Afterwards, the data analysis section is addressed, where the types of aggregate data and raw data are differentiated. The particular aggregation performed for the purpose of our research on mood disorders is also described. The following section shows the comparative results of the manufacturer’s aggregations vs. the particular aggregation, observing significant differences. The article ends with a section of conclusions and a list of useful references for its understanding.
DATA AND DATA INTEGRATION The data used for this study have been obtained from smartwatches. The sensors collect so-called raw data that manufacturers then transform using aggregation algorithms. These algorithms allow analysis for use and inter- pretation.
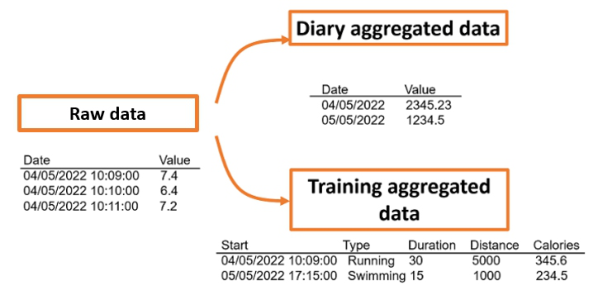
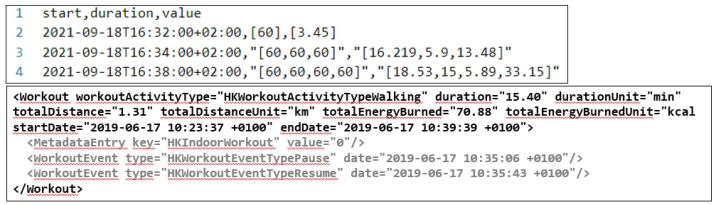
Figure 1 shows a general scheme of this transformation. Specifically, the structures of sensor data from two different devices have been compared, namely the Apple Watch and the Withings Actitity Steel. Figure 2 shows the differences in these structures. In addition, the data collected by the second device for a user over a period of more than two years has been analysed.
The dataset downloaded from the Withings application contains a file structure with raw data, aggregated data, and double-aggregated data. The most relevant files in this structure are described in Table 1. The activities.csv data file contains the values of a double aggregation carried out by the man- ufacturer and is made up of 460 activity records carried out in 5 European countries (Spain, Italy, the Netherlands, Germany and the United Kingdom). In total, 9 different types of activities have been detected during the day (Swimming, Walking, Running, Pilates, Ski, Hiking, Tennis, Cycling, Danc- ing) in addition to the activity during sleep that is classified into three priority states (light, deep, awake). This is a super-aggregated data file from 5 other files obtained by aggregating the raw data directly from the device’s sensors.
Figure 1: Data structures raw and aggregated data.Figure 2: Data structure comparison Withings (up) vs. Apple (down).Table 1. Relevant dataset file structure (Withings 2018-2023).
Table available in the original PDF paper.
File name Type Size Activities.csv Double-aggregated data 144.5 KB Aggregates_calories_earned.csv Aggregated data 7.1KB Aggregates_calories_passive.csv Aggregated data 7.4KB Aggregates_distance.csv Aggregated data 7.5KB Aggregates_elevation.csv Aggregated data 5.4KB Aggregates_steps.csv Aggregated data 6.4KB Raw_tracker_altitude.csv Raw data 359B Raw_tracker_calories_earned.csv Raw data 1.9MB Raw_tracker_distance.csv Raw data 1.9MB Raw_tracker_elevation.csv Raw data 1.6MB Raw_tracker_steps.csv Raw data 1.7MB Raw_tracker_sleep-state.csv Raw data 69.9KB
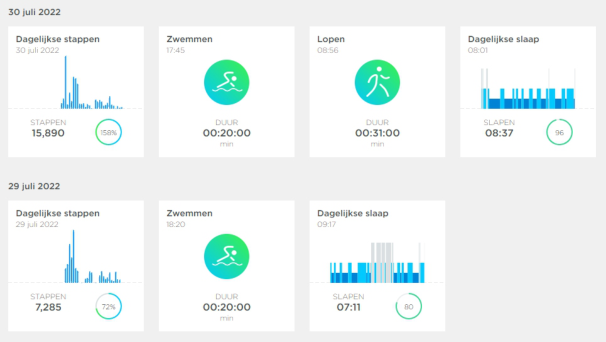
Withings manufacturer makes available to customers a very complete data display panel. Figure 3 shows a downloadable daily summary through the associated desktop application, which is very similar to the app. This manufacturer also allows downloading raw, semi-aggregated, and activity- aggregated data files. For this reason, we have carried out the study that we
Verification of the Integration Process of Algorithms and Sensor Data 461
present in this paper with the data of Withings manufacturer. The visualiza- tions and graphics displayed in the manufacturer’s apps are highly attractive to the end user as they are precisely designed to retain device buyers. In specific use cases such as personalized medicine, and specifically in the pre- vention of mood disorders, it is useful to propose graphics that alert both the user and the doctor in charge of the patients.
Figure 3: Data visualization Withings daily and sleep activities.
The structure of the data from Withings (Viñals Guitart, 2022) can be observed in Table 2.
Table 2. Structure of the raw-data from Withings.
Table available in the original PDF paper.
Variable Type Description Example [60] start Timestamp Start of recording 2018-11-01T18:25:00+01:00 duration Numeric vector Period(s) of recording. Usually 60 seconds
6.17
value Numeric vector Assigned value(s) to each period
Given this sample data for steps done. start,duration,value 2018-11-01T18:43:00+01:00,[60],[6] 2018-11-01T18:46:00+01:00,[60],[7] 2018-11-01T19:01:00+01:00,”[60,60,60]”,”[7,18,6]”
The first record indicates that the recording starts at 18:43 on 01/11/2018 for a period of 60 seconds in which the user recorded 6 steps.
Then, no steps were recorded until minute 18:46 in which the user recorded 7 steps.
Then, no steps were recorded until minute 19:01 in which the user was recording some steps for the next three periods of 60 seconds: 7, 18 and 6 respectively.
ANALYSIS The sensors produce data in real time that is stored in binary format on the device itself. From this source of information, the raw files are fed, which increase in size by monitoring the user’s activity. Therefore, we can consider that these files are the most reliable data collected by the sensors, since they have not been exposed to modifications or transformations. It would only be necessary to consider possible cases of malfunction of the device itself.
Based on the raw data, manufacturers use aggregation algorithms to anal- yse the variables they consider to be of interest. In (López, Montero & Rodríguez, 2010) the need to formally specify the data aggregation algo- rithms is explained, a necessary step for a correct verification of their use. These variables are usually in line with the loyalty interests that the manu- facturer wants for his product, so they are determined based on the general interest of potential buyers.
The manufacturer provides the raw data as well as the aggregated data. However, the algorithm used to aggregate the raw data to generate the aggre- gated data is not available. We want to ensure the reliability of the algorithm the manufacturer used. Having the aggregated data makes it easier to apply any other analysis over the data in any distinct scope, however, to prevent wrong outputs we need the data to be aggregated in the proper way.
In our research we are interested in a particular analysis, specifically the population sector of people with mood disorders. For this reason, the aggre- gation algorithms that manufacturers make available to customers in their apps may not be useful for other purposes. Our main goal is to compare the aggregation done by the manufacturer with the aggregation applied by us.
The manufacturer includes other sources of information in the aggregation process like the data recorded by the smartphone. We only use the raw data recorded by the smartwatch. For this reason, the volume of the aggregated data achieved by the manufacturer is bigger than ours.
In this section we compare the results of the data aggregated by the manufacturer with the data aggregated by our custom algorithm. Our aggre- gation has consisted of adding the data of each activity list detected by the accelerometer. These dynamic lists have different lengths because each item in the list is added when the accelerometer detects movement and counts the same until it detects stoppage. Each item in the list can correspond to different types of activity that are determined by data from other sensors such as gyroscope or gps position, speed, or type of movement. For example, the aggregates_step.csv file contains a total of 1053 observations (grouped by day) while raw_traker_steps.csv file contains a total of 63469 observa- tions (ungrouped). In the latter, each observation contains three variables: the timestamp of starting the activity of the sensor (date and time), the list of durations and the list of value registered every time the sensor is active. For instance, the observation 1454 contains the list of values [13,24,8,6,8] which corresponds with the timestamp “2021-08-21 18:34:00 UTC”.
Aggregation is also done by calendar days so that we can perform a day-paired comparison with manufacturer-aggregated data. The compara- tive analysis is simple and is based on the descriptive analysis of the data and the distribution of the variables through histograms. To verify these dif- ferences, we have compared the aggregated data by the manufacturer with
Verification of the Integration Process of Algorithms and Sensor Data 463
the aggregated data by our own algorithm using the same raw data input. For the comparative analysis, the variables of interest for the study of the emotional state have been chosen, as a specific purpose of this work. For the comparative analysis, the variables of interest for the study of the emotional state have been chosen, as a specific purpose of this work. However, this arti- cle only shows the results of three of them for illustrative purposes: calories, steps and distance.
The aggregation process was developed with RStudio and Python. We focused on data related to burned calories, distance travelled, and steps done because we are interested in the daily physical activity of a specific user. Our process identifies each date in which the user performed any of those activities and add each value recorded by the device.
RESULTS
Based on the hypothesis that raw data can offer information of interest in specific scenarios, such as mental health, we considered the option of using specific aggregation algorithms for each scenario, to avoid a loss of original information due to indiscriminate aggregations.
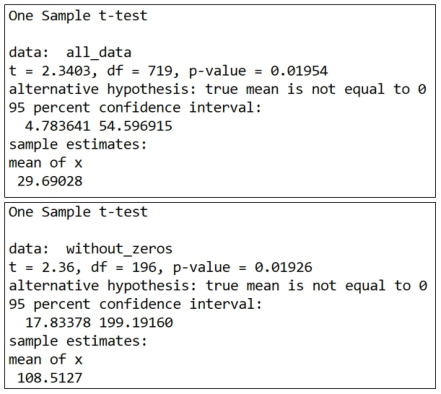
To evaluate the results obtained, the student’s t test has been applied to analyze the difference in results (manufacturer - own) and it has been car- ried out in two different ways: the first considering all the data (720 obs.) and the second eliminating the null data (null in both samples) (197 obs.). This second case makes sense because there are many pairs of zeros that have been obtained due to lack of use of the device, and therefore due to the absence of sensor data. Figure 4 shows the results on raw_track_steps.csv (after our own aggregation process) vs. aggregated_steps.csv (manufacturer aggregation). This figure shows that in both cases the p-value is quite large, and that the confidence interval (95%) does not contain zero in any case. Therefore, the student’s t test indicates that there are significant differences between the results provided by the manufacturer and those obtained directly from the raw data through our particular aggregation. However, a correla- tion of 0.9986801 has been obtained and the descriptive statistics of both samples are very similar. This result is an indicator of errors in data col- lection, either due to a malfunction of the sensors, or due to a specific erroneous operation. In any case, our procedure has made it possible to obtain useful aggregated data and to verify the procedure of the manu- facturer’s results even without knowing the algorithm they have used to aggregate their data.
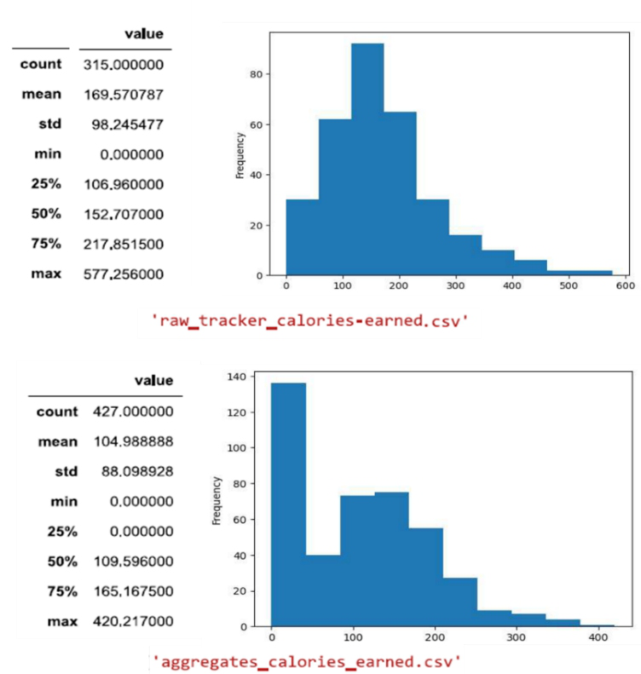
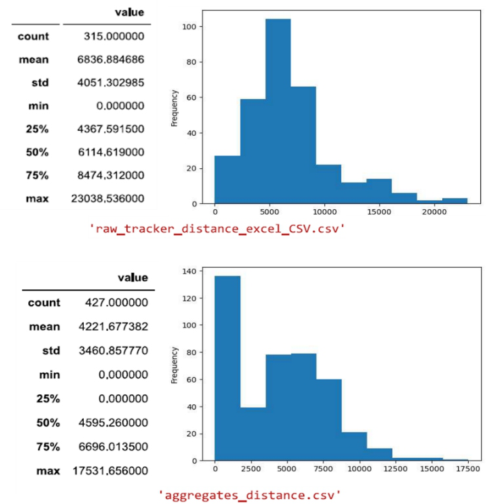
Additionally, we have studied two more variables in different periods in time as a subset of data. Applying the same previous technique, we have verified that the manufacturer’s data does not match and is even distributed in a very different way. The results are shown in figures 5 and 6. Figure 5 shows the comparison of calories consumed, on the one hand the results of our algorithm fed with the raw data of the device (upper) and on the other hand the results of the manufacturer’s algorithm (lower). Figure 6 shows the same as Figure 5 but with respect to the dis- tance travelled variable. As can be seen in both cases, the differences are very substantial.
Figure 4: Comparative analysis t-test aggregated data from manufacturer vs our aggregated data – all data (upper), data without nulls (lower).Figure 5: Summarize and histogram calories earned comparison: raw data (upper) vs. by the factory aggregated data (lower).
Verification of the Integration Process of Algorithms and Sensor Data 465
Figure 6: Summarize and histogram distance comparison: raw data (upper) vs. by the factory aggregated data (lower).
We can conclude that the manufacturer uses other sources of information to enrich the knowledge of the users, such as the sensors of other devices asso- ciated with the user’s smartphone. The use of other sources of information adds noise to the verification process.
CONCLUSION
This research raises the need to verify the sensor data aggregation pro- cesses for their correct use in various applications of interest. Specifically, the use of information in personalized medicine applications in the detec- tion and treatment of mood disorders is considered. Most manufacturers of smartwatch-type sensor devices develop mobile applications where they present their customers with the results of the activity through very visual and modern graphics that facilitate customer loyalty and their competitiveness in the market.
The raw data collected by the sensors is stored and analyzed using general- purpose aggregation algorithms that are integrated with data from nearby information sources, such as environmental data or from the mobile phone itself where the customer information application resides.
Integration with third-party applications can provide a richer, more per- sonalized view of collected data, but can also introduce noise, errors, and precision limitations. In general, manufacturers of activity sensors are con- stantly improving the accuracy and reliability of their products, but it is important to understand that specific applications (such as the study of mood disorders) require aggregation algorithms that can verify the integrity of the data from the activity sensors.
In this article, data aggregated by a manufacturer is analyzed and com- pared to data aggregated specifically for the study of mood disorders. The aggregated data paired by calendar days show significant differences both in terms of descriptive statistics and the statistical distribution of the variables. The article specifically shows the results for the variables distance and calories consumed during the activity. These differences prove the need to use specific aggregation algorithms and to verify the algorithms used by manufacturers to verify the results from the clinical point of view.
ACKNOWLEDGMENT
The authors would like to acknowledge the Spanish project ref-PID2020- 113192GB-I00.
REFERENCES
Cortés, R., Bonnaire, X., Marin, O., & Sens, P. (2015). Stream processing of healthcare sensor data: studying user traces to identify challenges from a big data perspective. Procedia Computer Science, 1004–1009. ˇCuki´c, M., López, V., & Pavón, J. (2020). Classification of depression through
resting-state electroencephalogram as a novel practice in psychiatry. Journal of medical Internet research. DATTA, Shoumen Palit Austin, et al. Data, Analytics and Interoperability between Systems (IoT) is Incongruous with the Economics of Technology. Big Data Ana- lytics for Internet of the Things, DOI: 10.1002/9781119740780, John Wiley & Sons, Inc., 2021 Díez Pérez-Villacastín, C. (2022). Algoritmos de parsing para el análisis de datos de
actividad física y del sueño. Trabajo de Fin de Máster. Máster Universitario en Ciencia de Datos, CUNEF Universidad. Doncel Pedrosa, A. (2022). Análisis exploratorio de la correlación y causalidad de la actividad física en el sueño. Trabajo de Fin de Máster. Master Universitario en Ciencia de Datos, CUNEF Universidad. Inkster, B., & (DMHDIG), D. M. (2021). Early warning signs of a mental health
tsunami: a coordinated response to gather initial data insights from multiple digital services providers. Frontiers in digital health, 2, 578902. Llamocca, P., López, V., & ˇCuki´c, M. (2022). The proposition for bipolar depression forecasting based on wearable data collection. Frontiers in Physiology, 2333. Llamocca, P., López, V., Santos, M., & ˇCuki´c, M. (2021). Personalized charac-
terization of emotional states in patients with bipolar disorder. Mathematics, MDPI, 1174. López, V., & ˇCuki´c, M. (2021). A dynamical model of SARS-CoV-2 based on people flow networks. Safety Science, 134, 105034. Lopez, V., Montero, J., & Rodríguez, J. T. (2010). Formal Specification and
implementation of computational aggregation Functions. In Computational Intel- ligence: Foundations and Applications (pp. 523–528). Tyler, J., Choi, S. W., & Tewari, M. (2020). Real-time, personalized medicine through wearable sensors and dynamic predictive modeling: a new paradigm for clinical medicine. Current opinion in systems biology, 17–25. Viñals Guitart, C. (2022). Comparativa e integración de estructuras de datos crudos
de sensores inteligentes. Aplicación a la actividad física. Trabajo de Fin de Máster. Máster Universitario en Ciencia de Datos, CUNEF Universidad.
LISTED IN THE AHFE DIGITAL BOOKSTORE CATALOGUE
Explore the complete digital volume
Human Systems Engineering and Design (IHSED 2023): Future Trends and Applications
Read this individual research paper free through the original publisher, or explore the full digital proceedings book.
ISBN 978-1-958651-88-9
Explore this ISBN in the AHFE Bookstore ↗Listed in the July 2026 bookstore catalogue; search by ISBN to confirm current availability · Digital book purchase optional