Yi Lin Wong (2023). Predicting comprehensibility of healthcare signs using drawings from participants: A pilot study of sign evaluation. In: Human Systems Engineering and Design (IHSED 2023): Future Trends and Applications. AHFE Open Access, vol. 112, pp. 56–62. https://doi.org/10.54941/ahfe1004113
This paper advocates using visual data to evaluate signs, specifically by examining the similarities between signs and drawings produced by end-users based on a sign referent given to them. A similarity score is used to measure the extent to which a sign conforms to users' mental images triggered by the associated referent and to determine whether the sign should be redesigned. Based on the concept underlying the population stereotype production technique, it is argued that a higher similarity score implies higher comprehensibility of the sign. When redesigning is needed, the drawings can also serve as informative feedback for sign modification. This explorative approach is illustrated by a pilot study involving the evaluation of healthcare signs using visual data.
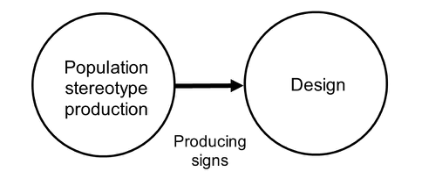
The population stereotype production technique is a method used by sign designers to gather information to produce signs (Ziefle et al., 2008). This is a technique widely used by researchers and designers to generate new signs (e.g., Blackler et al., 2014; Chua et al., 2015; Mieczakowski et al., 2013). To use this technique, participants are recruited and instructed to draw pic- tograms based on sign referents, i.e., the wording that describes what the signs are meant to convey. The elements of the participants’ pictograms are then consolidated, and new signs are produced (Figure 1). This method is believed to produce signs with higher comprehensibility, because compre- hensible signs should contain elements that match the population’s mental images of the signs’ referents (Ng et al., 2012). The outcomes of this method are more objective, meaning that the signs are better comprehended, than signs resulting from other techniques.
However, sign designers do not use this method in the design process. Rather, they design based on their own perceptions and mental images. In some cases, this has resulted in signs that are difficult to comprehend without the help of the signs’ referents, i.e., the descriptive words. Such signs should
Predicting Comprehensibility of Healthcare Signs Using Drawings From Participants 57
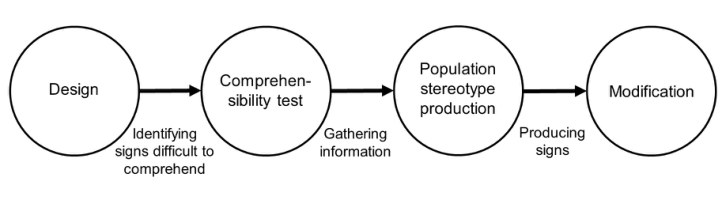
be modified using the population stereotype production technique. Figure 2 illustrates this modification process.
Figure 1: Population stereotype production technique.Figure 2: Modification process of signs.
Many signs are observed in daily life. To identify which signs have lower comprehensibility and need modification, a comprehensibility test is needed. Participants in this test are asked to indicate to what extent the signs are comprehensible and the meaning of the signs. Comprehensibility tests are one effective way to evaluate signs (Li & Wan, 2022; Liu & Hoelscher, 2001; Macdonald & Hoffmann, 1991). The population stereotype production tech- nique would be useful for gathering information needed to modify signs that are identified by comprehensibility tests as needing modification. However, from a methodological perspective, the participants involved in the popula- tion stereotype production should not take part in the comprehensibility test, as seeing the signs would possibly affect their mental images. The procedure must be carefully designed to avoid such bias.
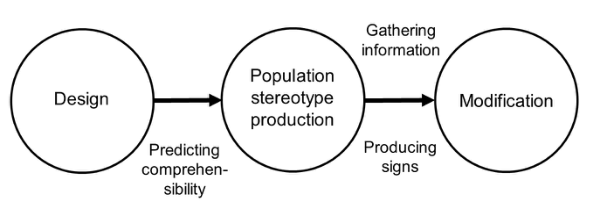
This paper advocates an alternative approach to simplify the modification process (Figure 3). Instead of using the traditional comprehensibility test to evaluate signs, the pictograms collected using the population stereotype pro- duction technique are used. The contents of the pictograms are compared with the original sign to be tested. If the contents of the pictograms are very similar to the target sign, it can be argued that the target sign matches the participant’s mental image and, therefore, that the comprehensibility of the target sign is high. Conversely, if the contents of the pictograms are very dif- ferent from the target sign, it can be argued that the target sign does not match the participant’s mental image and that its comprehensibility is low. In this case, the pictograms can be used again to gather information to inform the sign’s modification.
58 Wong
Figure 3: Alternative approach to sign evaluation and modification.
This paper presents a pilot study of the alternative method to test its feasibility and effectiveness.
PILOT TEST Method Participants. Fifty-four university students majoring in engineering and design were involved in this pilot test (ne = 13, nd = 41). All of them are Year Two students. Only the design students had been trained in hand- drawing icons and products, and all of them had two- and three-dimensional Computer Aid Drawing (CAD) training. Instruments. A seven-page, A4-sized booklet was given to each participant to draw pictograms representing six sign referents. The participants were instructed to draw a pictogram in a 7cm x 7cm space according to the referent given on each page. They were asked to use a pencil or ballpoint pen to draw the pictograms. Under each pictogram space were two questions, with responses on a 7-point Likert scale. The two questions were (1) ‘How often do you see the sign of this referent?’ and (2) ‘How easily can you recall where the sign of this referent appears?’ Instructions and an example referent of ‘No sitting’ was provided on the first page of the booklet. The six referents were of healthcare–related signs used during the COVID-19 pandemic. They were as follows:
1. Wash your hands. 2. No shaking hands or hugging. 3. Keep a safe distance of at least 1.5 m. 4. Wear a mask. 5. Check your temperature. 6. Use sanitizer before entering.
Procedures. The participants were asked to finish the questionnaires in 30 minutes following a normal university class. Writing instruments were not provided; the participants had to use their own. The instructions were explained in the beginning of the drawing session, and the participants could ask questions at any time during the session. They were not allowed to exchange ideas or hold discussions when drawing.
A designer was assigned to compare the collected pictograms with six signs extracted from the ISO 7010 Graphical Symbols – Safety Colours and Safety
Predicting Comprehensibility of Healthcare Signs Using Drawings From Participants 59
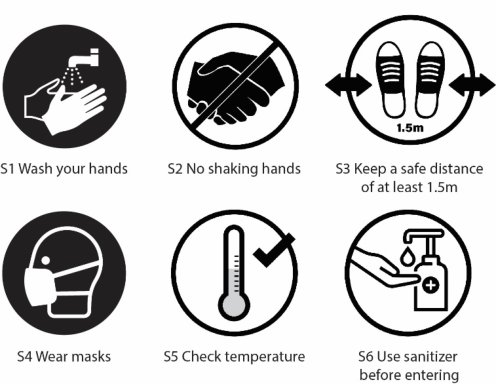
Signs – Registered Safety Signs (S1 Wash your hands and S4 Wear a mask), daily life scenarios (S3 Keep a safe distance of at least 1.5 m and S5 Check your temperature), and the Internet (S2 No shaking hands or hugging and S6 Use sanitizer before entering). The signs are shown in Figure 4. Similarity scores were given to each pictogram (3 = same, 2 = similar, 1 = partially similar, and 0 = different).
Figure 4: Signs with which the pictograms were compared.
Notes: S3 and S5 are based on signs found in a shop in Hong Kong, and S2 and S6 are based on signs found on the Internet.
RESULTS
In total, 323 pictograms were collected. One of the design students left one of the drawing spaces blank. Examples of the pictograms are shown in Figure 5.
Figure 5: Pictograms drawn by the participants.
Notes: The numbers under the drawings are the codes of the participants; E represents engineering student, and D represents design student.
All of the pictograms were compared with the signs shown in Figure 3, and mean similarity scores were calculated. The data are shown in Table 1. A Kruskal–Wallis test was conducted to compare the differences between the mean scores, and the results show significant differences (H(5) = 133.44, p = 0.000).
The results show that the pictograms representing R1 Wash your hands have the highest mean similarity score (mean = 2.26, SD = 0.48). This indi- cates that S1 in Figure 1 is comparable to the pictograms of R1 and that the effectiveness of S1 is high. The lowest similarity mean score is that of R5 Check your temperature (mean = 0.39, SD = 0.71). This indicates that S5 in Figure 1 does not match the participants’ mental image of the associated referent. Although there is insufficient evidence to prove that the comprehen- sibility of S5 is low, the effectiveness of the sign is relatively low. Based on a mean similarity score of 1 (partially similar) as a threshold, S3 is identified as another sign with low effectiveness. Therefore, both S3 and S5 should be redesigned. The stepwise, step-down, post-hoc test in SPSS also shows that S3 and S5 have lower mean ranks (see Table 2).
Table 2. Results of the stepwise, step-down, post-hoc test.
Table available in the original PDF paper.
Subset Sign 1 2 3 4
5 70.03 3 109.01 2 161.23 161.23 4 189.270 6 206.08 206.08 1 239.38 Test statistic - 2.81 5.04 3.84 p-value - 0.26 0.15 0.14 Note: Each cell shows the sample average rank of the relevant sign.
The redesign process of the new signs using the pictograms was not included in this paper, as the method used to redesign signs, i.e., the popula- tion stereotype production technique, has been widely adopted (Ziefle et al., 2008).
DISCUSSION
The results show that using the statistical method, it is possible to identify signs with low similarity scores. These signs may not be comparable with the participants’ mental images evoked by the signs’ referents. Therefore, it is predicted that the comprehensibility of these signs is lower than that of other
Predicting Comprehensibility of Healthcare Signs Using Drawings From Participants 61
signs. However, as the comprehensibility test was not conducted in this study, the paper is unable to verify whether this prediction is correct.
This pilot study and alternative method have certain limitations. First, in the pilot study, only one rater was assigned to compare the drawings with the target signs. More raters are needed to ensure reliability. Inter-rater reliabil- ity should be tested using the kappa statistic (McHugh, 2012). Second, the alternative method does not provide concrete data on comprehensibility. It only predicts comprehensibility theoretically, and the relationship between the similarity and comprehensibility scores should be tested by collecting more empirical data. The prediction is merely enough to judge whether the sign should be modified compared with other signs. An absolute comprehen- sibility value is not obtained. Third, it is questionable whether the effort of sign modification is reduced by this method, as comparing drawings with the target signs is not a trivial task. A method to ensure that effort is saved is to use a computer program to complete the comparison task. Artificial intelligence may be introduced to address this issue.
CONCLUSION
This paper offers a practical illustration of how the alternative method may be used to predict the comprehensibility of signs and determine whether the signs need modification. The alternative method also simplifies the conventional process of testing comprehensibility by combining the processes of compre- hensibility prediction and population stereotype production. However, the accuracy of the comprehensibility prediction is not yet validated, and more empirical experiments are required to quantify the relationship.
ACKNOWLEDGEMENT
The authors would like to acknowledge the funding and administrative sup- port provided by The Hong Kong Polytechnic University. The author would also like to acknowledge Sandy Cheng for helping with data collection.
REFERENCES
Blackler, A., Popovic, V., Mahar, D. (2014) ‘Applying and testing design for intuitive interaction’, International Journal of Design Sciences and Technology, 20(1), pp. 7–26. Chua, W. Y., Chang, K. T.-T., Wan, M. P.-H. (2015) ‘Population stereotyped icons: A
study of agrarian communities in India’, Pacific Asia Conference on Information Systems PACIS 2015 Proceedings, pp. 104. https://aisel.aisnet.org/pacis2015/104 Li, R., Wan, Y. (2022) ‘Evaluation on the comprehensibility of China’s safety prohibition signs based on ergonomic principles’, in T. Ahram, R. Taiar, R. (eds.), Human Interaction, Emerging Technologies and Future Systems V. Cham: Springer, pp. 1250–1257. https://doi.org/10.1007/978-3-030-85540-6_160 Liu, L., Hoelscher, U. (2001) ‘Evaluation of graphic symbols’, in W. Karwowski
(ed.), International Encyclopedia of Ergonomics and Human Factors (2nd ed.). Boca Raton, FL: Taylor & Francis, pp. 1053–1057. Macdonald, W. A., Hoffmann, E. R. (1991) ‘Drivers’ awareness of traffic sign information’, Ergonomics, 34(5), pp. 585–612.
62 Wong
McHugh, M. L. (2012) ‘Interrater reliability: The kappa statistic’, Biochem Med (Zagreb), 22(3), pp. 276–282. Mieczakowski, A., Langdon, P., Clarkson, P. J. (2013) ‘Investigating designers’ and
users’ cognitive representations of products to assist inclusive interaction design’, Universal Access in the Information Society, 12, pp. 279–296. Ng, A. W. Y., Siu, K. W. M., Chan, C. C. H. (2012) ‘The effects of user factors and symbol referents on public symbol design using the stereotype production method’, Applied Ergonomics, 45, pp. 230–238. Ziefle, M., Pappachan, P., Jakobs, E. M., Wallentowitz, H. (2008) ‘Visual and
auditory interfaces of advanced driver assistant systems for older drivers’, in K. Miesenberger, et al. (eds.) Computers helping people with special needs. Heidelberg: Springer, pp. 62–69.
LISTED IN THE AHFE DIGITAL BOOKSTORE CATALOGUE
Explore the complete digital volume
Human Systems Engineering and Design (IHSED 2023): Future Trends and Applications
Read this individual research paper free through the original publisher, or explore the full digital proceedings book.
ISBN 978-1-958651-88-9
Explore this ISBN in the AHFE Bookstore ↗Listed in the July 2026 bookstore catalogue; search by ISBN to confirm current availability · Digital book purchase optional