Mingjun Liu, Liu Tang, Jia Zhou (2023). The Efficiency and User Experience of AR Walking Navigation Tools for Older Adults. In: Augmented, Virtual and Mixed Reality Simulation. AHFE Open Access, vol. 118, pp. 19–29. https://doi.org/10.54941/ahfe1004437
Navigating in unfamiliar environments is a common problem for people, and the use of navigation tools on smartphones can improve navigation efficiency and help people navigate better. Many navigation systems today incorporate augmented reality (AR) and mixed reality (MR) technologies to assist navigation. However, older adults still face difficulties in using these emerging technologies. In particular, in complex environments, they are prone to taking wrong actions that result in deviation from the intended path. Previous studies have found that older adults have trouble matching virtual indicators with real environments when using AR-based walking navigation tools, especially when faced with multiple similar intersections. Different types of AR-based walking navigation systems use different virtual prompts, and their effectiveness may vary depending on the environment. To further explore the impact of different AR-based walking navigation systems and environmental complexity on older adults' navigation, this study recruited 36 older adults to participate in an experiment. They used three different AR-based walking navigation systems (landmark-based, route-based, and map-based) in two different levels of environmental complexity (simple and complex) to navigate to a designated destination in a virtual environment. First, the study found that participants made fewer navigation errors in the simple environment than in the complex environment. However, the cognitive load was higher in the simple environment. Further analysis showed that environmental complexity mainly affects cognitive load by influencing the degree of frustration and effort that people put into the task. The simpler the environment, the more effort participants felt they needed to exert to complete the task, and the more frustrated they became after making mistakes. And it was found that the number of intersections was higher in the simple environment, which may be a contributing factor to the higher cognitive load. Secondly, the study found that navigation performance (task completion time and the number of errors) and subjective feedback (system usability and cognitive load) were best for the route-based AR walking navigation system among the three systems, followed by the landmark-based AR walking navigation system, and the map-based AR walking navigation system was the least effective. This is because older adults' spatial abilities mainly focus on landmark knowledge and route knowledge, not configurational knowledge. Post-experiment interviews revealed that the route-based AR walking navigation system was found to be more similar to real-life navigation landmarks, making it easier to use. However, the landmark-based AR walking navigation system requires participants to pay attention to the corresponding landmarks, and their relationships with arrow indicators and accompanying text to confirm whether they have made the correct decision. This may lead to navigation errors when participants rely on a single source of information. Finally, the study found that participants with higher spatial memory completed the task in less time and made fewer navigation errors. The results of this study indicate that the greater the difference between AR navigation assistance information and real spatial information, the worse the navigation performance and experience of older users in different environments with different levels of complexity. This study provides a reference for improving the age-adaptability of navigation assistance tools and optimizing information prompting methods in complex environments.
Navigating in unfamiliar environments is a common problem for people, and the use of navigation tools on smartphones can improve navigation effi- ciency and help people navigate better. Mobile navigation systems mainly include map-based, voice-based, touch-based, text-based, photo-based, and combinations of these basic types (Rehrl et al., 2012). However, these sys- tems have certain limitations. Map-based navigation systems require users to constantly focus on the screen, causing them to ignore their surround- ings (Giannopoulos et al., 2015; Rümelin et al., 2011). The use of electronic map navigation systems is also affected by the size of the device screen, and users may face difficulties in matching the map with the real environment. Voice-based navigation systems are an alternative to map-based systems, but
they are not suitable for noisy environments (Montuwy et al., 2018). Con- verting verbal navigation instructions into spatial navigation knowledge also increases users’ cognitive load.
Augmented reality technology is used in pedestrian navigation because it allows users to combine and align virtual objects with real-world objects and enables real-time interaction (Azuma et al., 2001). AR pedestrian navigation prevents users from constantly staring at their phone screens and ignoring their surroundings, reducing the cognitive load and navigation errors caused by switching between the real environment and the screen (Kim & Dey, 2009; Peleg-Adler et al., 2018). In addition, compared to paper maps, participants using head-mounted AR navigation tools and handheld AR navigation tools had shorter navigation times and lower cognitive load, but their memory of the route was poorer (Rehman & Cao, 2016). However, a study comparing AR pedestrian navigation tools with voice and digital map navigation tools found that users spent more time and made more stops on the road when using AR navigation tools, indicating that users need to exert more effort to understand the meaning of the navigation instructions (Rehrl et al., 2012). Furthermore, older adults still face challenges when using AR pedestrian nav- igation tools, such as difficulty matching virtual instructions in the AR tool with the real environment, especially at intersections with multiple options in the same direction (Tang & Zhou, 2020). Different types of AR pedestrian navigation tools use different virtual cues, and the effectiveness of assistance may vary in different environments. It is currently unclear how older adults experience navigation when using different types of AR pedestrian naviga- tion tools in different environments. Therefore, this study aims to explore the impact of different types of AR pedestrian navigation tools and the complex- ity of environmental conditions on the navigation experience of older adults. The results of this study provide insights for improving the age-friendliness of navigation assistance tools and optimizing information presentation methods in complex environments.
MATERIALS AND METHODS
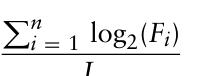
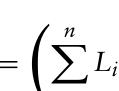
Variables In this study, we conducted a mixed-factor experiment. The independent variables were the type of AR pedestrian navigation system (within-group variable) and the environmental complexity (between-group variable), the experiment sequence of the participants was balanced. The type of AR pedes- trian navigation system had three levels: landmark-based AR pedestrian navigation system, route-based AR pedestrian navigation system, and map- based AR pedestrian navigation system. The environmental complexity had two levels: simple and complex, calculated using the following formula:
Pn
Equation reproduced from the original PDF.
where n represents the number of decision points in the entire route, Fi represents the number of branching roads at the i-th decision point, and
The Efficiency and User Experience of AR Walking Navigation Tools 21
L represents the length of the road. The larger the calculated value, the more complex the environment.
The dependent variables are navigation performance and subjective feed- back of the participants. Performance is measured by the number of naviga- tion errors and task completion time, while subjective feedback is measured by system usability and cognitive load.
The covariates include the gender, age, education level, spatial ability, spatial memory, experience with technology products, experience with AR- related products, experience with navigation products, and experience with joystick usage of the participants.
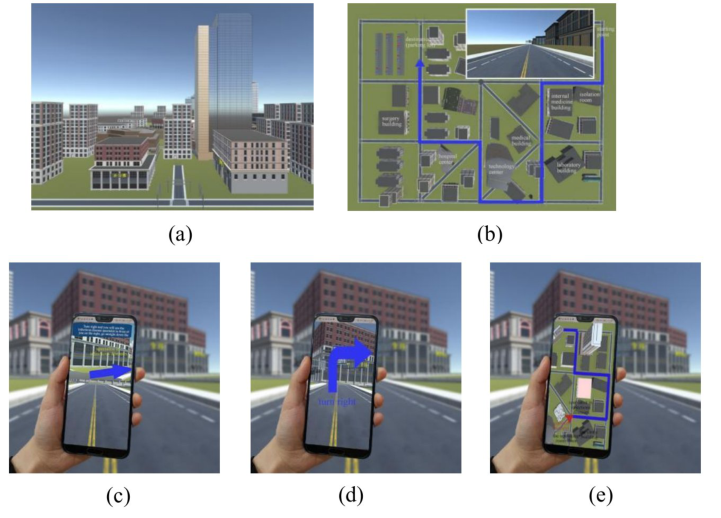
Experimental Prototype and Tasks In this study, five prototypes were designed (i.e., two levels of environmental complexity + three levels of AR pedestrian navigation system), as presented in Fig. 1. The virtual environment runs on Windows 10 system and the AR walking navigation system runs on Android 9.0 system.
Figure 1: (a) virtual environment (b) top view and front view of the virtual environment (c) landmark-based AR pedestrian navigation system (d) route-based AR pedestrian navigation system (e) map-based AR pedestrian navigation system.
The task for the participants is to use three different AR pedestrian navi- gation systems to navigate from the starting point to the specified destination based on the prompts provided by the AR pedestrian navigation systems. The timing for each task starts when the participant manipulates the joystick and ends when the participant reaches and sees the destination. If the participant
deviates from the specified route during the task, the experimenter will pro- vide a prompt and record the number of times the participant deviates from the route.
Procedure The experiment required approximately 90 min. Firstly, participants need to complete a joystick test task, where they use the joystick to navigate from the starting point to the endpoint in a road, and the experimenter will record the time taken to complete the task. Participants who can use the joystick properly will then need to complete a background information questionnaire and undergo tests on their spatial memory and spatial abilities. They will then receive training on operating the experimental system until they can indepen- dently complete the experimental task. In the formal experiment, participants will be divided into two groups and will need to navigate in a simple or com- plex environment using a specific type of AR pedestrian navigation system on three predefined roads. They will then complete a “Usability Test” and the “NASA Task Load Index”.
RESULTS
Background Information The demographic information of the participants is shown in Table 1. The spatial ability of the participants ranged from 1 to 11 (M = 5.86, SD = 2.32). The spatial memory of the participants was in the range from 3 to 5 (M = 4.33, SD = 0.59).
Table 1. Demographic information.
Table available in the original PDF paper.
Variable Category Num % Gender Female 25 69.4% Male 11 30.6% Education Primary 7 19.4% Middle school 17 47.2% High school 10 27.8% College degree or above 2 5.6% Experience using Technology product With 35 97.2% Without 1 2.8% Experience using joystick With 1 2.8% Without 35 97.2% Experience using AR-related product With 1 2.8% Without 35 97.2% Experience using Navigation product With 9 25% Without 27 75%
Performance Covariance analysis (ANCONA) was used to analyze the effects of the inde- pendent variables (environmental complexity and the type of AR pedestrian
The Efficiency and User Experience of AR Walking Navigation Tools 23
navigation system) on navigation performance and subject subjective feed- back. The gender, age, educational level, spatial ability, spatial memory, experience of using a joystick, and experience of using navigation products of participants were included in the analysis model.
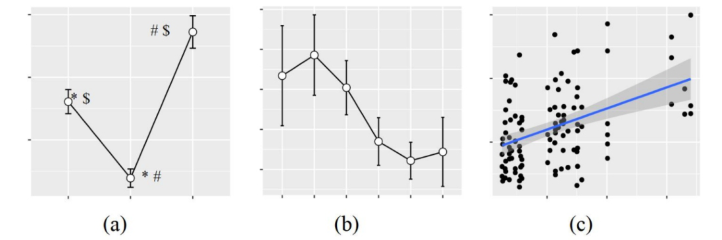
Task Completion Time: During the experiment, one participant failed to complete the task, and the abnormal data was not included in the data anal- ysis. The results of the covariance analysis showed a significant effect of the type of AR pedestrian navigation system on task completion time (F(2, 94) = 50.56, p<0.001, partial η2=0.518, Fig. 2(a)). Post hoc tests using Turkey’s HSD revealed that compared to the landmark-based AR pedestrian navigation system, using the route-based AR pedestrian navigation system reduces task completion time by 19.82% (diff = 0.49, p<0.001), and using the map-based AR pedestrian navigation system increases task completion time by 21.17% (diff=−0.45, p<0.001). Additionally, compared to using the route-based AR pedestrian navigation system, using the map-based AR pedestrian navigation system increased task completion time by 51.12% (diff=−0.93, p<0.001). In addition, participants with higher spatial mem- ory had shorter task completion times (F(1, 94) = 20.17, p<0.001, partial η2=0.184, Fig.2(b)), and participants with stronger joystick manipulation skills spent less time finding the destination (F(1, 94) = 37.74, p<0.001, partial η2=0.286, Fig. 2(c)).
Figure 2: (a) The effect of AR-based pedestrian navigation system on task completion time (b) The effect of spatial memory on task completion time (c) The effect of the ability to use the joystick on task completion time.
The Number of Navigation Errors: The results of the covariance analysis showed that the type of AR pedestrian navigation system had a significant effect on the number of navigation errors (F(2, 95) = 36.40, p < 0.001, par- tial η2=0.434, Fig. 3(a)). Post hoc tests using Turkey’s HSD revealed that compared to the landmark-based AR pedestrian navigation system, using the route-based AR pedestrian navigation system reduced the number of navigation errors by 76.34% (diff = 1, p < 0.001), and using the map- based AR pedestrian navigation system increased the number of navigation errors by 87.94% (diff = −1.15, p < 0.001). Additionally, compared to using the route-based AR pedestrian navigation system, using the map-based AR pedestrian navigation system increased the number of navigation errors
by 694.2% (diff = −2.15, p < 0.001). Compared to the simple environ- ment, participants made 58.66% more navigation errors in the complex environment (F(1, 95) = 8.90, p<0.01, partial η2=0.086, Fig. 3(b)). Fur- thermore, participants with lower spatial memory made more navigation errors(F(2, 95) = 4.30, p<0.05, partial η2=0.043, Fig. 3(c)).
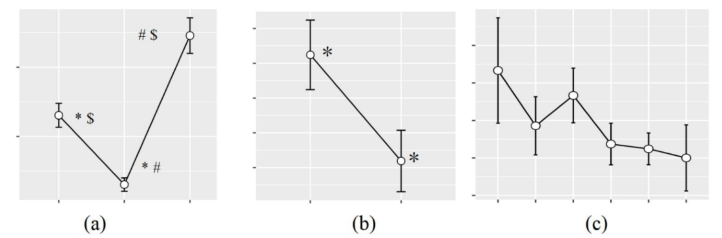
Subjective Feedback System Usability: The results of the covariance analysis showed that the type of AR pedestrian navigation system had a significant impact on par- ticipants’ evaluation of system usability (F(2, 97) = 28.70, p < 0.001, partial η2 = 0.372, Fig. 4(a)). Post hoc tests using Turkey’s HSD revealed that com- pared to the landmark-based AR pedestrian navigation system, participants’ evaluation of the route-based AR pedestrian navigation system increased by 14.25% (diff= −3.92, p < 0.001), and their evaluation of the map-based AR pedestrian navigation system decreased by 15.43% (diff = 4.24, p < 0.001). Additionally, compared to using the route-based AR pedestrian navigation system, participants’ evaluation of the map-based AR pedestrian navigation system decreased by 25.97% (diff= 8.16, p < 0.001).
Figure 3: (a) The effect of AR-based pedestrian navigation system on the number of navigation errors (b) The effect of environmental complexity on the number of navigation errors (c) The effect of spatial memory on the number of navigation errors.
The results of the analysis of variance showed that a longer task completion time was associated with lower system usability scores for the participants (F(1,105)=26.94, p<0.01, R2=0.204). Additionally, a higher number of navigation errors was associated with lower system usability scores for the participants (F(1,105)=69.89, p<0.01, R2=0.400).
Cognitive Load: The results of the covariance analysis showed that the type of AR pedestrian navigation system had a significant effect on participants’ cognitive load (F(2, 96) = 16.61, p<0.001, partial η2=0.257, Fig. 4(b)). Post hoc tests using Turkey’s HSD revealed that compared to the landmark- based AR pedestrian navigation system, using the route-based AR pedestrian navigation system reduced participants’ cognitive load by 30.71% (diff = 5.81, p < 0.01), and using the map-based AR pedestrian navigation system increased participants’ cognitive load by 25.53% (diff = 4.83, p < 0.05). Furthermore, compared to the route-based AR pedestrian navigation system,
The Efficiency and User Experience of AR Walking Navigation Tools 25
using the map-based AR pedestrian navigation system increased partici- pants’ cognitive load by 81.16% (diff =−10.64, p < 0.001). Additionally, participants with stronger joystick skills had a lower cognitive load in the experiment (F(1, 99) = 4.61, p < 0.05, partial η2=0.045).
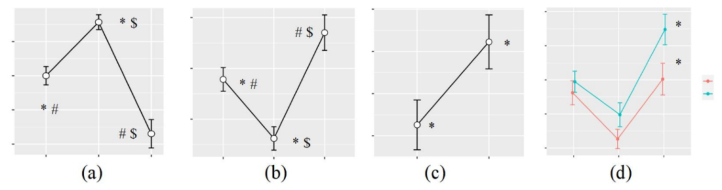
Interestingly, participants had a 20.8% higher cognitive load in the sim- ple environment compared to the complex environment (F(1, 96) = 7.05, p<0.01, partial η2=0.068, Fig. 4(c)). Further analysis revealed that partici- pants had a higher cognitive load in the simple environment compared to the complex environment when using the map-based AR pedestrian naviga- tion (diff = 7.28, p<0.01, Fig. 4(d)). Analyze the reasons for the result based on the differences in personal characteristics between groups, cognitive load scales, and experimental environment.
Figure 4: (a) The effect of AR-based pedestrian navigation system on system usabil- ity (b) The effect of AR-based pedestrian navigation system on cognitive load (c) The effect of environmental complexity on cognitive load (d) The effect of environmental complexity and AR-based pedestrian navigation system on cognitive load.
The analysis of variance results indicates that there are no differences among participants in terms of age, joystick ability, spatial ability, and spatial memory. Similarly, the logistic regression analysis results show that there are no differences among participants in terms of gender, education level, and experience in using navigation tools. The results are shown in Table 2 and Table 3.
Table 2. Individual differences between groups (1).
The analysis examined the effects of environmental complexity on the scores of cognitive load dimensions, including mental effort, physical effort, time demand, effort level, task completion satisfaction, and frustration level, as measured by the Cognitive Load Scale. The results of the analysis showed that as environmental complexity became simpler, participants reported
higher levels of frustration (F(1, 100) = 5.12, p < 0.05, partial η2=0.049) and higher levels of effort (F(1, 99) = 6.03, p < 0.05, partial η2 = 0.057). This suggests that participants perceived a need to exert greater effort to complete the task.
Table 3. Individual differences between groups (2).
Table available in the original PDF paper.
Variable Df Pearson χ2 p Gender 2 0.131 0.717 Education 3 4.756 0.191 Experience using Navigation product 1 1.029 0.310
In terms of the experimental environment, an analysis is conducted on the impact of the number of intersections and the salience of landmarks along the route on the cognitive load of the participants. The formula for calculating the salience of landmarks along the route is as follows:
!
Equation reproduced from the original PDF.
where S represents the salience of landmarks along the route; n represents the number of intersections from the starting point to the destination; Li repre- sents the visual salience of the i-th decision point landmark. If the landmark is located within the 120
field of view in front of the participant’s line of sight and is not obstructed, Li is equal to 1; otherwise, it is 0. The results of the analysis of variance showed that the fewer the number of intersections on the route, the lower the cognitive load of the participants (F(1,106) = 4.05, p<0.05, partial η2=0.0368). However, the salience of landmarks did not have a significant impact on the cognitive load of the participants.
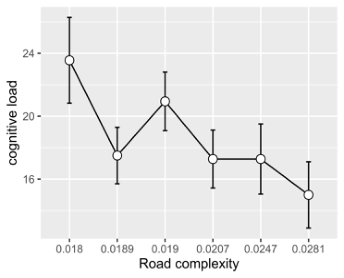
Furthermore, when analyzing the relationship between road complexity as a continuous variable and cognitive load, the analysis of variance showed that as road complexity increased, the cognitive load of the participants also increased (F(1, 106) = 6.23, p<0.05, partial η2=0.056, Fig. 5).
Figure 5: Effect of road complexity on cognitive load.
The Efficiency and User Experience of AR Walking Navigation Tools 27
Based on the analysis results, it is speculated that the cognitive load of the participants is higher in the simple environments compared to the com- plex environments. This may be due to the higher number of intersections in simple environments compared to complex environments. The higher the number of intersections, the more decisions the participants need to make, leading to an increase in cognitive load.
Finally, a linear regression analysis was conducted to analyze the relation- ship between performance and cognitive load. The results showed that the longer the task completion time, the higher the cognitive load of the partici- pants (F(1,105)=20.30, p<0.01, R2=0.162); and the more navigation errors made, the higher the cognitive load (F(1,105)=29.71, p<0.01, R2=0.221).
Road Direction Matching: During the experiment, it was found that some participants had difficulty matching their own direction of movement in the virtual environment with the direction of the road. Through the analysis of videos of participants performing joystick tasks, it was found that 14 partic- ipants (38.9%) were unable to align their direction with the direction of the road during the experiment. Logistic regression analysis was conducted, tak- ing into account the participants’ age, gender, education level, spatial ability, and spatial memory. The Forward: LR method was used to select variables that were not related to self-motion perception direction. The results showed that participants with high spatial ability had strong self-motion perception direction ability (OR = 0.637, 95% CI: 0.438-0.928, p < 0.05). Furthermore, participants with strong self-motion perception direction ability had strong joystick operation ability (F(1, 34) = 20.87, p < 0.01, partial η2 = 0.38). In addition, it was found that participants with stronger self-motion perception direction ability spent less time on navigation (F(1, 105) =11.74, p < 0.01, partial η2 = 0.101) and had a lower cognitive load (F(1, 105) = 5.17, p < 0.05, partial η2 = 0.047).
CONCLUSION
For different environments, this study found that participants made fewer navigation errors in the simple environment, but their cognitive load was higher. There could be two possible reasons for this. Firstly, the environ- mental complexity affects participants’ frustration and effort, which in turn affects their cognitive load. The simpler the environment, the more effort participants felt they needed to exert to complete the task, and the more frustrated they became after making mistakes. And it was found that the number of intersections was higher in the simple environment, which may be a contributing factor to the higher cognitive load. In terms of the type of AR pedestrian navigation system, participants performed best in naviga- tion performance and subjective feedback with the route-based AR pedestrian navigation systems, followed by the landmark-based AR walking navigation system, and the map-based AR walking navigation system was the least effec- tive. This is because older adults’ spatial abilities mainly focus on landmark knowledge and route knowledge, not configurational knowledge(Goodman et al., 2009; May et al., 2003; Sjölinder et al., 2005; Zhou et al., 2005).
Post-experiment interviews revealed that the route-based AR walking navi- gation system was found to be more similar to real-life navigation landmarks, making it easier to use. However, the landmark-based AR walking navi- gation system requires participants to pay attention to the corresponding landmarks, and their relationships with arrow indicators and accompanying text to confirm whether they have made the correct decision. This may lead to navigation errors when participants rely on a single source of information. In terms of personal traits, this study found that participants with high spatial memory levels completed tasks in a shorter time and made fewer navigation errors compared to those with low spatial memory levels. In terms of manipu- lating the joystick, older adults experienced difficulties in matching their own direction with road direction in the virtual environment. Because the ability of older adults to perceive their own movement direction decreases with age (Warren et al., 1989), but the self-motion perception during navigation is usually based on both body and visual cues (Lester et al., 2017), especially in virtual environments, where users rely more on visual optic flow information. This may affect users’ navigation and perception of the environment.
ACKNOWLEDGMENT
The authors would like to acknowledge the support from the National Natural Science Foundation of China (Grant nos. 72171030).
REFERENCES
Azuma, R., Baillot, Y., Behringer, R., Feiner, S., Julier, S., & MacIntyre, B., 2001.
Recent advances in augmented reality. IEEE computer graphics and applications, pp. 34–47. Giannopoulos, I., Kiefer, P., & Raubal, M., 2015. GazeNav: Gaze-based pedestrian navigation. In Proceedings of the 17th international conference on human- computer interaction with mobile devices and services, August, pp. 337–346. Goodman, J., Brewster, S. A., & Gray, P., 2005. How can we best use landmarks
to support older people in navigation?. Behaviour & Information Technology, pp. 3–20. Kim, S., & Dey, A. K., 2009. Simulated augmented reality windshield display as a cognitive mapping aid for elder driver navigation. In Proceedings of the SIGCHI conference on human factors in computing systems. April, pp. 133–142. Lester, A. W., Moffat, S. D., Wiener, J. M., Barnes, C. A., & Wolbers, T., 2017. The
aging navigational system. Neuron, pp. 1019–1035. May, A. J., Ross, T., Bayer, S. H., & Tarkiainen, M. J., 2003. Pedestrian navigation aids: information requirements and design implications. Personal and Ubiquitous Computing, pp. 331–338. Montuwy, A., Cahour, B., & Dommes, A., 2018. Older pedestrians navigating with
AR glasses and bone conduction headset. In Extended abstracts of the 2018 CHI conference on human factors in computing systems, pp. 1–6. Peleg-Adler, R., Lanir, J., & Korman, M., 2018. The effects of aging on the use of handheld augmented reality in a route planning task. Computers in Human Behavior, pp. 52–62.
The Efficiency and User Experience of AR Walking Navigation Tools 29
Rehman, U., & Cao, S., 2016. Augmented-reality-based indoor navigation: A comparative analysis of handheld devices versus google glass. IEEE Transactions on Human-Machine Systems, pp. 140–151. Rehrl, K., Häusler, E., Steinmann, R., Leitinger, S., Bell, D., & Weber, M., 2012.
Pedestrian navigation with augmented reality, voice and digital map: results from a field study assessing performance and user experience. In Advances in Location- Based Services: 8th International Symposium on Location-Based Services, Vienna 2011, pp. 3–20. Rümelin, S., Rukzio, E., & Hardy, R., 2011. NaviRadar: a novel tactile information display for pedestrian navigation. In Proceedings of the 24th annual ACM symposium on User interface software and technology October, pp. 293–302. Sjölinder, M., Höök, K., Nilsson, L. G., & Andersson, G., 2005. Age differences and
the acquisition of spatial knowledge in a three-dimensional environment: Eval- uating the use of an overview map as a navigation aid. International Journal of Human-Computer Studies, pp. 537–564. Tang, L., & Zhou, J, 2020. Usability assessment of augmented reality-based pedestrian navigation aid. In Digital Human Modeling and Applications in Health, Safety, Ergonomics and Risk Management. Posture, Motion and Health: 11th International Conference, DHM 2020, Held as Part of the 22nd HCI International Conference, HCII 2020, Copenhagen, Denmark, July 19–24, 2020, Proceedings, Part I 22, pp. 581–591. Warren Jr, W. H., Blackwell, A. W., & Morris, M. W., 1989. Age differences in
perceiving the direction of self-motion from optical flow. Journal of gerontology, pp. 147–153. Zhou, J., Rau, P. L. P., Gao, Q., Qin, J., & Liao, Q., Requirements of transport information service and route guidance service for older adults. In 17th World Congress on Ergonomics.
LISTED IN THE AHFE DIGITAL BOOKSTORE CATALOGUE
Explore the complete digital volume
Augmented, Virtual and Mixed Reality Simulation
Read this individual research paper free through the original publisher, or explore the full digital proceedings book.
ISBN 978-1-958651-94-0
Explore this ISBN in the AHFE Bookstore ↗Listed in the July 2026 bookstore catalogue; search by ISBN to confirm current availability · Digital book purchase optional