Shanmuga Priya Srinivasan, Paul Tribulowski, Alisa Lindner (2024). Evaluation of different HMIs to improve operator hazard perception and user experience in teleoperation of automated shuttles. In: Advances in Human Factors of Transportation. AHFE Open Access, vol. 148, pp. 161–171. https://doi.org/10.54941/ahfe1005206
Autonomous vehicle technologies are rapidly evolving. In challenging situations that exceed the vehicle's autonomous capabilities, the teleoperation of vehicles enables human operators to remotely control and maneuver a vehicle. Operating remotely is not a trivial task, especially due to the lack of feedback caused by physical decoupling from the vehicle, the reduced quality of information of the vehicle environment, and the latency caused by the data transfer. We aim to explore if a human operator can be supported in performing the task by enhancing visual cues, acting as a proactive alert system using Augmented Reality (AR) overlays. We studied three types of hazards (behavioural precursor, environmental precursor, and sudden hazard appearance) and three Human-Machine-Interfaces (no support, bounding boxes, and bounding boxes with warning sign) in 3x3 within-subjects design. We analysed the perceived criticality of the hazard, and perceived difficulty when performing the task. The study was conducted with N = 37 participants using 15 short, real-world videos. Perceived criticality ratings did not significantly differ between various HMI concepts (p = .610). However, there was a significant difference in the evaluation of perceived difficulty between no support and bounding box (p = .001) and no support and bounding box with warning (p = .001). Participants perceived the scenario as easier when displaying bounding boxes for hazards with sudden appearances (p = .004) and behavioural predictions (p = .021), and the inclusion of warning signs for sudden hazards (p = .002) further decreased the difficulty. These results can be incorporated to refine the HMI design of teleoperation cockpits and to facilitate safety and operator experience in teleoperation. Future research should investigate if the timing or data representation has effect on the operator experience and performance.
Teleoperated driving, also known as “remote driving”, describes the remote control of a vehicle by a human in specific situations (Neumeier et al., 2019). Teleoperation of vehicles leverages the advantages of automated driving while still incorporating human oversight. Despite optimal performance under ideal
conditions, challenges such as new construction sites, improperly parked cars, pedestrians, and adverse weather require manual intervention. The autonomous shuttles that operate in Kronach, Germany, as part of the Shuttle Modell Region Oberfranken (SMO), also face these problems. Transition- ing from on-board stewards to remote operators for increased efficiency and safety is part of the project’s goals. An overview of challenges and opportu- nities for improving the availability of autonomous shuttle services can be found in Dehghani et al. (in press).
In teleoperated driving, the operator is not physically present in the vehicle but instead controls it from a remote location through a communication link. Three key hurdles in the teleoperation paradigm and their implications on operator performance and system reliability are explained below.
Firstly, the physical decoupling of the operator from the vehicle, pre- senting difficulties in crucial aspects of the driving task (Tener & Lanir, 2022; Donges, 1982). As the operator lacks real-time information on the vehicle’s movements and the constantly changing environment, effective decision-making becomes a complex endeavour (Donges, 2009).
Secondly, the latency in transmitting camera images, leading to delays in visual feedback. This compromises vehicle control precision and the opera- tor’s performance, causing issues like over- or under-steering (Tener & Lanir, 2022). Managing these changing latencies proves to be a significant challenge for individuals (Liu et al., 2017; Luck et al., 2006).
Thirdly, the operator’s access to visual information of the vehicle environ- ment. Teleoperation poses challenges due to remote operation through video images, with restricted field of view, limited depth information, and potential degradation from bandwidth limitations (Chen et al., 2007). Notably, human vision takes precedence in vehicle guidance, surpassing vestibular percep- tion, with 80-90% of necessary information processed visually (Abendroth & Bruder, 2009). The accuracy of determining speeds, sizes, and distances of other vehicles can be compromised depending on the cameras field of view, viewing angle, and frame rate (Chen et al., 2007).
This paper delves into the specific challenges associated with the hazard perception in teleoperation. Hazard perception is defined as the process of identifying, assessing, and responding to potential dangers on the road to pre- vent collisions (Crundall et al., 2012). In teleoperation, the operator has to detect and respond appropriately to potential hazards (obstacles, pedestrians, other vehicles, changes in the road condition, etc.) in the area around the vehi- cle based on the cockpit screens. Crundall et al. (2012) classify hazards into three types: behavioural prediction hazards, involving anticipation of visible stimuli; environmental prediction hazards, where the hazard source remains hidden until triggered; and dividing/focusing attention hazards, requiring monitoring of multiple precursors before identifying the actual hazard.
To enhance the user experience and simplify the driving task, several approaches have already been developed in the field of AR: Schall et al. (2013) and Rusch et al. (2013) aimed to improve reaction times for object detection through a converging bounding rhombus design. Frémont et al. (2019) created AR aids, featuring a bounding box and a warning panel, to alert drivers in dangerous situations or before critical moments. Schwarz
Evaluation of Different HMIs to Improve Operator Hazard Perception 163
and Fastenmeier (2017) emphasize that detailed graphic warnings, convey- ing critical object information, are pivotal for drivers to accurately anticipate and respond promptly to potential hazards on the road. Graf et al. (2020) visualized the trajectory of the vehicle in a predictive corridor.
A comprehensive literature review was conducted to identify the scales to be used for assessing the subjective rating. Purucker et al. (2014) used Neukum’s criticality scale (Neukum et al., 2008) to assess criticality of driving and traffic situations. There are also validated scales for subjective measures such as workload, telepresence, and susceptibility (Riley et al., 2004). They also propose objective measures: Situation awareness in teleoperation can be divided between local and remote worlds, and an increase in attention to one may result in a loss of situational awareness in the other. The SAGAT model (Endsley, 1988, 1995) is frequently used to quantify telepresence and therefore situational awareness.
We found that although different concepts to support operators have been outlined, there are still uncertainties as to whether these concepts really lead to more safety and a better user experience. Thus, this paper explores if uti- lizing AR overlays over visual cues can act as a proactive warning system for operators during the driving task. Our study addressed the following research questions: Research Questions and Hypotheses
Based on our comprehensive review of existing literature, we developed the following research questions: RQ1: Which situations are perceived as especially critical in teleoperation? RQ2: How can we design the additional information to improve the teleop- erator’s user experience?
We broke down these research questions into hypotheses to investigate the following: H1: There is a difference in the perceived criticality and perceived difficulty between the HMIs (Factor A: HMIs). H2: There is a difference in the perceived criticality and perceived difficulty between different hazards (Factor B: Hazards).
METHOD
Experimental Design Factor A: HMIs
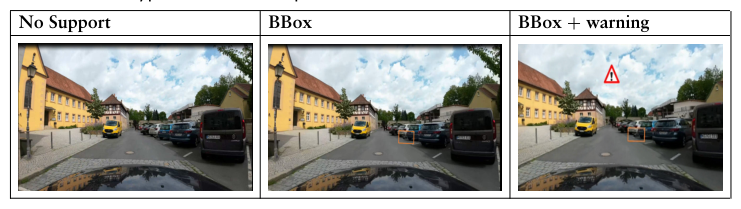
Table 1. Three types of HMI concept.
In our study, we evaluate how different HMIs impact operator perfor- mance and hazard perception. Existing literature indicates that additional information in HMIs is perceived as useful (Schall et al., 2013; Rusch et al., 2013; Frémont et al., 2019; Graf et al., 2020). Inspired by Phan et al. (2016), we aim to quantify the effectiveness of two HMI concepts: bounding boxes (Bbox) over potential hazard precursors and bounding boxes with additional warning signs (Bbox + warning) (see Table 1).
Factor B: Hazards The process of recognizing, assessing, and reacting to potential hazards on the road can be impeded, thus limiting hazard perception (Crundall et al., 2012). We suggest focusing on the recognition of different types of hazards: Behavioural precursor (BP) involves anticipating the behaviour of a visible stimulus before it becomes dangerous, aligned with Crundall et al. (2012).
Sudden appearance of hazard (SA) refers to the situations in which a haz- ard appears from a hidden space or suddenly and without a precursor. This perspective diverges from the concept by Crundall et al. (2012) of an envi- ronment precursor, as there is an absence of any anticipatory hint or warning in our approach.
Environmental precursor (EP) involves anticipating danger based on pre- cursors in the situation. We consider this scenario as especially critical in teleoperation as the hazard/object being displayed is smaller compared to real-world driving scenarios.
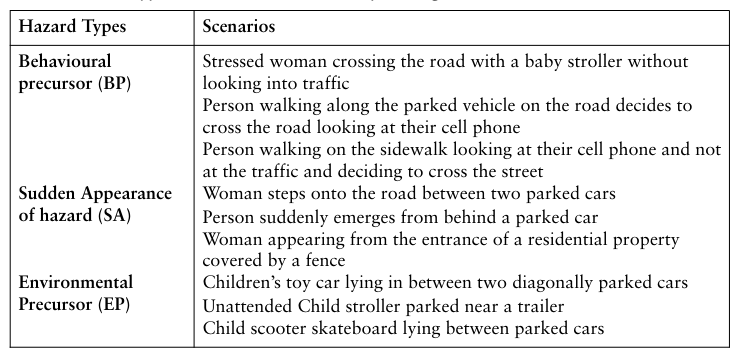
Each hazard type had three similar scenarios as explained in Table 2. The scenarios were presented in 30-second videos recorded in a real-life scenario in an urban area. For randomization, three different sets were created with each set comprising of 15 videos. Out of these, 6 videos had no hazard. The remaining 9 videos had 3 videos of the 3 hazard types. For each HMI con- cept, a new scenario was used to avoid learning effects. Each participant was presented with one set.
Table 2. Three types of hazards with corresponding scenarios.
Evaluation of Different HMIs to Improve Operator Hazard Perception 165
We used a 3x3 within-subjects design with the following dependent variables:
- Perceived criticality of the hazards: Participants were asked to respond to the question ‘How did you perceive the situation?’ using the criticality scale by Neukum et al. (2008). It categorizes ratings from “imperceptible” (0) to “uncontrollable” (10).
- Perceived difficulty of performing the task: A single ease questionnaire adapted from Sauro and Lewis (2012) was utilized to gauge respondents’ overall ease in completing the task based on the provided information. A 7- point Likert scale with the value 1 denoted ‘very easy’ and 7 denoted ‘very difficult’ was used.
Additionally, we asked participants whether they perceived any hazards in the scenarios provided and if yes, which. All questions as well as the instructions were provided in German and English. Also, gaze behaviour and objective data such as reaction times were recorded but are not analysed within this paper.
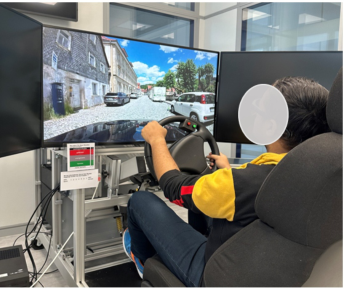
Apparatus The teleoperation cockpit was situated at Coburg University of applied sci- ences and arts. Our setup included three 43-inch monitors, an adjustable seat, and a steering wheel with pedals. The setup is shown in Figure 1.
Figure 1: Teleoperation cockpit setup.
Participants The study included 37 participants (8 women and 29 men; 19–60 years old; mean M = 29.19 SD = 9.28). Of the total participants, 19 were students. Among the participants, 21 held European licenses, 16 held Asian licenses, but not all were habitual drivers. The annual mileage was M = 11,039 km (SD = 10,150), the duration of driving license ownership M = 10.35 years (SD = 9.33). Participants self-registered for the study. All participants pro- vided written consent for the publication of the data, and they were rewarded with incentives for their involvement in the study.
Procedure The study was conducted by the same experimenter individually for each participant and one trial lasted about 40 min. The N = 37 participants were instructed to take on the role of an operator controlling the vehicle remotely. The participants were asked to react as they would in real traffic.
The study began with three familiarization videos covering the three HMI concepts. After each video or when the brake pedal was pressed, participants answered questions about their perceived criticality of the hazards, what they found to be a hazard/hazards, and the overall ease of the task.
Analytic Strategy The data was analysed using JASP version 0.18.3. Before conducting statis- tical analyses, the collected data underwent pre-processing such as checking for missing values, outliers, or data integrity issues.
Primarily, we used the Friedman test, a non-parametric method suitable for comparing dependent groups if, as was the case for our data, the assump- tions of normality and homogeneity of variances are not met. If the Friedman test yielded significant results, post-hoc analyses utilizing Conover’s test were conducted to identify specific differences between the conditions. Statistical significance was determined based on the pre-defined alpha level α = 0.05. For the post-hoc tests, the Holm correction was used. The following tests were calculated for the different HMIs with either perceived criticality or per- ceived difficulty as the dependent variable (H1), for all hazard types and each individual hazard type. For H2, the hazard type is the independent variable.
RESULTS
H1: There is a difference in the perceived criticality and perceived difficulty between the HMIs (Factor A: HMIs).
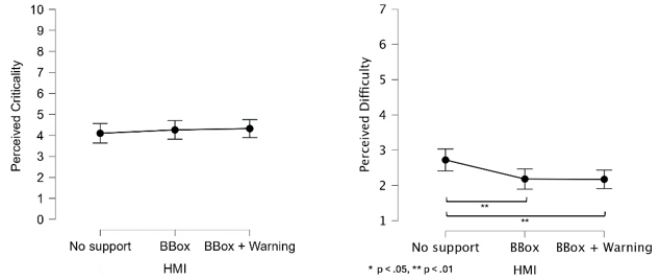
There was no significant difference in the perceived criticality ratings between the different HMI concepts (X2 (2) = 0.989, p = .610), with a mean value of M = 4.10 95% CI [3.63, 4.56] for no support, M = 4.26, 95% CI [3.82, 4.71] for BBox and M = 4.32, 95% CI [3.89, 4.74] for BBox + warning. Consequently, we reject our hypothesis that there is a difference in perceived criticality between the HMIs.
There was a significant difference in the evaluation of the perceived dif- ficulty between the different HMI concepts (X2 (2) = 16.893, p <.001, Kendall’s W = 0.076). The mean value was M = 2.74, 95% CI [2.42, 3.06] for no support, M = 2.18, 95% CI [1.89, 2.47] for BBox and M = 2.17, 95% CI [1.91, 2.44] for BBox + warning. Conover’s post-hoc comparisons show that the significant difference is between no support and BBox (p = .001) and no support and BBox + warning (p = .001). The difference between the support through BBox and BBox + warning is not significant (p = .967).
Figure 2 shows the mean perceived criticality rating and the mean per- ceived difficulty reported by the participants for the different HMI concepts. The perceived difficulty scale reflects the participants’ subjective assessment of the ease of the driving tasks in each video, whereby a lower value means that they found the situation to be easier.
Evaluation of Different HMIs to Improve Operator Hazard Perception 167
Figure 2: Mean perceived criticality (left) and mean perceived difficulty (right) with 95% CI.
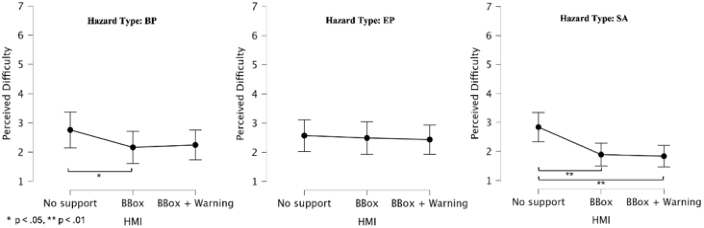
While the perceived difficulty for all hazard types differed between the HMIs, further analyses showed that this significant result was caused by the BP (X2 (2) = 7.853, p = .020, Kendall’s W = 0.106) and SA (X2 (2) = 15.146, p <.001, Kendall’s W = 0.205) scenarios. Post-hoc tests show that for BP, bounding boxes reduced the difficulty significantly (p = .021), while adding the warning sign did not (p = .143). For SA, adding the BBox (p = .004) or the BBox + warning (p = .002) reduced the perceived difficulty. For EP, the results were not significant (X2 = 0.813, p = .666). These results can be seen in Figure 3.
Figure 3: Mean perceived difficulty based on HMIs for different hazard types with 95% CI.
H2: There is a difference in the perceived criticality and perceived difficulty between different hazards (Factor B: Hazards).
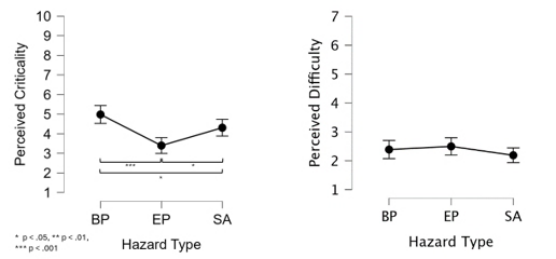
There is a significant difference in perceived criticality depending on the precursor for the hazard (X2 (2) = 22.207, p <.001, Kendall’s W = 0.100), with a mean value of M = 4.98, 95% CI [4.53, 5.44] for BP, M = 3.37, 95% CI [2.98, 3.78] for EP and M = 4.31, 95% CI [3.88, 4.73] for SA. Post-hoc tests show the difference is significant between BP and EP (p <.001), EP and SA (p = .029) and BP and SA (p = .025).
The difference in perceived difficulty however is not significant (X2 (2) = 4.497, p = .106) with a mean value of M = 2.39, 95% CI [2.07, 2.70] for BP, M = 2.50, 95% CI [2.20, 2.82] for EP and M = 2.19, 95% CI [1.94, 2.44] for SA. Figure 4 illustrates the mean perceived criticality and mean perceived difficulty with the 95% CI depending on the hazard type.
Figure 4: Mean perceived criticality (left) and mean perceived difficulty (right) with 95% CI.
In total, we reject the hypothesis that there is a difference in both perceived criticality and perceived difficulty between the hazard types. For the criticality however, we found evidence that it significantly differs between the different hazards.
Explorative Analysis We wanted to explore whether the hazard hit and miss rate differed between the HMIs. Analyses showed that there is a significant relationship between the HMIs and the correct identification of the hazard (X2 (2) = 8,793, p = .012, V = 0.162), which corresponds to a small effect. With the help of either BBox or BBox + warning, the participants were more likely to correctly identify the hazard shown in the scenarios. Splitting the analysis between the different hazard types shows no significant results for BP (X2 (2) = 0,519, p = .772) and SA (X2 (2) = 2,075, p = .354), but a significant relationship for EP (X2 (2) = 10,689, p = .005, V = 0.310), which is a medium effect. For the EP, six participants found the BBox on the objects misleading, while other participants could easily identify the EP hazard with the help of the AR overlays. Seven participants did not perceive the unoccupied child trolley and bikes as potential hazards, despite the possibility of a child appearing from the hidden space.
DISCUSSION
Conclusion
Significant differences were identified in perceived criticality among all haz- ard types. Perceived difficulty did not differ between hazards; however, notable distinctions were observed between no support and BBox, as well
Evaluation of Different HMIs to Improve Operator Hazard Perception 169
as no support and BBox + warning. SA was perceived easier with BBox or BBox + warning. BP was perceived as easier with BBox but not with BBox + warning. Using BBox or BBox + warning helped people better iden- tify hazards, especially for EP, while no significant improvement was observed for BP and SA. These findings strongly affirm the proficiency of the HMIs in successfully pinpointing potential hazards.
Interpretation Our findings suggest that the introduction of HMIs may prove beneficial in improving the perception and recognition of hazards, even though for BP, the warning signs were not helpful. Notably, the introduction of AR overlays led to all participants successfully identifying the SA. AR clues, especially for SA, were effective in reducing perceived difficulty. Sixteen percent found the AR overlay on objects for environmental hazards misleading, while nineteen percent overlooked the potential hazard of an unoccupied child trolley and stationary bikes despite the hidden space where a child may suddenly appear. This was attributed to a lack of understanding the context of EP. Despite being perceived as least critical, the HMIs effectively increased the hit ratio for EP.
Limitation During the experiment, we noticed that the participants reactions varied among the situations. Among the three scenarios for BP, one emerged as particularly critical, involving a woman with a stroller in close proximity to the vehicle, resulting in the highest perceived rating of criticality. Partici- pants exhibited diminished caution and vigilance over time, likely attributed to the perception that a simulated video did not replicate a real driving situation. Participants perceived unintended hazards like construction sites, random people’s movement etc. as hazards. To overcome these limitations, we plan to conduct an improved study using simulated data (CARLA) to assess the impact of timing or scenario presentation on the results. We are still exploring the research opportunity to conduct the same study in teleoperated autonomous shuttles.
ACKNOWLEDGMENT
The Shuttle-Modellregion-Oberfranken (SMO) project is supported by the Federal Ministry of Transport and Digital Infrastructure. For more informa- tion about the project, please see: www.shuttle-modellregionoberfranken.de.
REFERENCES
Abendroth, B., & Bruder, R. (2009). Die Leistungsfähigkeit Des Menschen Für Die Fahr-Zeugführung. In: H. Winner, S. Hakuli, G. Wolf (Eds.) Handbuch Fahrerassistenzsys-Teme (pp. 4–14). Casali, J. G., & Wierwille, W. W. (1983). A comparison of rating scale, secondary-
task, physiological, and primary-task workload estimation techniques in a sim- ulated flight task emphasizing communications load. Human Factors, 25(6), 623–641.
Chen, J. Y., Haas, E. C., & Barnes, M. J. (2007). Human Performance Issues and User Interface Design for Teleoperated Robots. IEEE Transactions on Systems, Man, and Cybernetics, Part C (Applications and Reviews), 37(6), 1231–1245. Crundall, David & Chapman, Peter & Trawley, Steven & Collins, Lyn & Loon,
Editha & Andrews, Ben & Underwood, Geoffrey. (2012). Some hazards are more attractive than others: Drivers of varying experience respond differently to different types of hazard. Accident; analysis and prevention. 45. 600–9. 10.1016/j.aap.2011.09.049. Donges E (1982) Aspekte Der Aktiven Sicherheit Bei Der Führung von Personenkraft-Wagen. Automob Ind 27(2):183–190. Dehghani, A., Salar, H., Srinivasan, S., Zhou, L., Arbeiter, G., Lindner, A., and Patino-Studencki, L. (2023). Enhancing availability of autonomous shuttle services: A conceptual approach towards challenges and opportunities. In Press. Donges, E. 1982. “Donges E (1982) Aspekte Der Aktiven Sicherheit Bei Der Führung
von Personenkraft-Wagen. Automob Ind 27(2):183–190.” Donges, E. (2009). Fahrerverhaltensmodelle. In: H. Winner, S. Hakuli, G. Wolf (Eds.)
Handbuch Fahrerassistenzsysteme (pp. 15–23). Endsley, Mica. (1988). Design and Evaluation for Situation Awareness Enhancement.
Proceedings of the Human Factors and Ergonomics Society Annual Meeting. 32. 10.1177/154193128803200221. Endsley,. 1995. “Endsley, M. R. (1995). Measurement of Situation Awareness in Dynamic Systems. Hu-Man Factors, 37(1), 65–84.” Frémont, Vincent & Phan, Minh-Tien & Thouvenin, Indira. (2019). Adap-
tive Visual Assistance System for Enhancing the Driver Awareness of Pedes- trians. International Journal of Human-Computer Interaction. 36. 1–14. 10.1080/10447318.2019.1698220. Graf, G., Abdelrahman, Y., Xu, H., Abdrabou, Y., Schitz, D., Hussmann, H., & Alt, F. (2020). The Predictive Corridor: A Virtual Augmented Driving Assistance System for Teleoperated Autonomous Vehicles. ICAT-EGVE. Liu, R., Kwak, D., Devarakonda, S., Bekris, K., & Iftode, L. (2017, September).
Investi-gating Remote Driving over the LTE Network. In Proceedings of the 9th International Conference on Automotive User Interfaces and Interactive Vehicular Applications (pp. 264–269). Luck, J. P., McDermott, P. L., Allender, L., & Russell, D. C. (2006, March). An Investigation of Real World Control of Robotic Assets under Communication Latency. In Proceedings of the 1st ACM SIGCHI/SIGART Conference on Human-Robot Interac-Tion (pp. 202–209). Neukum, A., Lübbeke, T., Krüger, H.-P., Mayser, C., & Steinle, J. (2008). ACC-
Stop&Go: Fahrerverhalten an funktionalen Systemgrenzen. In M. Maurer & C. Stiller (Eds.), 5. Workshop Fahrerassistenzsysteme - FAS 2008 (pp. 141–150). Karlsruhe: fmrt. Neumeier, Stefan & Wintersberger, Philipp & Frison, Anna Katharina & Becher, Armin & Facchi, Christian & Riener, Andreas. (2019). Teleoperation: The Holy Grail to Solve Problems of Automated Driving? Sure, but Latency Matters. 186–197. 10.1145/3342197.3344534. Phan et al., 2016. “Minh Tien Phan, I. Thouvenin, and V. Fremont, ‘Enhanc-
ing the Driver Awareness of Pedestrian Using Augmented Reality Cues,’ in Proc. IEEE Int. Conf. Intell. Transp. Syst., 2016, pp. 1298–1304, doi: 10.1109/ITSC.2016.7795724.” Purucker, Christian & Rüger, Fabian & Schneider, Norbert & Neukum, Alexandra & Faerber, Berthold. (2014). Comparing the perception of critical longitudinal distances between dynamic driving simulation, test track and Vehicle in the Loop.
Evaluation of Different HMIs to Improve Operator Hazard Perception 171
Riley, J. M., Kaber, D. B., & Draper, J. V. (2004). Situation awareness and attention allocation measures for quantifying telepresence experiences in teleoperation. Human Factors and Ergonomics in Manufacturing & Service Industries, 14(1), 51–67. Rusch, Michelle & Schall, Mark & Gavin, Patrick & Lee, John & Dawson, Jeffrey
& Vecera, Shaun & Rizzo, Matthew. (2013). Directing Driver Attention with Augmented Reality Cues. Transportation Research. Part F, Traffic Psychology and Behaviour. 16. 127–137. 10.1016/j. Trf.2012.08.007. Sauro, J. & Lewis, James. (2012). Quantifying the User Experience. 10.1016/C2010- 0-65192-3. Schall, Mark & Rusch, Michelle & Lee, John & Dawson, Jeffrey & Thomas,
Geb & Aksan, Nazan & Rizzo, Matthew. (2013). Augmented Reality Cues and Elderly Driver Hazard Perception. Human Factors. 55. 643–58. 10.1177/0018720812462029. Schwarz, Felix & Fastenmeier, Wolfgang. (2017). Augmented reality warnings in vehicles: Effects of modality and specificity on effectiveness. Accident; analysis and prevention. 101. 55–66. 10.1016/j.aap.2017.01.019. Tener, F., & Lanir, J. (2022, April). Driving from a Distance: Challenges and Guide-
lines for Autonomous Vehicle Teleoperation Interfaces. In Proceedings of the 2022 CHI Conference on Human Factors in Computing Systems (pp. 1–13).
LISTED IN THE AHFE DIGITAL BOOKSTORE CATALOGUE
Explore the complete digital volume
Advances in Human Factors of Transportation
Read this individual research paper free through the original publisher, or explore the full digital proceedings book.
ISBN 978-1-964867-24-3
Explore this ISBN in the AHFE Bookstore ↗Listed in the July 2026 bookstore catalogue; search by ISBN to confirm current availability · Digital book purchase optional