Alf Ove Braseth, Alexandra Fernandes (2024). Overview of Displays for nuclear control rooms: a good practices study. In: Human Factors in Software and Systems Engineering. AHFE Open Access, vol. 140, pp. 127–134. https://doi.org/10.54941/ahfe1005045
Overview displays are commonly used in nuclear control rooms for improved overview and situational awareness. There is, however, a need to gain more knowledge into how such displays can be used in effective ways with operator performance in mind. The purpose of this paper is therefore to collect good practices useable as input to both new builds and modernization projects. A user-centric approach is adopted by interviewing crews of nuclear operators. Data is collected through semi-structured interviews based on concepts of situational awareness. In total eight crews (28 operators) were introduced to one of two large overview display, before the interview sessions. The results suggest that the overview display should be a stable frame of reference, leaving detailed interaction to the operator workstation. They should present key data, guiding operator actions in both normal and abnormal situations. The use of trends and balancing graphs are given positive feedback. There are concerns regarding both readability and consistency issues for the overview displays used in the study. It is suggested that the overview displays help the crew to have a shared experience, being at common ground. We conclude that the findings are congruent with the major industrial standards and guidelines, and therefore represent good practices. We are, however, cautious of using the term best practices due to weaknesses in the study procedure. We suggest advancing this work with further studies with other overview display implementations.
Overview Displays (ODs) are commonly used in nuclear control rooms, both in new builds and in modernization projects. One reason is that modern digital technologies make it cheaper and easier to integrate ODs into the control room environment than in the past, and there is also a high cost maintaining older analogue technologies (IAEA, 2010). The use of ODs might also mitigate challenges by moving from the older large analogue panels to smaller digital workstations. It has been pointed out how such small display interfaces leads to difficulties in getting the instantaneous process overview (Vicente, Roth, Mumaw, 2001; Salo, Laarni, Savioja, 2006). Industrial stan- dards and guidelines used for nuclear control rooms do also highlight how ODs can be used to present key-parameters about the general plant system status (O’Hara, Fleger, 2020); (ISO 11064, 2008). ODs are therefore sug- gested to mitigate so-called keyhole effects (Woods, 1995), presenting the
bigger picture regarding the plant status. Through this approach, the ODs have a potential to complement the in-depth view and interaction possibilities of personal operator workstations.
One challenge dealing with ODs is the huge variety in concepts, ranging from smaller TV-sized displays to huge human scaled displays (Andrews et al., 2012, Kortschot et al., 2018). It is therefore challenging to describe ODs within one concept. They do, however, share the objective to improve opera- tor performance. Within the Halden Reactor Project program several studies were conducted in real and simulated control rooms to assess the impact of large screen ODs in human performance. Hildebrandt (2022) suggested that ODs require less navigation, which might support rapid retrieval of informa- tion, supporting the operators. A study at the Halden Boiling Water (HBWR) reactor control room, where the operators (crews of 2 people) handled sce- narios in the control room (Eitrheim & Braseth, 2019) showed that the OD supported situation awareness, task performance, and reduced workload. When the OD was present, the gap between the better performing and worse performing crews was also reduced.
Another study at the HBWR analyzed differences between plan and unplanned tasks in the scenarios (Eitrheim & Braseth, 2020). There was acceptable performance in both types of tasks with and without the OD. No clear effects on workload nor communication were reported. The qualita- tive data from debriefing interviews suggested the operators used the OD for planning and long-term monitoring. In neither of these studies’ adverse impacts of the OD were detected.
There is, however, a need to collect more information regarding the use of these displays, useable as practical input to nuclear control room new designs, or in modernization projects. As we are yet cautious using the term “best practices”, we will in this paper use “good practices” regarding the qualita- tive findings. The paper is organized as follows: first we include a chapter explaining the advice for ODs from two well-known industrial guidelines; next is study method; followed by the results, including a discussion before conclusions and suggestions for further research work.
INDUSTRIAL STANDARDS AND GUIDELINES The following briefly explains some highlights from the two main industrial guidelines used for ODs in nuclear control rooms (O’Hara, Fleger, 2020), (ISO 11064, 2008), referring to them as NUREG and ISO.
NUREG explains how ODs can include an overview or high-level sum- mary of plant status, directing operators to additional information from other portions of the human-system interface, further how individuals should not be permitted to make changes to the group-view system. ISO mention how display systems should be consistent across different displays and facili- tate status overviews. NUREG explains how information should be relevant for tasks, showing major changes in plant condition and the presence of alarm information and plant safety. ISO mention information relevant for safety, as well as dynamic and priority information. NUREG suggests that information should be presented recognizable at-a-glance, using perceptually
Overview Displays for Nuclear Control Rooms: A Good Practices Study 129
salient colours, grouping and to include both charts and numbers. Further how a plant mimic (flowlines connecting major equipment) is suitable for explaining functional relationships. Visually landmarks on the OD can be used to provide a long-shot overview. ISO suggest highlighting safety critical, dynamic and priority information using size, shape and grouping together with information layering. They suggest minimizing the use of characters and superfluous elements.
Both NUREG and ISO mention the importance of designing for consis- tency across displays in the control room, the same for readability of graphics. NUREG explain how group-view systems can be used for crew coordina- tion addressing both awareness of crewmember’s actions, and difficulties in communicating, and how new smaller display concepts (typically opera- tor workstation) results in difficulty maintaining awareness of crew member actions. ISO explains how ODs can be viewed by individuals simultaneously for increased team performance.
METHOD
The approach in this work was to conduct semi-structured qualitative inter- views with end-users (control room operators) after they have been famil- iarized with one of two large ODs. It is a user-centered inspired approach to collect good practices based on user experience. The authors stress that the purpose is not to review the OD, but to use the OD as a framework to initiate fruitful discussions. The two ODs in the study are based upon well-known design-principles, using a wide variety of design elements. The interview framework is based on a structured list of topics and questions related to the use of ODs (Braseth & Fernandes, 2021). It uses the three lev- els of Situational Awareness (SA) as a structure (Endsley, 2013) for discussing benefits and drawbacks of using ODs in different operational situations.
Procedure A total of eight crews with 28 operators participated. Only one crew had prior experience of using ODs. The participants were informed about the project purpose and procedure before we started the data collection. Then, an informed consent form was presented to them in accordance with research ethics guidelines and the European General Data Protection Regulation (GDPR). It was explained that interview data was to be collected solely in the form of researcher notes and would be stored confidentially and later used for internal and external publications maintaining participant anonymity. The interviews were done by two researchers, one leading the interview while the other was responsible for making notes. The interview guide allows tailored questions considering the participants background, experience, and role. The interview length was approximately 45 minutes. Before the interview, the par- ticipants had been familiarized with the overall control room interface and OD, running the simulator in full-scale scenarios.
The interviews were conducted in groups, with either one or two crews simultaneously (between three and eight participants per interview). We
130 Braseth and Fernandes
followed a structured interview guide, focusing on the following topics: expe- riences while using the OD; information that should/should not be available in the OD; presentation of information in the OD; perceived support of the OD for overview and planning of actions; effects of OD in teamwork. The collected data was in the format of interviewer notes, collected by the two researchers present at the interviews. The notes were then compiled by one researcher and confirmed by another. After that, an overall summary (clean- ing the notes of repeated information and emphasizing the topics/comments that were more often stressed by the operators, as well as specific contribu- tions) was prepared and read by a third researcher in comparison with the original notes. In the results sections we will, therefore, focus on processed data, discussing the end-users’ input in relation to previous literature and standards on ODs.
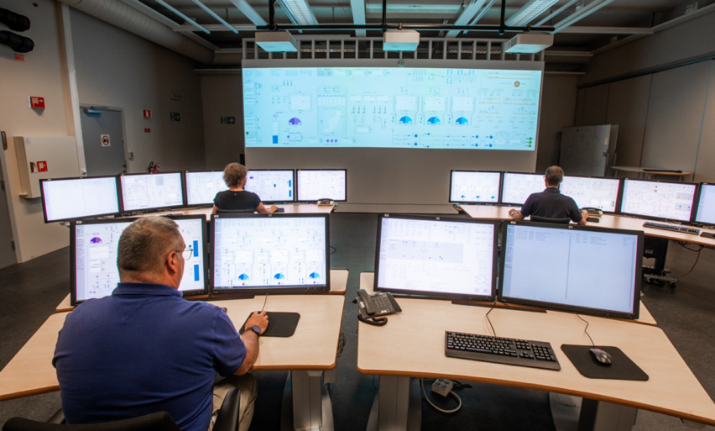
The ODs are part of the digital interface for a full scale generic pressur- ized water reactor (GPWR) simulator (McDonald & Braseth, 2019), with an advanced display information system. In the research simulator facility, the crew supervisor workstation is at the back of the room, the reactor operator at the front left and turbine operator at the front right-hand side.
Figure 1: The setup seen from the shift supervisor with one of the two ODs.
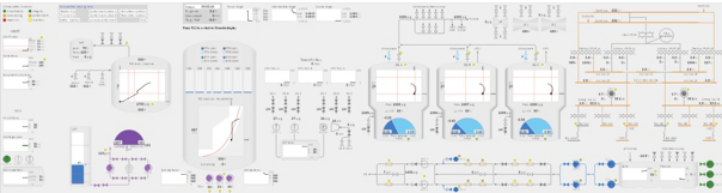
The display system is connected to simulator running operational scenar- ios. The ODs are based on a high information density concept using principles from the Information Rich Design concept (Braseth & Øritsland, 2013). The ODs use information layering, combining the use of qualitative graphics and digital numbers laid out as a “rough” schematic of the nuclear process con- necting main units with flowlines. The ODs are “read only”, having no interaction possibilities. Two different versions of the OD are used in the study, both are based on similar design principles.
Overview Displays for Nuclear Control Rooms: A Good Practices Study 131
Figure 2: One of the two ODs (6m × 1.5m) in the study.
RESULTS AND DISCUSSION
The interview findings from the interviews are discussed in relation to the advice given by the two main industrial guidelines (NUREG 0700; ISO- 11064). We organized the findings in the following way: first the general impression followed by suitable information content is presented. Next is information presentation and how the OD can help the operators in seeing into the near future. Lastly, we present how the OD can be helpful regarding crew teamwork before a paragraph on this study’s limitation and weaknesses.
Regarding the participants general experience using an OD, they suggested how it is useable in both normal and incident situations. Some mentioned how they needed some time and training to use the OD effectively. It was mentioned that the OD was helpful in prioritizing and diagnosing incidents. It was further suggested that one major advantage of the OD is how it did not require any navigation, not having to browse in the display hierarchy to get information. Several operators liked how the OD was acting as a sta- ble frame of reference, explaining how the operator workstations are more suitable for detailed process interaction. There was no mentioning of cog- nitive workload issues by using the OD, but concerns were raised regarding readability issues, particularly too small fonts, and not enough visible impact (high salience) from the OD alarm graphics. It was pointed out by several participants how it is important for the OD to be consistent with the opera- tor workstation display design. It was explained that some graphical elements are not visualized in-line with their mental model. One example is which way to visualize trended information. The next topic is which data to present, here it was suggested to include key process information, examples are reac- tor power, level, pressure, and SCRAM (rapid emergency shutdown). Also, safety-oriented information and first-up alarms were suggested appropriate for the OD. Some expressed concerns regarding information overload if the OD presents to many details, others stated that the more information the bet- ter. Some suggested that the actual OD got it quite well regarding information content. It was further suggested to include user selectable long trend graphs in the OD design if the actual design has enough room for it. We cannot see any conflicts regarding these findings comparing them to the NUREG-0700 or ISO 11064 guidelines. It is however interesting to note how the partici- pants suggested a clear operational model, using the workstation for process input and details, using the OD to monitor nuclear process through a stable framework without navigation or input possibilities.
132 Braseth and Fernandes
We then asked about how to present information. Several participants explained how the combination of graphs and numbers is suitable. Partic- ularly trended information was mentioned by several participants as well suited for ODs. Some preferred a darker background, considering eyestrain. Others liked the balancing graph (halve pie chart) to get a rapid perception of in/out flows. Others mentioned that using larger familiar graphical elements such as tanks and turbines are suitable to understand the OD, explaining how things are connected. It was suggested how trended information, and a count- down timer is helpful in predicting what is to happen next. It was further suggested to include user selectable long trend graphs in the OD design if the actual design has enough room for it. We find this feedback to be in-line with the suggestions from the industrial guidelines. It is interesting to note the spe- cific positive feedback regarding presentation of information through trends and balancing graphs. We also find the suggestion of a darker background to be relevant considering eyestrain.
The participants were mostly positive to the OD regarding teamwork, explaining how it helps the crew to have a shared experience, being at com- mon ground. It was explained how it helps seeing the process from the whole control room, particularly mentioning how the supervisor sitting at the back is included. Some mentioned how a standing posture is good for variation when working with the OD, but there were concerns about blocking sight- lines to the OD from this position for other crew members. It was also mentioned how different distances to the OD for the crew can result in read- ability challenges from some positions. It was suggested how the OD helps the crew to be aligned with each other. We acknowledge how the feedback is mentioning a positive contribution on a team level using an OD, which is in-line with explanations in the guidelines. We find it relevant that opera- tors like a standing posture for variation, although considerations should be taken to minimize challenges with blocking sightlines for other members of the crew.
We acknowledge that getting “best practices” is a complex task spanning over a different control room setup, reactor types and operational situations. From this, we see that we are currently limited to two quite similar ODs, in one specific setup. This do not reflect the great variety of OD implemen- tations in nuclear control rooms. In addition, the data collection is limited to the topics and questions within our framework. In addition, the variable interview session style regarding numbers and size of crews prevented us from quantifying the results. Based on this, we are cautious of using the term “best practices” and are instead using the weaker term “good practices” regarding our findings.
CONCLUSION
The purpose of the research work is to collect good practices regarding the use of ODs for nuclear control rooms. Among key findings are that they should act as a stable frame of reference, leaving detailed interaction to operator workstations. There are concerns regarding readability and for consistency issues for the overview displays used in the study, this should be avoided.
Overview Displays for Nuclear Control Rooms: A Good Practices Study 133
They should present key data, guiding operator actions in both normal and abnormal situations. Trends and balancing graphs are given positive feed- back. It is suggested that the OD helps the crew to have a shared experience, being at common ground. We conclude that the findings are congruent with the major industrial standards and guidelines, and therefore represent good practices. We suggest advancing this work with further studies with other implementations of overview displays.
ACKNOWLEDGMENT AND FUNDING The authors would like to acknowledge Marten Bloch and Robert McDon- ald for their support in the data collections. This work was supported by the OECD Nuclear Energy Agency (NEA) Halden Human-Technology- Organization (HTO) Project. Thanks to the members of the Program Review Group of the Halden HTO Project for review and constructive comments.
REFERENCES
Andrews, C., Endert, A., Yost, B., & North, C. (2012). Information visualization on large, high-resolution displays: Issues, challenges, and opportunities. Information Visualization, 10(4), 341–355. https://doi.org/10.1177/1473871611415997 Braseth A. O., and Øritsland T. A., (2013), ‘Visualizing complex processes on large
screen displays: Design principles based on the Information Rich Design concept’, Displays, vol. 34, pp. 215–222. Braseth A. O., Fernandes A., (2021), ‘A framework for Studying Overview Displays Best Practices (HTOR-001)’, OECD Halden Reactor Project. Eitrheim, M. H. R., Braseth, A. O. (2020). The impact of large screen overview dis-
plays on human performance: The second case study at the Halden Boiling Water Reactor (HWR-1278). OECD Halden Reactor Project, Norway. Eitrheim, M. H. R., Braseth, A. O. (2019). The impact of large screen overview displays on human performance: A case study at the Halden Boiling Water Reactor (HWR-1254). OECD Halden Reactor Project, Norway. Endsley M. R. (2013), Situation Awareness, in Lee J. D. and Kirlik A. (Eds), The
Oxford Handbook of Cognitive Engineering, Oxford University Press, p. 89 Hildebrandt, M. (2022). Micro Task Evaluation of Digital Process Control Displays.
Proceedings of the Human Factors and Ergonomics Society Annual Meeting, 66(1), 998–1002. https://doi.org/10.1177/1071181322661429 International Atomic Energy Agency (IAEA). (2010). Integration of Analog and Digital Instrumentation and Control Systems in Hybrid Control Rooms, IAEA Nuclear Energy Series No. NP-T-3.10, IAEA, Vienna. International Organization for Standardization (ISO). (2008). Ergonomic Design
of Control Centres – Part 5: Displays and controls (ISO Standard No. 11064- 5:2008). https://www.iso.org/obp/ui/#iso:std:iso:11064:-5:ed-1:v1:en. Kortschot, S., Jamieson, G.A., & Wheeler, C.(2018). An Evaluation of the Efficacy of Group View Displays in Nuclear Control Rooms. IEEE Transactions on Human- Machine Systems, Volume: 48, Issue: 4, Aug. McDonald R., Braseth A. O., (2019), ‘Report for 2.2.1 Task 3: Develop and Doc-
ument an Advanced Human System Interface for the Generic Pressurized Water Reactor Simulator’, Idaho National Lab (INL), Idaho Falls, ID (United States).
134 Braseth and Fernandes
O’Hara, J. M., & Fleger, S. (2020). Human-System interface Design Review Guidelines (NUREG-0700, Revision 3), part 6.1 Group-View Display System. United States Nuclear Regulatory Commission, Washington, DC, USA. Salo, L., Laarni, J., & Savioja, P. (2006). Operator experiences on Working in Screen-
Based Control Rooms, in Proceedings, NPIC&HMIT, Albuquerque USA. Vicente, K. J., Roth, E. M., & Mumaw, R. J. (2001). How do operators monitor a complex, dynamic work domain? The impact of control room technology, Int. Journal. Hum. Comp. Stud., pp. 831–856. Woods D. D., (1995) Toward a theoretical base for representation for representation
design in computer medium: Ecological perception and aiding human-cognition. In Flach J., Hancock P., Caird J., Vicente K. (Eds), Global perspectives On the Ecology of Human-machine Systems, vol. 1, Hillsdale, NJ: Lawrence Erlbaum Associates, Inc., pp. 157–188.
LISTED IN THE AHFE DIGITAL BOOKSTORE CATALOGUE
Explore the complete digital volume
Human Factors in Software and Systems Engineering
Read this individual research paper free through the original publisher, or explore the full digital proceedings book.
ISBN 978-1-964867-16-8
Explore this ISBN in the AHFE Bookstore ↗Listed in the July 2026 bookstore catalogue; search by ISBN to confirm current availability · Digital book purchase optional