Human mind weaves visual experiences and cognitive processes together in its learning journey to build specific knowledge domains. In this study, we explore how prior knowledge influences what we see and visualize, suggesting that our experience profoundly shapes our perceptions and eye movements. Further, we aim to discern the level of domain knowledge expertise present in participants from diverse engineering fields, utilizing eye-tracking technology. Studies in the past, highlight that eye markers such as: fixation count, total scanning duration, and saccadic duration are essential in understanding the presence of domain-specific knowledge of an individual, further giving us valuable insights into the cognitive processing underlying the information processing and comprehension during the visual task. 102 graduate students (59 male and 43 female) with age ranging between 21 to 34 years (mean age of 27.23 and a standard deviation of 2.98) from different domain knowledge backgrounds were considered in this study. In specific, 33 students from the architecture domain, 36 from the mechanical domain, and 33 from diverse domains of humanities, computer sciences, and biosciences participated in this experiment. Participants with a weighted gaze of 80% and/or above were further considered to continue with the experiments. Participants were initially presented with the Raven’s Advanced Progressive Matrix (RAPM) task set to ensure that there was homogeneity in intellectual ability within the representative sample, aiming to mitigate the influence of intelligence on problem-solving task performance. Thereafter, architecture and mechanical domain-specific tasks were presented in order of increasing task complexity to all the participants. Participants’ eye movements were analyzed to identify distinct eye patterns associated with varying expertise levels and prior domain knowledge. Our findings reveal that there are significant differences in the eye movements across participants from various domains, suggesting that different inherent visual strategies were adopted to meet the demands of the tasks under consideration. Participants with prior domain knowledge (experts in the task) exhibited more efficient information processing with fewer fixations and shorter scanning durations than novice performing the same task. Several key eye markers based on dwells, fixations, saccades, and pupils were investigated to understand the relationship between visual perception, prior domain knowledge acquisition, and learning. Significant eye markers are instrumental in discerning individuals with varying domain-specific knowledge. Notably, metrics such as Total Time Duration, Total Dwell Time, Number of Fixations, and Average Fixation Duration exhibit significance in distinguishing individuals across different domains, each manifesting at distinct time intervals. This research contributes to understanding how visual strategies evolve across diverse knowledge domains in response to varying task complexities. In addition, this research gives a systematic analysis of the visual scanning process during problem-solving by individuals in different domain specializations. The use of machine learning models such as decision trees, random forests, and support vector machines to classify novice participants from experts based on eye markers is reported. Our experiments show as high as 70% accuracy in classifying participants with domain knowledge against those who do not have domain knowledge in a domain specific task. Through this research, educators and technologists can design more effective learning environments and personalized training programs with an emphasis on the nuanced interplay between visual perception and cognitive processes. This study contributes to the ongoing dialogue surrounding integrating visual elements in educational practices and underscores the transformative potential of eye-tracking technology in enhancing learning outcomes across diverse domains.
Learning is a dynamic process through which individuals gain new insights, abilities, or comprehension via study, direct experience, or instruction (Fyfe, Rittle-Johnson, 2016) (Zhao et al., 2021). Visual perception is central to
this learning journey, which is an essential channel for acquiring knowl- edge (Kiefer et al., 2017). The impact of visual inputs in crafting mental models and notions plays a crucial role in improving the storage and recollec- tion of information (Gegenfurtner et al., 2011). The intricate bond between seeing, learning, and the accrual of knowledge highlights the need to incor- porate visual aspects in learning methodologies (Aatrai et al., 2023). The transition from learning to knowing is absorbing, embodying, and apply- ing insights gained (Lin and Murphy, 1997). This progression from the reception of information, through its embedding into memory, comprehen- sion of its significance, and eventual application, embodies a sophisticated synergy of cognitive functions (Aatrai et al., 2023). This transformation converts acquired data into valuable, actionable knowledge (Johnson et al., 2017). Visual perception is pivotal in this educational voyage, where combin- ing visual inputs with cognitive tasks enriches and expands understanding. Recognizing the vital role of visual components in educational settings is imperative for augmenting learning and retention (Charles, 2000). Within cognitive research, the advent of eye- tracking technology has pinpointed critical visual indicators associated with expertise and knowledge. This tech- nology allows observing and analyzing where and how long one’s gaze lingers on specific points, offering profound insights into cognitive processes across various tasks (Tien et al., 2014).
Eye-tracker gives us the eye movements that reveal how individuals with varying degrees of expertise engage with visual information, showing that experts often process information more efficiently (Körner and Gilchrist, 2004). Experts show fewer fixations and shorter scanning times than novice solving the same problem-solving task (Aatrai et al., 2024). In contrast, novices tend to explore more, indicated by a varied eye movement pattern, suggesting a less efficient approach to processing visual stimuli. Significant gaps remain despite advancements in using eye-tracking to study knowl- edge and expertise. There is a pressing need for more detailed research that explores how these visual indicators interact with cognitive processes across various expertise levels and task complexities. These investigations can further deepen our understanding of how expertise affects visual atten- tion and inform the development of specialized training and interventions across diverse cognitive fields.
Our research delves into the nexus between eye movement patterns and domain-specific knowledge by scrutinizing the visual strategies of 102 grad- uate students across diverse disciplines. Leveraging eye-tracking technology and machine learning algorithms, we meticulously analyzed the nuances of how visual attention shifts with varying expertise. We aim to explore the following objectives in this research work.
(1) To determine if there are any significant differences in visual perception strategies and eye movement patterns between individuals with domain- specific knowledge (expertise) and those without (novice) by analyzing eye parameters. (2) To find out whether the eye parameters that differentiate the experts from the novice are consistent over different time intervals.
Insights Through Gaze: Unraveling Visual Patterns in Domain-Specific Learning 143
(3) To exploit the usage of machine learning models in classifying individu- als as novices or experts within their domains based on eye parameters so obtained.
The rest of the paper is organized as follows. A detailed explanation of experimental design, data preprocessing, and feature engineering is presented in Section 2. Further results are explained in Section 3. Section 4 presents a detailed discussion of results, which is followed by the conclusion.
METHODOLOGY
The experimental design used in this study received its clearance from the ethical committee of the institute (No. IIT/SRIC/DR/2019). 102 graduate stu- dents (59 male–43 female ratio, with an age ranging from 21–34 years, where average age is 27.23 and standard deviation is 2.98) from different knowl- edge backgrounds (domain-knowledge groups) were considered in this study. In specific 33 students from the Architecture Domain (Architecture group), 36 from the Mechanical Engineering Domain (Mechanical group), and 33 from diverse domains such as Humanities, Biosciences, and Computer Sci- ence (further called Control group) participated in this task. Weighted gaze of 85% and/or more was kept as the threshold to continue with the experi- ment, and further it was assured that participants reported a normal vision or a corrected-to-normal vision. Further these students had no record of psychological or neurological issues in the past.
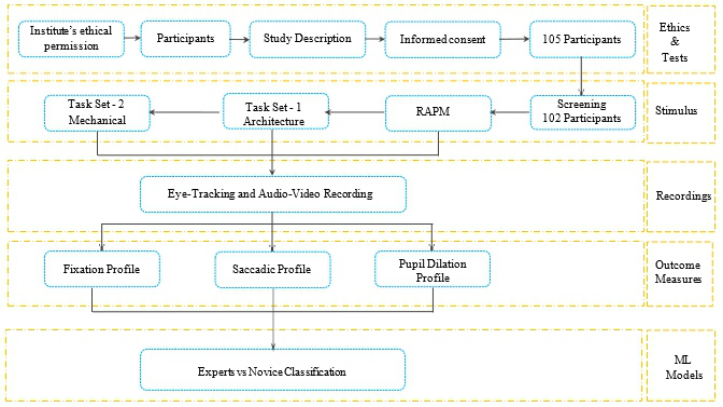
Figure 1: The figure shows a detailed visual map of the experimental design used in this research.
Eye-tracking device (Model: Tobii Pro X3-120) was initially calibrated with the participant’s eyes and is positioned beneath an HP 24f display, with a screen resolution of 1920 × 1080 pixels. Participants were seated at a dis- tance of 60 cm from the eye-tracking device, in a noise-free and closed- door
environment. Figure 1 gives a detailed representation of experiment’s design discussed above.
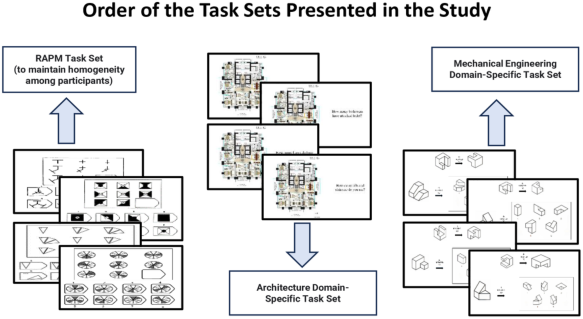
Raven’s Advanced Progressive Matrix (RAPM)(Raven, 2003), a general human intelligence test, has been used as preliminary assessment test, such that we maintain a homogeneity in the group. This assures that further tasks given in the experiments of same level of difficulty to all the participants, and it is only the knowledge that people have acquired makes a difference in solving the tasks. Before participating, all the participants provided informed consent. The tasks were then presented to the participants. Two tasks were considered in this experiments: (1) Architecture Domain-Specific Task Set and (2) Mechanical Engineering Domain-Specific Task Set, where each task set contains 4 questions related to the task under consideration. The architec- ture domain-specific task is a domain-specific task for the architecture group, used to assess oculometrics for the architecture group over the other two groups. Similarly, the mechanical domain-specific task becomes a domain- specific task for the mechanical group, helping us to analyse the oculometrics of the mechanical group over the other two groups under consideration. The order in which the task sets were presented to the participants is shown in Figure 2.
Figure 2: Figure shows the order in which the task sets were presented to the participants during the experiment.
Domain-Specific Task Set Description The Architecture and Mechanical Domain-Specific Task Sets, each compris- ing 4 questions, were designed to evaluate the domain knowledge of students in architecture and mechanical groups respectively, using oculometrics. The Architecture Task Set includes Visual Question Answering (VQA) questions based on the floor plans of THE 42, Kolkata’s tallest building, focusing on count, feature identification, and direction deduction, with increasing complexity. Conversely, the Mechanical Task Set focuses on visuaspatial understanding through object rotation identification, matching, and gen- eralization, with questions varying in the number of rotations and axes
Insights Through Gaze: Unraveling Visual Patterns in Domain-Specific Learning 145
involved. Both sets recorded participants’ eye movements and responses to assess knowledge presence over other groups.
Data Preprocessing & Feature Engineering Our Data Preprocessing & Feature Engineering methodology is divided into two major stages (Kiefer, Giannopoulos, Raubal, Duchowski, 2017).
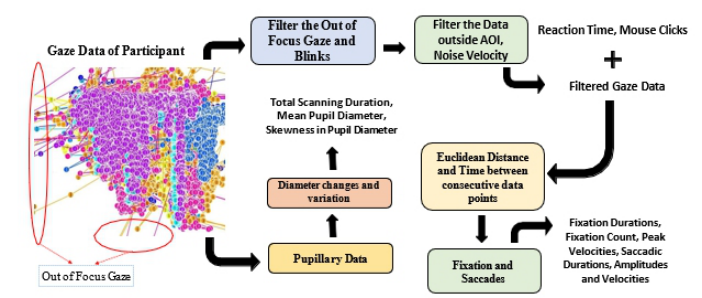
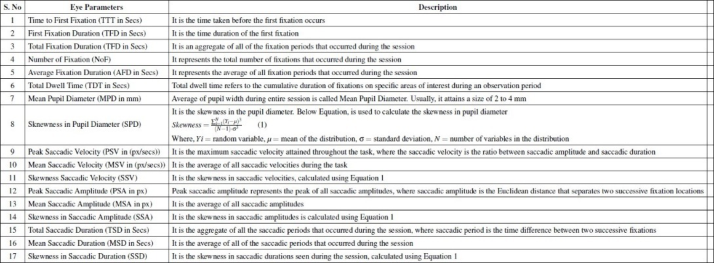
Figure 3: Figure illustrates the data preprocessing and the feature extraction stages followed in this study.Figure 4: The figure shows a detailed description of all eye-parameters used in our study, as extracted in the feature extraction stage.
These stages are: (1) The Data Preprocessing Stage and (2) The Feature Extraction & Analysis Stage. The preprocessing stage is aligned with the pro- cedure proposed by (Kiefer et al., 2017). Each of these stages has 2 steps as detailed in the subsections and Figure 3 visually guides us through the data processing and feature engineering methodology used.
Stage I: Data Preprocessing Data Filtering: Eye-tracker gives the gaze points ((x,y) coordinates, where the participant has looked). Some of these gaze points correspond to eye- blinks and out-of-focus gaze locations, which are of no use. These gaze points are removed.
Handling the Missing Data: There are gaze points other than out-of- focus gaze and eye-blinks. These are classified as fixations and saccades depending on the time spent on the gaze point and the rate of change in the eye-movement respectively. The eye-tracker sometimes may lose out on the fixation information, which is important to get deeper insights. We have handled the missing gaze point data by replacing it with the mean of gaze points ahead and following the missing gaze point of the same fixation is used to replace the missing value.
Stage II: Feature Extraction & Analysis Fixation Feature Extraction & Analysis: As mentioned, the eye- tracker (Model: Tobii Pro X3-120) classifies the gaze points into fixations and sac- cades. Fixations are those points where the gaze remains stable (in a smaller radius) for a sustained amount of time. Fixation features are extracted from the fixation gaze points collected by the eye-tracker during the experiment. Figure 4 gives a detailed explanation of fixation parameters extracted in this study.
Saccadic Feature Extraction & Analysis: A saccade is defined as the ratio of distance difference (in pixels) between two successive fixations, calculated by the Euclidean distance to the time difference between the same fixations under consideration. The saccadic features used in this study were calcu- lated through this method. Figure 4 gives a detailed explanation of saccadic parameters extracted in this study.
Customized python programs to fulfil our use cases were used during the data preprocessing and the feature extraction & analysis stages.
RESULTS
This section is divided into three phases, each uncovering the findings of the objectives defined in Section 1. Following the Stage II, as detailed in subsec- tion 2.2.2, a list of eye-parameters based on fixations, saccades, and dwell features are obtained, as detailed in the Figure 4. These eye- parameters are calculated over all the domain-specific task sets. The phase-wise analysis is as detailed below.
Phase I: Detailed Domain-Specific Task Set Analysis The main objective of Phase I analysis is to determine if there are any significant differences between experts (those with domain-specific knowl- edge) and novice (those without domain knowledge), in terms of their visual scanning. For individual tasks present in the domain-specific task sets the eye-parameters listed in Figure 4 were calculated. Particpants were divided into 2 groups based on domain-knowledge existence in the task they are per- forming. One with domain knowledge (Experts) and those without (Novice). Analysis of Variance (ANOVA) over these groups was performed.
Insights Through Gaze: Unraveling Visual Patterns in Domain-Specific Learning 147
Table 1. Table shows the significant eye-parameters that are important to differentiate the people with and without domain-knowledge in a domain-specific task set (At 95% CL).
Table available in the original PDF paper.
Significant Oculometrics Obtained Significance Value
Task Set Question Considered Architecture Domain-Specific Task Set
Table 1 shows that there are significant eye-parameters with which we can distinguish people who have domain knowledge with people who don’t have domain knowledge.
Table 2. Table shows the significant eye-parameters that are important to differentiate the people with and without domain-knowledge in a domain-specific task set, analysed on specific time-intervals. Here we have considered quartiles of total time duration to analyse the oculometrics (At 95% CL).
Insights Through Gaze: Unraveling Visual Patterns in Domain-Specific Learning 149
Phase II: Domain-Specific Task Set Analysis Over Quartiles Phase I is not sufficient to understand whether the significant eye- parameters so obtained are consistent over different time intervals among the groups, during which these tasks are solved. If the eye-parameters are consistently significant over different time intervals while solving the problem to dis- tinguish between experts and novice, then we can say that these consistent eye-parameters are significant eye-markers to understand how the visual per- ception of experts differ from those of novice. To investigate the same, we divided the entire time duration that a participant has taken to solve the task into quartiles. This helps to significantly investigate the decision-making aspect varies between the two groups. Table 2 analyzes the same task set over time intervals, using ANOVA.
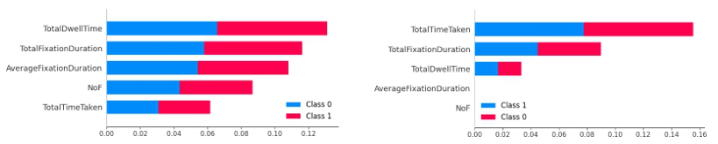
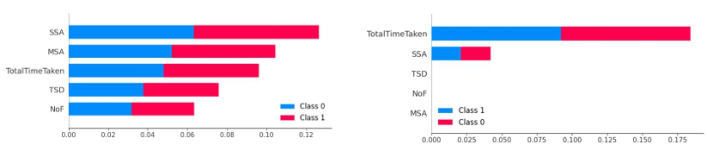
Phase III: Expert vs Novice Classification Models The results in the Phase I suggest that the eye-parameters of as TFD, FFD, NOF, PSV, MSA, and TSD are significantly different for those who have expertise in a domain as in comparison to those who lack it. Further the studies done in the Phase II suggest that TTT, TFD, NoF, AFD and TDT are consistent over quartiles in the Architecture task set, to distinguish between experts and novice. Also, the saccadic parameter of MSA is important in the Mechanical task set. The significant eye-parameters obtained in Phase II are further used as features in the ML models of Decision Trees (Quinlan, 1986), Support Vector Machines (Boser et al., 1992), and Random Forests (Breiman, 2001) to classify the experts from novice. Table 3 shows the testing accuracy obtained in the classification task of classifying experts and novice for each task considered in both of the task sets. Figures 5 & 6 help us in under- standing the significance of features obtained by ANOVA and PCA through SHAP (SHapley Additive exPlanations) analysis over the architecture and the mechanical tasks respectively. The left hand side images show the significance of individual feature corresponding to the 5 best features considered from the Phase II analysis. These features were given to the Random Forest model for expert vs novice classification. The hand side images shows the significance of PCA over the 5 best features, further aiding in a better learning of the random forest model.
Figure 5: Figures help us to understand feature significance using SHAP analysis for expert (class 0) vs novice (class 1) classification. Left: Individual feature importance from 5 best features; Right: PCA-enhanced learning with random forest on architecture task question 1.Table 3. Table shows the testing accuracy obtained in the classification task using state-of- the-art ML models. The significant eye-parameters as obtained in the Phase - II analysis are used to differentiate the people with and with- out domain-knowledge in a domain-specific task set, analysed on specific time-intervals.
Table available in the original PDF paper.
Task Considered Decision Tree Support Vector Machine Random Forests Significant Features of Phase II
Figure 6: Figures help us to understand feature significance using SHAP analysis for expert (class 0) vs novice (class 1) classification. Left: Individual feature impor- tance from 5 best features; Right: PCA-enhanced learning with Random Forest on Mechanical task question 1.
DISCUSSIONS & CONCLUSION Our pivotal discoveries highlight that there exists visual strategy differences between novices and experts. The results of Phase I analysis (subsection 3.1) are tabulated in the Table 1. Table 1 shows that there are significant eye parameters with which we can distinguish people who have domain knowl- edge with people who don’t have domain knowledge. This address our first objective. We find that there are fixation based markers such as TFD, FFD, NOF are significantly different for those who have domain knowledge in comparison with those who lack. Also we see that the saccadic parameters of PSV, MSA, TSD are significant in both the tasks to distinguish between groups with and without knowledge, stating that the searching pattern among those who have knowledge is different from those who don’t.
Further to ascertain our study, Table 2 analyzes the same task set over time intervals, using ANOVA, the Phase II analysis (subsection 3.2). In this phase, the entire task duration is divided into quartiles to understand the decision- making aspect of experts and to find how it varies from novice. This analysis has helped us to see that the eye markers of TTT, TFD, NoF, AFD and TDT are very significant in all the quartiles for all the questions in architecture domain-specific task set. This further explores the possibility of coming up with eye markers that represent a group having knowledge with those who
Insights Through Gaze: Unraveling Visual Patterns in Domain-Specific Learning 151
lack knowledge. We also see that the saccadic parameter of MSA is signif- icant in the mechanical domain-specific task set. This addresses our second objective.
The distinct eye-markers corresponding to each task in a task set are fur- ther used as important input features to the ML models, as detailed in Phase III (subsection 3.3). The aim of the ML models is to classify the participants into either of expert group (having domain-specific knowledge) and novice group (those who lack the domain-specific knowledge required to solve the task set). The testing accuracy of the same are as reported in the Table 3. It is important to note that for each model, we have a column that reports the testing accuracy when the model is trained on the best 5 significant features of Phase II (Significant Features of Phase II) and the other column reports the test accuracy of each model after applying the dimensionality reduction technique over the 5 best significant eye-parameters of Phase II (PCA on Significant Fea- tures). We achieve as high as 85% accuracy to distinguish between the two groups of experts and novice solving the same problem-solving task, solely based on their eye movement, as reported in Table 3.
This research significantly advances our understanding of the role of visual perception in learning, specifically through eye-tracking technology to explore domain-specific knowledge. By revealing how eye-tracking data can inform the creation of tailored educational environments, the study is a piv- otal contribution to educational technology and methodology. It highlights the potential of eye-tracking to provide deep insights into the visual strate- gies of experts, offering a window into how individuals engage with and solve problems within their domains. The findings demonstrate the value of eye-tracking in developing indicators of knowledge and real-time applications that can assess individual learning needs. Moreover, the study illustrates the practical implications of these insights, suggesting avenues for designing personalized learning tools and training programs that adapt to individual visual strategies and task complexities.
REFERENCES
Aatrai, S., Jha, S. K. and Guha, R., 2023, May. Visual Perception and Performance: An Eye Tracking Study. In Proceedings of the 2023 Symposium on Eye Tracking Research and Applications (pp. 1–5). Aatrai, S., Prabhala, S. G., Sharma, S., and Guha, R., 2024, Jun. The Eyes Have
It: Exploring the Connection Between Domain-Knowledge and Perception. Pro- ceedings of the 2024 Symposium on Eye Tracking Research and Applications (pp. 1–7). Boser, B. E., Guyon, I. M. and Vapnik, V. N., 1992, July. A training algorithm for optimal margin classifiers. In Proceedings of the fifth annual workshop on Computational learning theory (pp. 144–152). Breiman, L., 2001. Random forests. Machine learning, 45, pp. 5–32. Charles, R., 2000. Your Mind’s Eye: How to Heal Yourself and Release Your
Potential Through Creative Visualisation. Piatkus. Fyfe, E. R. and Rittle-Johnson, B., 2016. Feedback both helps and hinders learning: The causal role of prior knowledge. Journal of Educational Psychology, 108(1), p. 82.
Gegenfurtner, A., Lehtinen, E. and Säljö, R., 2011. Expertise differences in the comprehension of visualizations: A meta-analysis of eye-tracking research in professional domains. Educational psychology review, 23, pp. 523–552. Johnson, J., Hariharan, B., Van Der Maaten, L., Fei-Fei, L., Lawrence Zitnick, C. and
Girshick, R., 2017. Clevr: A diagnostic dataset for compositional language and elementary visual reasoning. In Proceedings of the IEEE conference on computer vision and pattern recognition (pp. 2901–2910). Kiefer, P., Giannopoulos, I., Raubal, M. and Duchowski, A., 2017. Eye tracking for spatial research: Cognition, computation, challenges. Spatial Cognition Computation, 17(1-2), pp. 1–19. Körner, C. and Gilchrist, I. D., 2004. Eye movements in a simple spatial reasoning
task. Perception, 33(4), pp. 485–494. Lin, E. L. and Murphy, G. L., 1997. Effects of background knowledge on object categorization and part detection. Journal of Experimental Psychology: Human Perception and Performance, 23(4), p. 1153. Quinlan, J. R., 1986. Induction of decision trees. Machine learning, 1, pp. 81–106. Raven, J., 2003. Raven progressive matrices. In Handbook of nonverbal assessment
(pp. 223–237). Boston, MA: Springer US. Tien, T., Pucher, P. H., Sodergren, M. H., Sriskandarajah, K., Yang, G. Z. and Darzi, A., 2014. Eye tracking for skills assessment and training: a systematic review. journal of surgical research, 191(1), pp. 169–178. Zhao, Y., Shi, J., Liu, J., Zhao, J., Zhou, F., Zhang, W., Chen, K., Zhao, X., Zhu,
C. and Chen, W., 2021. Evaluating effects of background stories on graph per- ception. IEEE Transactions on Visualization and Computer Graphics, 28(12), pp. 4839–4854.
LISTED IN THE AHFE DIGITAL BOOKSTORE CATALOGUE
Explore the complete digital volume
Human Factors and Wearable Technologies
Read this individual research paper free through the original publisher, or explore the full digital proceedings book.
ISBN 978-1-964867-17-5
Explore this ISBN in the AHFE Bookstore ↗Listed in the July 2026 bookstore catalogue; search by ISBN to confirm current availability · Digital book purchase optional