Hermann Prossinger, Violetta Victoria Prossinger Beck, Silvia Boschetti, Jakub Binter (2024). Using an Artificial Neural Network Pre-trained for a Different, yet Comparable Task to Evaluate Extreme-Affect Vocalizations that Are Indistinguishable by Humans. In: Human Interaction and Emerging Technologies (IHIET 2024). AHFE Open Access, vol. 157, pp. 166–174. https://doi.org/10.54941/ahfe1005475
Publisher statistics will load when you open Metrics.
AHFE OPEN ACCESS OPEN ACCESS CONFERENCE PROCEEDINGS PAPER
Using an Artificial Neural Network Pre-trained for a Different, yet Comparable Task to Evaluate Extreme-Affect Vocalizations that Are Indistinguishable by Humans
Humans categorize vocal displays of highly intensive affective states with very low precision. However, there are many applications necessitating correct perceptions of alarm calls. We decided to classify two negative (pain and fear), two positive (laugh and pleasure) affective states and compared these to neutral state. We used a unique dataset where all displays had been vocalized by all expressers. We used an ANN that is designed for a different, yet comparable task; one that classifies human and animal sounds as well as mundane events (such as pouring water from a jug). The outputs were then statistically analyzed using Bayesian methods. Our analysis showed that the outputs can successfully classify neutral and non-neutral affective states but they were unable to distinguish the intensive affective states from each other (with one exceptional case of laugh). Given the insights we acquired, we infer that classifying intense affective states will remain an insurmountable barrier for any future ANN. The applicability of our result also shows that the cost, time, and effort overhead of attempting to designing a dedicated ANN will be prohibitive.
The Current State of Knowledge Classifying vocalizations of pain and other intense affective states is a highly complex, non-trivial task. While significant progress has been made in developing automated pain detection systems that are based on facial expressions (ANNs: Prossinger et al., 2022; Swin Transformer: Yuan et al., 2022), and on multimodal signals using feed-forward neural networks
Using an Artificial Neural Network Pre-Trained for a Different, Yet Comparable Task 167
(Gkikas et al., 2024), there remains a need for more accurate and reliable methods for identification and classification of vocal cues in isolation.
We extend our previously published approaches that dealt with facial expressions of affects (Binter et al., 2023) by proposing a novel approach that leverages pre-trained artificial neural networks (ANNs), combined with Bayesian statistics, to enable valid identification in the challenging domain of vocal cues.
Hearing signals contributes to keeping us safe in natural environments by detecting threats. In contrast to vilight (with its extremely short wavelength), sound can diffract considerably. We are thus more safe from threats even in the cases when we are unable to source these. Also, because sound does not attenuate appreciably in our close environs, the evolution of correctly perceiving signals (not only warning ones) is, arguably, a survival advantage. However, in modern settings (such as cities) meaningful signals might be missed due to cross-talk, bystander effects, as well as information overload (oftentimes characterized as sound pollution). This is where novel, intelligent algorithms can play a role in identifying or interpreting acoustic signals, thereby improving communication and, more importantly, ensuring safety.
The Intensity Paradox and Decision Making There are problems that machine-learning-based algorithms that classify acoustic signals must deal with. These arise when models are trained on sources containing human errors. These errors can bias decision-making, introduce inconsistencies in labeling, or simply generate misunderstandings. These can then lead to models that inherit and amplify these mistakes, thereby potentially perpetuating biases and generating inaccurate outputs (more on this problem in the Stimuli Preparation section).
Sound data is plentiful (and readily available); such data can be used to train a feed-forward neural network for a plethora of general acoustic cues. Training is, however, very expensive and only companies with considerable resources can afford to produce such networks ab initio. Fine-tuning already existing networks is an option — but benefits are not guaranteed. Specifically, training dedicated neural networks that can classify vocalizations of affect cues (such as the vocal expression of pain that we are investigating) threaten to be prohibitively expensive.
The Cost-and-Benefit Analysis — A Novel Approach Rather than develop and train (or fine-tune) a neural network that focusses on each affective state vocalization separately, we use the outputs that have been generated by an already available ANN from Wolfram Technologies (details below) that had been trained on acoustic data to accomplish a more general task: identify types of commonplace acoustic signals.
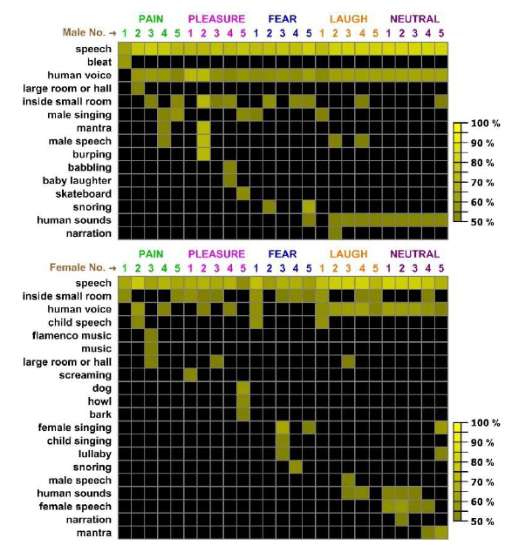
The novel, unconventional idea is that an existing model that classifies sounds and vocalizations will produce a discrete probability distribution of classifications (Fig. 1) for each of the human affective vocalizations we are studying. If these probabilities are numerically close within each vocalization group but with a likelihood distribution distinct enough from
other groups, then these probability spectra (so defined) can be used for our investigations — obviating the (expensive) necessity of training a dedicated neural network from scratch.
MATERIALS AND METHODS
Stimuli Preparation Current pre-testing practices (selecting stimuli with high inter-participant agreement) create “stimulus homogenization bias” (Van Der Zant & Nelson, 2021; Binter et al., 2023), thereby severely limiting investigations of natural variations in human behavior. While genuinely natural stimuli offer indisputable ecological validity, their inherent variability introduces considerable statistical noisiness in the data (no pun intended) and other extenuating acoustic peripherals (primarily acoustic cross-talk). Semi- naturalistic stimuli provide a valuable middle ground, allowing the manipulation of specific elements within a controlled setting for more nuanced and more reliable investigations.
Figure 1: The auditory spectrum of the affects expressed by the five males and the five females. Only probabilities of identification above 50% are included in this investigation; they are color-coded. (The side bar shows the scale of the color- coding.) Absences of identifications are rendered as black squares. All males and all females have “speech” as the most probable identification. We observe that there are more classes of identifications above 50% for females (namely, 20) than for males (namely, 15). For the females, we also note there are identifications for “Neutral” that are completely absent for “Pain” and for “Pleasure”.
Using an Artificial Neural Network Pre-Trained for a Different, Yet Comparable Task 169
We used the same stimuli as described in Binter et al. (2023) and Boschetti et al., (2023). From the numerous audio-visual materials viewed, ten audio records (five with female vocalizations and five with male vocalizations) were chosen. Based on the developments of the plots in each of these audio-visual materials, five vocalizations were selected (one of “Pain”, one of “Pleasure”, one of “Fear”, one with “Laugh”, and one for “Neutral”). Relying on the contextual information, experienced researchers agreed on the stimuli that were chosen and what expression was to be expected (both visually and acoustically during viewing).
Vocalization Identification Spectrum Each of the 25 vocalizations were of 1–2 seconds duration and were stored as *.wav files. We used a pre-trained neural network (“Wolfram AudioIdentify V1 Trained on AudioSet Data”, 2019) from Wolfram Technologies that had been trained on 2 084 320 human-labeled 10-second sound clips drawn from YouTube videos. This neural network (with 4 664 911 parameters and 156 layers of seven types) identifies the possible type of acoustic signal together with the probability of each identification.
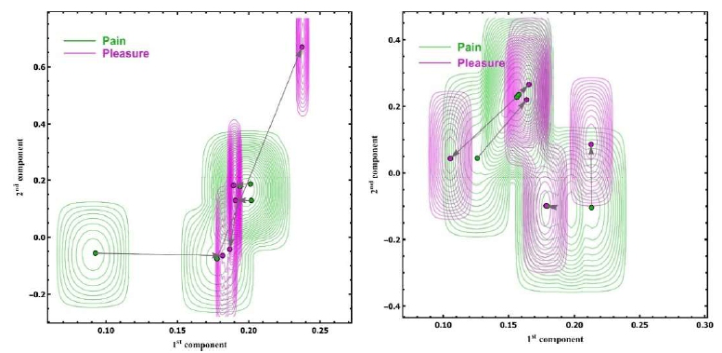
Figure 2: The contour plots of the pdf (probability density function) of the vocalizations of the affects “Pain” and “Pleasure” by the males (left) and by the females (right). The coordinates of the vocalizations were obtained by SVD of the acoustic spectrum (Fig. 1) and each pdf was obtained with a KDE (kernel density estimation) and an Epanechnikov kernel. In the graphs, each point is the vocalization of an affect and the contour plots show the likelihood functions of the KDEs. The rendered arrows serve to enhance visualization; they have no statistical interpretation (in this paper). The numerical values of the components have no direct interpretability. The degree of overlap between two likelihood functions is expressed by confusion matrices (Table 1), one for each biological sex and a pair of vocalizations. In these two graphs, the
confusion matrix for the males is
%, and it is
% for the
54.6 45.4 12.1 87.9
57.4 42.6 24.1 75.9 females. In the cases shown here, there are no significant differences between the pairings of the vocalizations, neither for the males, nor for the females.
Dimension Reduction and Likelihood Function Estimations We therefore obtained, for each vocalization, a spectrum of probable identifications (Fig. 1); these probabilities were then entered in two matrices: a 15 × 25 one for the males and a 20 × 25 one for the females. We then used SVD (Singular Value Decomposition) to dimension-reduce the entries. For each affect, we obtain two sets of five 2D vectors (one for each male and, separately, one for each female). We then estimated the 2D distributions of the 5 points per sex for each affect using a KDE (kernel density estimation) with an Epanechnikov kernel and the Silverman rule for optimizing the kernel window. In total, we statistically analyzed five KDEmale and five KDEfemale for the five vocalizations per sex.
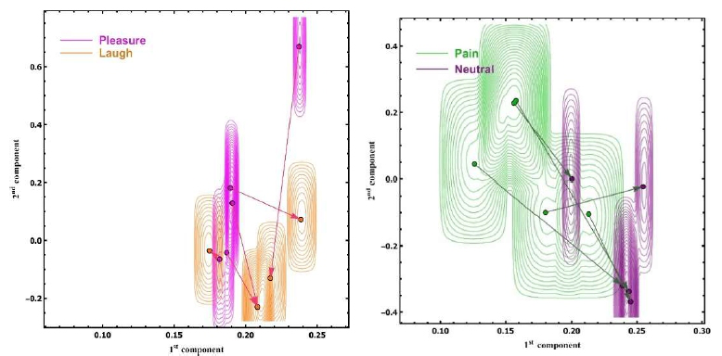
Figure 3: The contour plots of the pdf (probability density function) of the vocalizations of the affects “Pleasure” and “Laugh” by the males (left) and the affects “Pain” and “Neutral” by the females (right). The coordinates of the vocalizations were obtained by SVD of the acoustic spectrum (explained in the text) and each pdf was obtained with a KDE (kernel density estimation) and an Epanechnikov kernel. In the graphs, each point is the vocalization of an affect and the contour plots show the likelihood functions of the KDEs. The rendered arrows serve to enhance visualization; they have no statistical interpretation (in this paper). The numerical values of the components have no direct interpretability. The degree of overlap between two likelihood functions is expressed by confusion matrices (Table 1), one for each biological sex and a pair of vocalizations.
In these two graphs, the confusion matrix for the males is 98.3 1.7 2.6 97.4
% for the females. In the cases shown here, there are highly significant
%, and it is 92.3 7.7 2.0 98.0 differences between the pairings of the vocalizations, both for the males and for the females.
Confusion Matrices for Significance Testing We use the following implementation of a Monte Carlo method to test for a significant difference between KDEA and KDEB. For each of two likelihood functions (LA(s) = pdf(KDEA, s) and LB(s) = pdf(KDEB, s)),
Using an Artificial Neural Network Pre-Trained for a Different, Yet Comparable Task 171
RNG
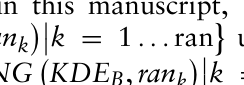
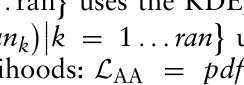
we use a pseudo-random number generator RNG to generate two sets of ran random numbers (in this manuscript, ran = 25000). One set ranA =
KDEA, rank
Equation reproduced from the original PDF.
uses the KDEA distribution, the other set ranB =
KDEB, rank
Equation reproduced from the original PDF.
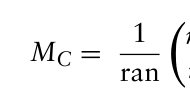
uses the KDEB distribution. We obtain four sets of likelihoods: LAA = pdf(KDEA, ranA), LAB = pdf(KDEB, ranA), LBA = pdf(KDEA, ranB), and LBB = pdf(KDEB, ranB). We calculate the confusion matrix MC:
nA|LAA>LAB nA|LAA<LAB
Equation reproduced from the original PDF.
nB|LBB<LBA nB|LBB>LBA
where the notation nA|LAA>LAB means: “the number of likelihoods when the likelihood of KDEA of a subset of ranA is greater than the likelihood of KDEB” — likewise the permutations for all other indices. If the off- diagonal elements of MC are both less than 10% (Caelen, 2017), then the two distributions KDEA and KDEB are significantly different at 5% significance level.
Table 1. The table of confusion matrices, as described in the text. If we assume a significance level of 10% (Caelen, 2017) for the off-diagonal elements (this significance level corresponds to 5% in conventional, frequentist significance level assessments), then five pairings are significantly different for the males (Pain↔Laugh, Pain↔Neutral, Pleasure↔Laugh, Pleasure↔Neutral, and Fear↔Neutral) and three pairings are significantly different for the females (Pain↔Neutral, Pleasure↔Neutral, and Fear↔Neutral). These significantly different pairings are highlighted in pastel orange. However, a close inspection shows that two further pairings for the females (Pleasure↔Laugh and Fear↔Laugh) are close to significantly different. The rows of all confusion matrices add up to 100%; if the displayed values do not, then the reason is due to rounding of the computed entries.
Table available in the original PDF paper.
Females
Pleasure Fear Laugh Neutral
Pain
57.4 42.6 24.1 75.9
62.1 37.9 23.9 76.1
87.3 12.7 14.2 85.8
92.3 7.7 2.0 98.0
Pleasure
68.2 31.8 33.7 66.3
92.9 7.1 12.9 87.1
98.3 1.7 1.14 98.9
Fear
92.1 7.9 13.9 86.1
96.9 3.1 1.2 98.8
Laugh
67.1 32.9 9.6 90.4
Males
Pain
54.6 45.4 12.1 87.9
58.1 42.0 36.0 64.0
91.9 8.1 3.9 96.1
100.0 0.0 0.0 100.0
Pleasure
85.6 14.4 46.8 53.2
98.3 1.7 2.6 97.4
100.0 0.0 0.0 100.0
Fear
81.1 18.9 11.4 88.6
92.6 7.4 0.0 100.0
Laugh
20.0 80.0 0.2 99.8
RESULTS
Comparison With the Neutral State All affect vocalizations of both males and females are remarkably different from the neutral vocalization (Table 1) with only one exception (“Laugh” versus “Neutral” for the males).
Comparisons of the Negative Affective States The results of comparisons of the vocalizations of the affective states suggest that they are not significantly distinguishable (Fig. 2).
Comparison of the Negative Affective States With the Positive Affective States Only one positive affective state vocalized — the sound of laughter — is significantly different from the negative affective state “Pain” for males, and almost significantly different for females. The vocalization of the positive state “Pleasure” is significantly different from “Laugh” for males, and, again, almost significantly different for females. We address these issues in the Discussion and Conclusion section.
DISCUSSION AND CONCLUSION Wolfram AudioIdentify Neural Net outputs probabilities for 632 classes. Since all vocalizations of affective states, together with “Neutral” total to 21 different identifications, we can consider this test of output quality is remarkably reliable (Bayesian test of categorical variables; Beta distribution Be(22, 612), p < 2.1 × 10−151; not shown).
This study is not only a “Proof of Concept”; we also present surprising findings.
We discover that, while humans are incapable of distinguishing vocalizations of affective states (Holz et al., 2021; Binter et al., 2023), we find that trained neural networks are not superior at distinguishing some of these vocalizations. Detractors from the reliance on neural networks would perhaps argue that the neural network is not specifically designed to deal with affective state vocalization classifications. We disagree; we challenge that view by observing that the probabilities of acoustic identifications are reliable (Fig. 1). Rather, as can be observed from the confusion matrices in Table 1 and the contour maps in Fig. 2 and Fig. 3, the small sample size is the shortcoming. We discover that some vocalizations are too varied. None the less, we find the contour plots are reliably interpretable; because they are highly varied; our claim that the small number of data-points is the shortcoming is supported. We conclude that the likelihood of a dedicated, ab novo designed neural network will have a superior performance is highly unlikely.
Even though the negative affective states are acoustically not distinguishable from one another, there is a clear distinction between any highly activated affective state and the neutral state. More importantly, there is a distinction between affective vocal displays of activities that are
Using an Artificial Neural Network Pre-Trained for a Different, Yet Comparable Task 173
considered illegal in the public arena versus those whose presentation are considered acceptable (“Neutral” and “Laughter”). Because the highly activated affective states (“Pain”, “Fear”, and “Pleasure”) are not acceptable in the public arena, our findings have an application. Consider a distress call in a public place; the neural network we have used can be used to automatically alert authorities and/or medical help personnel — despite the neural network’s inability (as well as the human’s hearing the same distress call) to distinguish pain from fear, say. We have shown that the significance levels in the confusion matrices are adequate for such applications (because they can distinguish between highly affective states and “Laugh” and “Neutral”) — despite the small sample sizes.
Furthermore, the outcomes of our analyses of the vocalization features provide insights that are valuable for ethologists and psychotherapists (when explaining why, for instance, false identifications are so prevalent). Our approach is novel, scalable and can be easily adapted to other comparable vocalization detection challenges and datasets. The costs are minimal in comparison with conventionally recommended ways of dealing with such situations — outlay for expensive hardware and then training a novel model and then fine-tuning it.
ACKNOWLEDGMENT
This project is funded by the Czech Science Foundation (Grant No. 19-12885Y “Behavioral and Psycho-Physiological Response on Ambivalent Visual and Auditory Stimuli Presentation”).
ETHICS STATEMENT This study is part of a set of projects and has been approved by Institutional Review Board of the Faculty of Science, Charles University, Prague (#2018/08).
REFERENCES
Binter, J., Boschetti, S., Hladký, T., & Prossinger, H. (2023). “ouch!” or “aah!”: Are Vocalizations of ‘laugh’, ‘neutral’, ‘fear’, ‘pain’, or ‘pleasure’ Reliably Rated? Human Ethology, 2023(38). Boschetti, S., Prossinger, H., Prossinger-Beck, V., Hladký, T., ˇRíha, D., & Binter, J.
(2023, July). Never Correct: The Novel Analysis of Differing Visual (Facial Expression) and Acoustic (Vocalization) Bimodal Displays of the Affective States “Pain”, “Pleasure”, and “Neutral”. In: International Conference on Human- Computer Interaction (pp. 141–150). Cham: Springer Nature Switzerland. Caelen, O. (2017). A Bayesian interpretation of the confusion matrix. Annals of Mathematics and Artificial Intelligence, 81(3), 429–450. Gkikas, S., Tachos, N. S., Andreadis, S., Pezoulas, V. C., Zaridis, D., Gkois, G.,... & Fotiadis, D. I. (2024). Multimodal automatic assessment of acute pain through facial videos and heart rate signals utilizing transformer-based architectures. Frontiers in Pain Research, 5, 1372814.
Holz, N., Larrouy-Maestri, P., & Poeppel, D. (2021). The paradoxical role of emotional intensity in the perception of vocal affect. Scientific Reports, 11(1), 1–10. Prossinger, H., Hladký, T., Boschetti, S., ˇRíha, D., & Binter, J. (2022) Determination
of “Neutral”–“Pain”, “Neutral”–“Pleasure”, and “Pleasure”–“Pain” Affective State Distances by Using AI Image Analysis of Facial Expressions. Technologies 10(4), 75. https://doi.org/10.3390/technologies10040075 Van Der Zant, T., & Nelson, N. L. (2021). Motion increases recognition of naturalistic postures but not facial expressions. Journal of Nonverbal Behavior, 45(4), 587–600. Yuan X., Zhang, S., Zhao C., He, X., Ouyang, B., & S. Yang, (2022) Pain
Intensity Recognition from Masked Facial Expressions using Swin-Transformer, IEEE International Conference on Robotics and Biomimetics (ROBIO), Jinghong, China, 2022, pp. 723–728. doi: 10.1109/ROBIO55434.2022.10011731.
LISTED IN THE AHFE DIGITAL BOOKSTORE CATALOGUE
Explore the complete digital volume
Human Interaction and Emerging Technologies (IHIET 2024)
Read this individual research paper free through the original publisher, or explore the full digital proceedings book.
ISBN 978-1-964867-33-5
Explore this ISBN in the AHFE Bookstore ↗Listed in the July 2026 bookstore catalogue; search by ISBN to confirm current availability · Digital book purchase optional