Waldemar Titov, Sebastian Knopf, Thomas Schlegel (2025). Optimized Visualization of Capacity Information in Public Transport Networks. In: Advances in Human Factors of Transportation. AHFE Open Access, vol. 186, pp. 189–198. https://doi.org/10.54941/ahfe1006508
1 Institute for Intelligent Interactive Ubiquitous Systems (IIIUS), Furtwangen University, Robert-Gerwig-Platz 1, Furtwangen im Schwarzwald, 78120, Germany ↗
2 Karlsruhe University of Applied Sciences, Moltkestrasse 30, Karlsruhe, 76133, Germany ↗
The utilization of public transport vehicles is of growing interest to transport companies and public transport authorities. Against the backdrop of the transport transition, a targeted increase in capacity is necessary in order to meet the expected increase in demand. Transport companies and their authorities are faced with the challenge of recording the utilization of individual journeys and entire networks and, if necessary, making adjustments where capacities are already reaching their limits. The data required for this is often collected with the help of automatic passenger counting systems. However, the visualization of this data is rarely adapted to the actual applications required. This project presents a user-centric approach for the optimized visualization of utilization information. To this end, user workflows and available data are first analyzed. Based on the information obtained, individual use cases and a prototype for visualizing the data are developed. A final evaluation of the prototype rounds off the work.
In service planning, it is decided how much capacity a trip must provide in order to meet demand. Until a few years ago, manual passenger counts were used as the basis for analyzing demand. These counts are now increasingly being carried out using automatic passenger counting systems (APCS). Above all, the use of APCSs enables almost flexible evaluation periods and conditions. For example, an APCS can be used to determine passenger demand specifically for the period of an event or a major disruption to operations so that a valid data basis can be used to plan services for similar events in the future. While the data basis is of high quality, there is often a lack of a suitable presentation of the data that is able to answer users’ questions in a targeted manner when planning services. Which journeys reach their capacity limits? On which sections is capacity utilization at its highest, and where is there still capacity available? What proportion of the traffic volume is covered by the use of additional trips? These three key questions are
representative of the issues that need to be constantly answered and evaluated in service planning. However, based on passenger numbers, which are often only available as a kind of timetable, it is hardly possible to answer these questions with an adequate amount of time.
Finally, to answer these questions, the entire table must be searched, classified and cataloged in at least the two dimensions of time and travel history. It is understood that this is an almost impossible task without technical aids, assuming that a complete transport network is to be analyzed in this way. This paper describes the development of a prototype based on visual analytics that can be used to answer these questions in a targeted manner. To this end, three use cases are first developed in expert interviews with users from the transportation industry. A sample data set is then analyzed with regard to its content and the possible answers to the three key questions. In the next step, the data is first analyzed automatically and then prepared visually in such a way that the key questions can be answered both by users who are familiar with the topic and by non-specialists. Any optimization achieved by the prototype is verified by a final evaluation based on both objective and subjective criteria.
RELATED WORK
The visualization of data for specialist audiences has the advantage that it can be geared towards their needs. At the same time, however, the desired visualization must also meet these needs. This chapter presents some related work that deals with the visualization of complex data. For capacity reasons, only those works that are relevant to this thesis will be discussed.
Tremel (2018) deals intensively with the visualization of multivariate, time- dependent data in her master’s thesis. With the help of various technologies from the field of visual analytics, Tremel discusses possibilities for visualizing network data using individual use cases. The use cases are narrowed down with the help of expert interviews. The main focus is on anomaly detection within the data sets. However, the master’s thesis is not exclusively concerned with presenting all network data, but only the information that is relevant for the targeted use cases. From this work, both the approach and in particular the approaches to anomaly detection are relevant for this thesis.
In line with this, Hoffmann (2011) evaluates the visualization technique of semantic zooming in detail in his diploma thesis. Semantic zooming involves categorizing and attributing data and offering users the option of filtering the data based on these categories and attributes. In this case, zooming is carried out by selecting individual categories and attributes one after the other. With the selected comparison technology, filtering according to knowledge- based attributes (cf. Hoffmann, 2011, 25 f.), data is filtered according to predefined attributes in order to be able to make statements from them. The main difference is that the users already have sufficient specialist knowledge to classify the data based on these attributes. Hoffmann compares both approaches as part of an evaluation and comes to the conclusion that users can make statements about data more quickly with the help of semantic zooming as part of a visualization than with the comparison technology. This
Optimized Visualization of Capacity Information in Public Transport Networks 191
evaluation is relevant for the present work insofar as the conclusions drawn from it can be incorporated into the prototype.
AVAILIBLE DATA Passenger demand data collected using APCSs is stored in electronic, usually machine-readable formats such as CSV. However, the exact format always depends on the manufacturer of the APCS used. For this study, Verkehrsbetriebe Karlsruhe (VBK) kindly provided demand data from November 2021 for all streetcar lines. This chapter explains the framework conditions under which the data was collected, as well as the content and aggregation of this data.
Framework Conditions for Data Collection Demand data is always collected by VBK using APCS. For this purpose, vehicles are equipped with special counting sensors in the door area, which determine the number of passengers boarding and alighting. These key figures are referred to below as boarding and alighting passengers. The balance between passengers boarding and alighting is also used to determine the current passenger occupancy. The counting data is automatically transferred from the vehicles to the background system at the end of the operating day. Incorrect data and journeys that no longer meet the quality criteria are filtered out here. These can be, for example, journeys that were so late that they have already run in the following cycle. Journeys for which a part has been canceled or rerouted are also sorted out. The data is then available for further processing within various evaluations. However, the results of these evaluations are only output in the form of a type of timetable table. The difference to a normal timetable table is that this table contains the boarding and alighting figures for each journey instead of journey times. For further understanding, it is important to know that not every VBK vehicle has corresponding counting sensors. Conversely, this means that it cannot be guaranteed that every specific timetable journey was counted once in the selected evaluation period. The smaller the evaluation period selected, the more likely this is. In the case of VBK, the data is therefore calculated retrospectively from journeys that were carried out under similar conditions. Criteria for the selection of suitable journeys are, for example, the route, direction, time window and journey time profile. This statistical procedure is also known as imputation. A serious disadvantage of imputation is that after the calculation, the data is no longer available on a daily basis, but only aggregated for the entire, previously defined evaluation period. However, as this is precisely what is relevant for this study, imputation is not used and the data is taken over without imputation, but with a large amount of additional information such as vehicle capacity and number of vehicles. The data is tapped on a daily basis and only aggregated when necessary. Only journeys that were not counted over the entire period of the data cannot be added by the prototype without further ado. As the core of this work revolves around the visualization of the data obtained, the missing journeys will not be imputed in the course of this project.
Information Contained The data set provided by VBK contains all counting data of sufficient quality for the period between 01.11.2021 and 30.11.2021. The data is available as a CSV file for each operating day and is first transferred to a SQLite database for further processing.
This contains the journeys with their individual stops, the passenger numbers, the number of vehicles used and their capacity line by line. In detail, the dataset contained the following information: date, route, direction, start_time, stop_index, arrival_time, departure_time, stop_id, stop_code, num_psg_board, num_psg_alight, num_psg_occupation, num_vehicles and capacity.
As there is no unique key for individual journeys, in practice these are always referenced via the route, direction of travel and departure time. This composite key is referred to as the trip key in the rest of the paper. In addition to the passenger numbers consisting of passengers boarding and alighting and the number of passengers at the respective stop, the number of vehicles used and their capacity are also of great interest. While the latter allows a statement to be made about the relative degree of utilization, the number of vehicles used shows whether or not a trip can be increased by adding more vehicles. The relative degree of capacity utilization is of greater interest than the absolute representation because the absolute degree of capacity utilization does not allow any statement to be made about how “full” a trip actually is without additional knowledge.
Additional Data Required In order to be able to display the capacity utilization data georeferenced on a map at a later date, additional data is required that is not contained in the VBK capacity utilization data. This applies in particular to the names and GPS positions and the identification numbers of the individual stops referenced in the utilization data. These can be obtained from open timetable data, which the Karlsruher Verkehrsverbund (KVV) makes available on its website under an open source license in GTFS format. Within this GTFS feed, the stops are divided hierarchically into stop areas and platforms and referenced via the Germany-wide stop ID (DHID). The DHID contains a country code separated by colons, a so-called municipality code, the actual stop ID and the platform number. Only by adding the first two properties mentioned above does the stop ID become a unique identification number for the Federal Republic of Germany. Only the stop ID is referenced in the VBK utilization data. Therefore, these stop IDs are first extracted from the timetable data together with the name and GPS position of the stop. In the next step, any duplicates created by truncating the stop number are removed and the remaining data record is imported into a SQLite database.
METHODOLOGY
The requirements analysis provides the basis for implementing the prototype. This chapter will first explain the basic points of the concept and then go into important details of the implementation of the prototype. The prototype
Optimized Visualization of Capacity Information in Public Transport Networks 193
should be developed as a web application and designed for desktop screens. The user interface should be divided into three main elements. All possible and necessary filters should be displayed in a sidebar on the left-hand side. In the main area to the right of the sidebar, both the journey table and the map view should be arranged underneath.
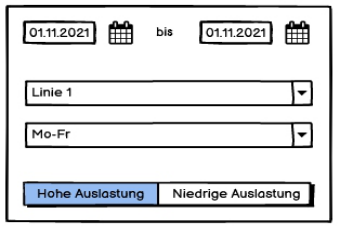
The filter is organized in two levels. Global parameters such as the date range, the day types and the line to be viewed are arranged in the sidebar. Instead of the manual entry of capacity limits by users, the prototype uses a highly simplified, semantic zoom procedure to identify journeys whose relative capacity is either greater than 40% or less than 10%. The upper limit is set in this way because the specified capacity usually includes standing room, but passengers already perceive a vehicle as “full” when there are no more seats available (cf. Hell, 2006, p. 140). Otherwise, users would have an influence on the definition through their subjective perception, as some may already assume a high occupancy rate at 50%, while for other users this may only be reached at 75%. This could result in serious differences in the interpretation of the data. In the second filter level, individual journeys can be selected from the table in order to restrict the map view to one of these journeys. Figure 1 shows the filter area as a wireframe.
Figure 1: UI design of the filter area.
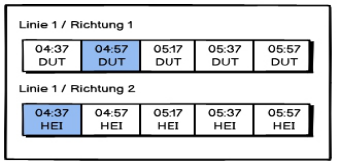
The journey table shows all the journeys on the selected line in chronological order and sorted by direction. For each journey, the start time and the abbreviation of the start and destination stops are shown. Journeys that meet the selected occupancy criterion are highlighted in color. Trips that do not meet the selected criteria are greyed out. Figure 2 shows a wireframe view of the journey table.
Figure 2: UI concept of the journey table.
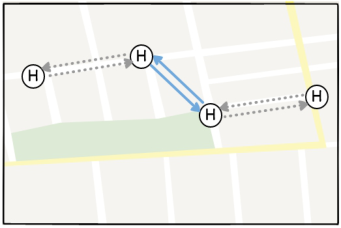
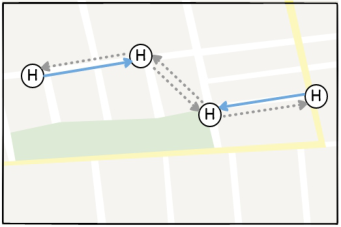
In the map view below the journey table, the capacity utilization data of the journeys that correspond to the selected capacity utilization level are displayed as connecting lines per direction between the stops served. Like the journeys in the journey table, the connecting lines that exceed or fall below the selected load factor are highlighted both in color and by their display. Figures 3 and 4 show the map view as a wireframe.
Figure 3 shows a journey in which the degree of utilization in both directions between the two middle stops reaches the selected limit value equally. This representation corresponds to a line running on a typical main axis. For a better understanding, Figure 4 shows an opposite representation in which the degree of utilization differs for each direction and section. This is how a feeder line could look on the map.
Figure 3: UI concept of map view (Ex.I).Figure 4: UI concept of map view (Ex.II).
Visualization plays a central role in the prototype. The aim is to establish a correlation between the psychological perception of the visualization and the content of the data conveyed. Mackinlay (1986) describes proven principles for information visualization in his paper. The aim of information visualization is to present data and their relationships through appropriate transformation. This must be differentiated from visual analytics, which not only aims to present transformed data, but also combines visualization with statistical methods to generate knowledge (Tremel, 2018, p. 22). In this work, the calculation and classification and finally the visualization of the degree of utilization are representative of the generation of new knowledge from the existing data. The degree of utilization is first calculated from the staffing
Optimized Visualization of Capacity Information in Public Transport Networks 195
and the available capacity as a relative value and then classified into the levels high, medium and low. As already explained in the interaction concept, the classification is based on the subjective perception of the passengers. The visualization is carried out in relation to space and time. The temporal reference is shown horizontally in the trip table. In this table, all journeys that correspond to the selected classification are highlighted. The analogy to a timetable table makes it easy for users with the necessary specialist knowledge to recognize the relationship between capacity and time. This representation is thus similar to Mackinlay’s frequency analysis (1986, p. 120). The relationship to the geographical area is conveniently established in the map view. Instead of displaying the capacity utilization in the course of the journey in a timetable table, the geographical location of stops is used as a property for visualization. The capacity utilization is displayed directly in the context of so-called points of interest (POI). This is intended to create further added value for users, as there is no need for subsequent classification in the context and POIs. In this way, users should be able to put the utilization information obtained in relation to external influences, events and frequented contact points.
Implementation The prototype is developed as a web-based desktop application based on the PHP framework Slim, the CSS framework W3.CSS, the JavaScript framework jQuery and the object-relation mapper (ORM) LessQL. A highly simplified, non-object-oriented approach was chosen for the development, with a stronger focus on presentation and functionality. The utilization data and stop data were each imported into an SQLite database in order to enable efficient querying of even large amounts of data. Simple queries are carried out with the help of LessQL, 7 more complex queries, especially those for aggregating data, are carried out directly in the database in order to have full control over the SQL query used. All calculations and aggregations are performed on the server side, while the information is displayed on the client side. The exchange between server and client takes place via a JSON interface whenever filter parameters are changed. The JSON interface can be used to query the journeys with sections that match the filter criteria with their maximum degree of utilization.
To aggregate the trip data, the trip key, the code of the starting stop, the maximum counted occupancy, the average number of vehicles and the average capacity are loaded from the database. The maximum counted occupancy is used because the degree of utilization is considered to be achieved if a trip meets the criterion on at least one section. The latter two key figures, on the other hand, are assessed based on their arithmetic mean. Alternatively, the median could also have been used here, as it indicates which values the two key figures assume for most of the journeys made. However, as the median only differs significantly from the arithmetic mean if there are large upward or downward outliers in the data and the arithmetic mean is implemented as an aggregate function in SQLite, it is used as a substitute for the average calculation. As half vehicles cannot be used for physical reasons,
a decimal point in the aggregated number of vehicles also indicates that the actual number of vehicles used varies during operation. Similarly, decimal numbers in the aggregated capacity indicate that the vehicle sizes deployed vary during operation. The query is limited by the desired date range, day type and line. The result of this query is a list of all counted journeys containing all the necessary information from which the degree of utilization is calculated on the server side. The results are saved in an array and stored temporarily.
As there is only data for one departure at one stop per line, the query for aggregating the capacity utilization on journey sections is more complex. In addition, this data should only contain utilization information for those journeys that correspond to the classification selected in the filter. These conditions make more extensive server-side calculations necessary. As a basis, all data is selected from the database that meets the criteria of date range, day type and line. It is then iterated over the query result and the utilization data is saved in a multidimensional array if the trip key was marked in the previous result due to a utilization limit being reached. In addition, the GPS positions and names of the stops are reloaded from the other data. The array then contains a source-destination matrix and behind each source-destination relation the relative degree of utilization as the arithmetic mean of the degrees of utilization of all journeys on the respective section. Both arrays are made available to the client side via the JSON interface in order to display the data obtained in the user interface.
EVALUATION As part of the evaluation, the quality is examined with regard to possible optimization and possible improvements to the prototype. To this end, the people involved in the evaluation were given three tasks to answer using both the conventional method based on Excel tables and as a comparison with the prototype. As with the requirements analysis, expert interviews were also conducted in order to identify potential for improvement. The results of the objective and subjective evaluation are presented in this chapter.
Evaluation With Use Cases In the objective evaluation, six users who were already involved in the requirements analysis were assigned three tasks that largely correspond to their actual context of use. The tasks were as follows:
A. Identify all journeys on Line 1 from Monday to Friday where capacity bottlenecks may occur! B. Determine the time slots in which journeys could possibly be saved on line 3 on Saturdays! C. Determine the sections, which are most in demand for journeys on line 1 on Saturdays with normal capacity utilization!
The processing time required to complete these tasks was measured. The following table shows the average processing time of the conventional method based on excel tables (E) and with the aid of the prototype (P).
Optimized Visualization of Capacity Information in Public Transport Networks 197
Table 1: Average processing time in comparison.
Table available in the original PDF paper.
Task E P Task A 64,47 s 22,31 s Task B 52,11 s 18,52 s Task C 40,21 s 9,08 s
There were clear differences for time taken to complete the task depending on the Excel skills of the people involved. While most users first applied conditional formatting to the data, for example to identify outliers in the data and to heat map sections, there were still two users who examined the data by looking at the numerical values and answered the questions in this way. Overall, all three tasks showed improvements in processing time compared to the conventional method. Task C in particular showed significant improvements, probably because the data could be accessed at a glance rather than having to look at the whole Excel spreadsheet and then compare it.
In addition, users’ errors were counted when completing the tasks. Errors were considered when users came to incorrect conclusions based on their approach. However, errors in the use of Excel or the prototype were not counted in this case. The following table shows the average number of errors differentiated by conventional method (C) and prototype (P).
Table 2: Average number of errors in comparison.
Table available in the original PDF paper.
Task C P Task A 1 0 Task B 2 1 Task C 3 0
Differences can also be seen with regard to the error rate, although not as clearly as with regard to the processing time. This is primarily due to the expertise of the users involved. As the users are used to working with the conventional method, they have developed their own workarounds to answer questions similar to those from the evaluation. Some of the errors counted can also be attributed to misinterpretations of the tasks, which then led to incorrect conclusions. Overall, the error rate when working with the prototype is lower than when working with Excel spreadsheets.
CONCLUSION AND DISCUSSION The prototype developed as part of this work offers benefit for users compared with tried-and-tested methods, particularly in terms of processing time and the recording of complex data volumes and their relationships. The evaluation has shown that the approach based on visual analytics is effective and holds potential for further research in this area. For example, the presentation of further demand data would be desirable, particularly with regard to weather, events and major events, in order to be able to make long-term forecasts. In addition to the requests for improvements already
identified during the evaluation, two further points became known during the development process that will provide further material for discussion.
One of these is the data basis itself, as it can always happen that individual journeys are missing from the utilization data because they were never counted in the selected period. This applies in particular when very short evaluation periods are selected. We explained the imputation procedure used in the VBK’s upstream evaluation software. In order to avoid missing individual journeys in the prototype, these would theoretically have to be imputed after every change in the filter. In terms of performance in particular, this could lead to longer waiting times and thus a loss of quality for users. Alternatively, further research into an alternative procedure that can be used within a short period instead of imputation would also be conceivable.
On the other hand, it was noticed during the evaluation that the aggregation methods implemented in the prototype sometimes lead to inconsistencies. This applies in particular to the aggregation of the number of vehicles and the capacity. Although the core statement does not change statistically if the median is used instead of the arithmetic mean, the presentation and conformity with expectations on the part of the users is positively influenced. A similar problem arises when aggregating the data for the trip table. The occupancy rate is always calculated based on the maximum occupancy counted within the evaluation period. However, in rare cases, due to external factors, a trip may be very busy on a single operating day, but only moderately busy on all other operating days. Using the arithmetic mean of the occupancy at a stop within a specific trip instead of the maximum would avoid possible misinterpretation by the system.
ACKNOWLEDGMENT
The authors would like to acknowledge the Karlsruhe public transport company (VBK and KVV) for providing the valuable dataset.
REFERENCES
Hell, W. (Ed.). (2006). Öffentlicher Personennahverkehr: Herausforderungen und Chancen. Springer Science & Business Media. Hoffmann, S. (2011). Empirical evaluation of a visualization technique with semantic
zoom (Doctoral dissertation, Technische Universität Wien). Mackinlay, J. (1986). Automating the design of graphical presentations of relational information. ACM Transactions On Graphics (Tog), 5(2), 110–141. Tremel, T. (2018). Visuelle Analyse von Netzwerkverkehr in Unternehmensnetzen
(Master’s thesis).
LISTED IN THE AHFE DIGITAL BOOKSTORE CATALOGUE
Explore the complete digital volume
Advances in Human Factors of Transportation
Read this individual research paper free through the original publisher, or explore the full digital proceedings book.
ISBN 978-1-964867-62-5
Explore this ISBN in the AHFE Bookstore ↗Listed in the July 2026 bookstore catalogue; search by ISBN to confirm current availability · Digital book purchase optional