Waldemar Titov, Thomas Schlegel (2026). Beyond Ridership Counts: What Trip Requests Reveal About Urban Mobility. In: Intelligent Human Systems Integration (IHSI 2026): Disruptive and Innovative Technologies. AHFE Open Access, vol. 200, pp. 746–754. https://doi.org/10.54941/ahfe1007133
Institute for Intelligent Interactive Ubiquitous System (IIIUS), Furtwangen University, Robert-Gerwig-Platz 1, 78120 Furtwangen im Schwarzwald, Germany ↗
Using data provided by public transport associations, new opportunities arise today to investigate passenger demand and user behavior in public transport. Of particular interest is information about the locations and times at which passengers use – or would like to use – public transport services. By analyzing the requests submitted to the electronic timetable information system (EFA), conclusions can be drawn regarding passenger demand and user behavior. Although electronically submitted requests represent only a portion of actual users, they can serve as an indicator for real passenger demand. In this paper, a methodology is developed for analyzing EFA request statistics and comparing them with real passenger volumes. The aim is to assess the informative value of the request data and to carry out an exemplary analysis and interpretation of these data.
To collect actual passenger numbers, vehicles in public transport are equipped with automatic passenger counting systems that record boardings and alightings at each stop. Based on EFA request statistics and supplementary passenger count data, this paper develops a concept for evaluating request data and assessing their informative value. In addition, the two data sets are used to illustrate which questions regarding passenger demand and user behavior can be investigated.
By evaluating the request statistics, the informative value of the data is assessed. A key question is how many passengers submit a request before travelling. Comparing the number of EFA requests with the passenger statistics yields a quotient (requests/passengers). The assumption is that the smaller the difference between requests and passengers, the greater the share of passengers who submit a request before starting their journey. Thus, the smaller the difference, the more informative the request data. Conceptually, the evaluation is performed based on the count data and an extrapolation of passenger numbers.
The evaluation is important for subsequent analyses. In principle, all request data can serve as an indicator of actual passenger demand, including data sets with a very large difference between counts and requests (Colpaert et al., 2016).
Beyond Ridership Counts: What Trip Requests Reveal 747 However, without first assessing the quality of the request data, it is difficult to derive reliable conclusions. By comparing and jointly analyzing request and count data, the quality of the data – and thus the quality of study results – can be improved (Nahverkehrsplan Berlin, 2019–2023).
EVALUATION OF THE REQUEST STATISTICS The following evaluation concept was developed with the goal of conducting the most accurate and representative assessment of the request data possible. Depending on which data can be obtained from the public transport association, different approaches are suitable. In this case, EFA request statistics from the Karlsruhe Transport Association (KVV) from 31 December 2018 to 10 November 2019 are available. The data include Trip Requests (TR) corresponding to timetable or journey enquiries. Besides various search options, a departure stop, a destination stop, and a departure or arrival time are specified.
In addition to trip requests, Departure Monitor requests (DM) could also be considered. These are departure monitor queries which, in contrast to TRs, specify only a departure stop. However, the number of DMs is comparatively high, and the large amount of such requests appears implausible. One possible explanation is that, in addition to EFA queries from public transport users, queries from other sources (e.g., public displays in restaurants) are also included in the data. Because of these uncertainties, DM requests are not considered further here.
To assess the TR request data, they must be compared with actual passenger demand. Given the available data, the evaluation is carried out using three different methods: (1) based on count data, (2) using an average calculation, and (3) by extrapolation. Each of the three approaches has advantages and disadvantages, and their results are then compared and evaluated.
Evaluation Based on Count Data In the first evaluation method, the request data are compared with actual passenger figures. For this purpose, count data for tram line STR 1 for 22 and 23 January 2019 are used. For each vehicle, the data indicate how many passengers boarded and alighted at each stop. When selecting and analyzing the data, inconsistencies and limitations in the data sets must be taken into account to maintain the integrity of the evaluation.
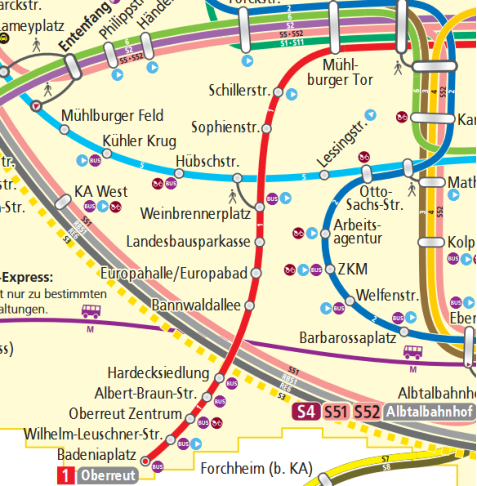
The count data for line STR 1 were requested specifically because this line has a particular alignment with several stops where there is no direct transfer to other lines or buses. If the evaluation is restricted to such stops without transfer options, the risk of error is reduced, because a connection requested for one of these stops is unlikely to be made using a different line. As shown in Figure 1 the six stops:
Badeniaplatz,
Bannwaldallee,
Europahalle/Europabad,
Landesbausparkasse,
Sophienstraße and
Schillerstraße were identified for which request and count data are compared. The stop “Badeniaplatz” does have an alternative bus connection, which was overlooked in the evaluation.
The count data contain the numbers of boardings and alightings as well as vehicle load for each stop. By comparing the number of boardings with the number of requests per stop, it is possible to determine how many requests correspond to how many passengers. Due to the file sizes of both the request and the count data, database systems are suitable for the evaluation; in this case, Microsoft Access was used. The data had to be cleaned, corrected, and formatted before queries could be executed, for example by ensuring that dates match the analysis period and by converting date and time columns in both data sets into a common format.
Figure 1: Excerpt from route map [KVV, 2019].
The count data for line STR 1 (22 and 23 January) had to be extrapolated because only three of the nine vehicles were represented and, for some vehicles, data were collected for only half of the train set. On the two days considered, a total of 115 TR requests were recorded at the six stops, whereas (after extrapolation) 8,592 passengers boarded line 1. This corresponds to around 1.3%: for every 1,000 boarding passengers, there are about 13 requests. This suggests that roughly 1.3% of passengers submitted a request before starting their journey.
Beyond Ridership Counts: What Trip Requests Reveal 749 Evaluation Based on the Average Calculation
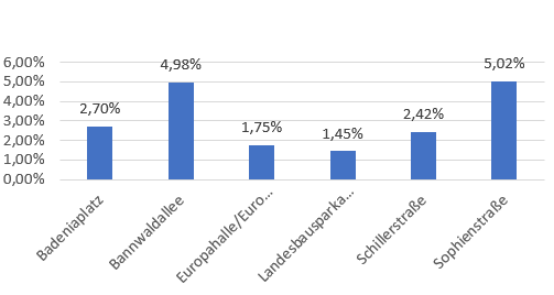
The average calculation is based on count data for line STR 1 over roughly half a year (12 December 2018 to 20 May 2019) and represents passenger demand on weekdays (Monday–Thursday). As with the count data, the average calculation includes load, boardings, and alightings for each stop shown in Figure 2.
In the period from 31 December 2018 to 20 May 2019, there were a total of 14,449 requests at the six considered stops. Since the average calculation only covers values from Monday to Thursday, requests from Friday to Sunday must be excluded. Without Friday, Saturday, and Sunday, the number of requests shrinks to 8,476, which is about 105 requests per day. In the entire analysis period, an average of 3,847 boardings per day were counted, so that on average 2.72% of passengers submitted a request.
Figure 2: Average ratio requests and boardings.
Evaluation by Extrapolation To make the evaluation more representative, the entire public transport network is considered. All requests are extrapolated to one year and compared with the annual passenger figures taken from the KVV annual report. KVV reported around 166 million passengers for 2018 (KVV 2018). A query of the TR requests showed that between 1 January 2019 and 30 June 2019, a total of 3,159,071 requests were submitted. Extrapolated to the full year, this results in 6,318,142 TR requests per year. In the same period there were also 55,342,152 DM requests, which corresponds to 110,684,302 DM requests when extrapolated to a full year. On this basis, the following ratios are obtained:
TR requests / passengers per year ≈ 3.8%
DM requests / passengers per year ≈ 66.7%
All requests / passengers per year ≈ 70.5% According to this extrapolation, there are on average around 3.8 TR requests and 66.7 DM requests for every 100 passengers. Overall, more than two-thirds of all trips would thus be represented in the request statistics.
All three approaches provide a quotient that can be used to assess the informative value of the data. In this case, the results range from 1.3% (count data) to 2.7% (average calculation) and 3.8% (extrapolation). The count- data method in principle offers accurate results because it relies on detailed passenger counts; however, only a small data set was available, and it had to be extrapolated, which reduces accuracy and representativeness. The average calculation circumvents this temporal limitation by using values averaged over a longer period, so seasonal or other fluctuations can be smoothed.
The extrapolation method has no temporal or spatial restrictions, as the data are extrapolated to a full year and all requests in the network are considered. The result is therefore representative for the entire transport association but is not based on a solid counting foundation; a certain inaccuracy must be assumed. Moreover, the request data may include relations outside the KVV network that are not reflected in the association’s annual passenger figures.
Each method therefore has strengths and weaknesses. Depending on the type and quantity of data available, the methods are more or less suitable for evaluating request data. Because none of the three methods yields both precise and fully representative results for the whole network, it can only be concluded that the requests represent between about 1.3 and 3.8% of passengers – on average approximately 2.6%. It can be expected that this quotient varies depending on stop or line and analysis period. If request and count data cover a longer period and multiple lines or stops, more precise and representative results can be calculated.
USER GROUPS AND PERSONAS The personas defined in this section are fictitious individuals representing user segments of public transport. They were developed based on the user groups of the SmartMMI project (Keller, 2018). All personas are public transport users, but they differ in age, occupation, leisure activities, knowledge of the area and system, affinity for technology, and possession of a smartphone. On the basis of these criteria, user segments are defined. It is assumed that the personas differ in their request behavior due to these characteristics.
Owning a smartphone is an important prerequisite for submitting requests, since most requests are assumed to be made via mobile applications on smartphones or tablets. Public transport users who do not own a smartphone appear in the count data but are likely to have submitted fewer requests. It is also conceivable that users own a smartphone but still do not submit requests if they lack technological affinity and prefer printed timetables. Age is another criterion: the older a user is, the less frequently he or she typically submits electronic requests (Fritzen et al. 2017). Among retirees it is likely still common to obtain timetable information in a traditional way.
Occupation is also important. A working person with a highly routine pattern of use (for example, commuting with the same train at the same time every day) is less likely to submit requests and will simply go to the stop as usual. On the other hand, punctuality is very important for such users, so they may use requests more frequently to obtain information on delays
Beyond Ridership Counts: What Trip Requests Reveal 751 or cancellations when they absolutely must arrive on time. For students or non-working people, it is assumed that they submit requests more frequently, especially when travelling at unusual times or to unfamiliar places and therefore needing a journey planner. Poor knowledge of the area and/or system may also be a reason for submitting requests.
Persona 1: Kevin Ziegler – Student/Everyday User Kevin is 21 years old and lives in Karlsruhe. He is a student with a part- time job and has a high affinity for technology. Because he has only recently moved to Karlsruhe, his knowledge of the area is still limited, and his system knowledge is average. He owns a smartphone and a semester ticket and uses public transport every day to get to university and work as well as for leisure activities. He therefore submits EFA requests frequently, especially when travelling to unfamiliar destinations or at unusual times.
Persona 2: Michael Baumann – Commuter Michael is a 50-year-old management consultant who attaches great importance to punctuality. He lives in Karlsruhe, has good knowledge of the area and system, and uses public transport daily for commuting with a monthly mobile phone ticket. His technological affinity is medium. He submits requests mainly to check for delays or disruptions on his usual route, especially when he has important appointments.
Persona 3: Hildegard Krause – Occasional User Hildegard is a 69-year-old retiree who has lived in Durlach for many years and knows Karlsruhe well. She does not own a smartphone and has little affinity for technology. She uses public transport only occasionally for small errands or trips to the city centre and normally does not submit electronic requests. She represents a user group that appears in passenger counts but hardly in request statistics.
In addition to the different characteristics of the personas, trip purposes can also be used for interpretation. According to the MiD 2017 survey, there are seven main motives for mobility. In Germany, 16% of all trips are work-related, 11% have a business purpose, and a further 7% are related to education. Shopping and errands account for about 30% and leisure activities for about 28% of trips; the remaining 8% are escort trips where the purpose is accompanying someone (MiD, 2018). Since trip purposes change over the course of the day and week, they can be used to analyze user behavior and identify user segments.
ANALYSIS AND EVALUATION In the following section, it is examined whether the count data reflect the expected fluctuations in demand and how the request behavior of public transport users changes over time. Short-term, medium-term, and long-term
752 Titov and Schlegel fluctuations are considered and interpreted using the previously defined personas and trip purposes.
Fluctuations in Passenger Demand and Requests Passenger demand in public transport fluctuates over the course of a day, within a week, and over the year. Intra-day fluctuations can often be attributed to different trip purposes. When many trips with the same purpose occur at a similar time, demand peaks arise (Kittler, 2010). Weekly fluctuations can be interpreted similarly, while seasonal fluctuations associated with changing weather conditions can cause variations in demand over months or across the year.
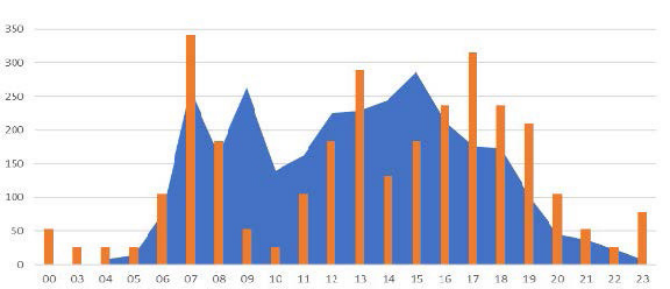
Short-term fluctuations were examined by comparing the temporal distribution of requests with the count data for the two January days. Clear peaks in passenger demand occur in the morning and afternoon. Demand is lowest at night. When the requests are scaled such that, on average, 3.8% of passengers submit a TR request, the temporal patterns of requests and passenger demand broadly correlate: a morning peak, a midday rise, an afternoon peak, and a decline in the evening. Individual requests still occur at night, even when there are no corresponding boardings in the count data.
Medium-term fluctuations were analyzed by examining request data from 31 December 2018 to 20 May 2019. TR requests vary across the week: roughly similar numbers are submitted on Mondays and Thursdays, slightly fewer on Tuesdays and Wednesdays, most on Fridays, and the fewest at weekends. Long-term fluctuations were analyzed using monthly aggregates. The number of requests is highest in January and decreases towards spring. A pronounced drop in February is particularly noticeable, which may be related to exam periods and semester breaks at local universities as well as school holidays.
Interpretation of Fluctuations Using Personas The fluctuations in requests and demand can be interpreted using the personas and trip purposes. In the morning peak between 7 and 9 a.m., work-, business-, and education-related trips likely dominate. Personas such as the student and the commuter represent typical users at this time. Many of these users depend on punctual arrival, so they are more likely to submit requests to check their connections and possible delays. This explains why the ratio of requests to passengers is comparatively high in the morning.
As shown in Figure 3 between about 9 and 11 a.m., the number of requests decreases, while passenger demand declines only slightly. Trip purposes such as shopping, errands, and leisure dominate, and user groups such as retirees and non-working adults are more strongly represented. These users tend to submit fewer electronic requests, which explains the relatively low share of requests in this time window.
At lunchtime and in the afternoon, demand rises again, driven by school trips, work-related trips, and leisure activities. In the afternoon peak, the ratio of requests to passengers is lower than in the morning, as many users travel home and are under less time pressure. In the late afternoon and evening,
Beyond Ridership Counts: What Trip Requests Reveal 753 the number of requests increases again, primarily due to leisure trips where departure times and destinations are less familiar. Younger user segments, which have a higher affinity for technology, are still mobile at these times and submit above-average numbers of requests.
Figure 3: Extrapolated trip requests and passenger demand throughout the day.
The decrease in the number of requests towards spring can partly be explained by seasonal effects: as temperatures rise, some trips shift from public transport to walking or cycling, particularly among younger and more active users. In addition, the exam periods and semester break at universities, as well as school holidays, reduce education-related trips. Because these user groups submit a comparatively high number of requests, fluctuations in their travel behavior are particularly clearly reflected in the request statistics.
SUMMARY AND CONCLUSION This paper developed a concept for evaluating request data in public transport and carried out an exemplary analysis of EFA request statistics for the Karlsruhe Transport Association. The aim of the evaluation was to assess the informative value of the request data by comparing Trip Requests to counted boardings. Depending on the calculation method used, values between around 1.3% and 3.8% were obtained for the share of passengers who submit a request before travelling.
To obtain precise and representative results for an entire network, both count and request data must be available for a larger temporal and spatial extent. Nevertheless, the analyses showed that request data can be used to investigate fluctuations in passenger demand and user behavior. By visualizing and interpreting the data over the course of the day, week, and month, demand and request fluctuations could be explained using user segments represented by personas.
Explanations derived solely from request data should, however, be treated with caution. In particular, medium- and long-term developments in the request curve can only be interpreted as indicators of passenger demand as long as no additional data on actual capacity utilization are considered. In combination with further data sets, request statistics offer a promising
754 Titov and Schlegel basis for answering a wide range of questions in public transport planning and operation, such as the spatial distribution of demand or the evaluation of service changes.
ACKNOWLEDGMENT
The authors would like to thank Rafael Oehme for the valuable contribution to the project. This work was partially supported by the European Regional Development Fund (ERDF) in Baden Wuerttemberg in the research project regioKArgoTramTrain (Funding ID: RegioInn-24577775) and by the German Federal Ministry of Transport and Digital Infrastructure as part of the mFund initiative (Funding ID: 19F2042A) in the research project “Smart- MMI- model- and context-based mobility information on smart public displays and mobile devices in public transport”.
REFERENCES
Colpaert, P., Chua, A., Verborgh, R., Mannens, E., Van de Walle, R., & Vande Moere, A. (2016, April). What public transit API logs tell us about travel flows. In Proceedings of the 25th International Conference Companion on World Wide Web (pp. 873-878). https://dl.acm.org/doi/10.1145/2872518.2891069 Fritzen, L., Buss, K., & Böshans, M. (2017). Empirische Untersuchung zur
Nutzung von Verkehrs-Apps in der Region Trier. Verkehrsmittelwahl im ÖPNV, 96. Available online: https://www.uni-trier.de/fileadmin/fb4/prof/BWL/FIN/ Verkehrsmittelwahl_im_O%CC%88PNV_3.pdf#page=102 (accessed on 22 November 2025). Keller, C.; Titov, W.; Schlegel, T. (2018). SmartMMI Analyseergebnisse Modellund Kontextbasierte Mobilitätsinformationen auf Smart Public Displays und Mobilgeräten im Öffentlichen Personenverkehr; IUMS: Hochschule Karlsruhe, Germany, 2018. Available online: https://data.iiiusnc.de/index.php/s/ ffSksjBXyxydPwT (accessed on 22 November 2025). Kittler, W. (2010). Beeinflussung der Zeitwahl von ÖPNV-Nutzern (Doctoral
dissertation). Available online: 10.26083/tuprints-00002261 (accessed on 22 November 2025). KVV Karlsruher Verkehrsverbud GmbH (2019). Route Map. Available online: https://www.kvv.de/liniennetz/schiene.html (accessed on 22 November 2025). KVV Karlsruher Verkehrsverbund GmbH (2018). KVV Annual Report 2018.
Available online: https://www.kvv.de/fileadmin/user_upload/kvv/Dateien/ Unternehmen/KVV-Verbundbericht_2018.pdf (accessed on 22 November 2025). MiD (2018). “Mobilität in Deutschland 2017 – Ergebnisbericht.” First edition, Bonn, December. Available online: https://www.bmvi.de/SharedDocs/DE/Anlage/G/mid- ergebnisbericht.pdf?__blob=publicationFile (accessed on 22 November 2025). State of Berlin (2019). “Nahverkehrsplan Berlin 2019–2023.” Senate Department
for the Environment, Transport and Climate Protection, Division IV Transport. Available online: https://d-nb.info/131697507X/34 (accessed on 22 November 2025).
LISTED IN THE AHFE DIGITAL BOOKSTORE CATALOGUE
Explore the complete digital volume
Intelligent Human Systems Integration (IHSI 2026): Disruptive and Innovative Technologies
Read this individual research paper free through the original publisher, or explore the full digital proceedings book.
ISBN 978-1-964867-76-2
Explore this ISBN in the AHFE Bookstore ↗Listed in the July 2026 bookstore catalogue; search by ISBN to confirm current availability · Digital book purchase optional