Waldemar Titov, Carl Gerlach, Thomas Schlegel (2023). Designing a Digital Crown-Mapping Application for Pedestrian and Cyclists. In: Human Interaction and Emerging Technologies (IHIET-AI 2023): Artificial Intelligence and Future Applications. AHFE Open Access, vol. 70, pp. 9–17. https://doi.org/10.54941/ahfe1002924
1 Institute of Ubiquitous Mobility Systems (IUMS), Karlsruhe University of Applied Sciences, Moltkestrasse 30, Karlsruhe, Germany ↗
2 Institute for Intelligent Interactive Ubiquitous System (IIUS), Hochschule Furtwangen, University, Robert-Gerwig-Platz 1, Furtwangen im Schwarzwald, Germany ↗
Walking and cycling as active mobility have often been forgotten in research and planning in sub-Saharan Africa and only in recent years national and local authorities as well as international agencies are putting more effort on this topic. There are efforts to develop walking and cycling policies and infrastructure in cities like Nairobi and Kampala. However, these new infrastructure projects are minimal in scope, have design inadequacies that make them unusable or unattractive, are not wide enough to meet walking space standards, and are in places that do not serve the majority of the people who need to access them. To further promote active mobility in sub-Saharan Africa while building on existing activities, combined efforts of applied research and continuing education are required to better understand walking and cycling needs in an African Context. The promotion of active mobility can build on existing applied research activities in sub- Saharan Africa as well as transferable research activities in Germany, prior introduced by Hausmann et al. 2017. Nevertheless, there is still a need to better capture the requirements of the pedestrians and cyclists and to illustrate their needs.
Urban mobility is currently facing big changes. For a century, cars were the center of attention and dominated our perspective of urban mobility. The road and urban design were optimized for cars, which contributed to their explosive growth. Many cities currently face similar problems that are rela- ted to the rising number of cars. The most severe being congestions, pollution and space usage. Nowadays, urban planners realize that to effectively com- bat those problems they have to change their perspective on traffic and urban mobility as a whole. All road users have to be equally represented in the planning and design processes. This will ensure that we create sustainable, efficient and safe urban mobility. This, in turn, requires us to understand the needs, wishes, behavior and the physical and psychical limitations of every road user. Therefore, our project is set up in the field of mobile and pervasive participation, mobility research and urban planning and therefore addresses problems of mobility research as well as issues of the participation process.
Common participation processes in Germany rely on directly addressing resi- dents in areas that are selected for restructuring. Residents are reached via postal letters and are invited to participate in public meetings and discussi- ons about possible improvements in the infrastructure in their home district. However, this approach has three major shortcomings. These shortcomings concern the homogeneous structure of the audience at participative events, the lack of addressing pedestrians that are no residents in the area and the missing context and location reference at workshops and discussion panels.
Available and state of the art instruments for transport and traffic analy- ses are mainly focused on the capacity of transport infrastructure and are centered on car or bike traffic. An example is classical, typically manual, traffic counting and observation (Sisiopiku and Akin 2003). Another, more participatory instrument are road user surveys, where the choice of means of transport is inquired, usually with regard to certain stretches of road (Bahari and Hammond et al. 2013). Several methods, that aim at measu- ring walkability – the quality of infrastructure in communities concerning pedestrians – are surveyed and compared by Maghelal and Capp in 2011. However, mobility related data is still mainly gathered on motorized traffic. A report of the International Transport Forum (ITF) of 2012 calls walking the “neglected transport mode” and describes, that sufficient data on pedestrians is missing (OECD). It also reports, that specific methods to collect such data are missing as well (OECD). Walked distances are often not reported when people give an account of their mobility in studies, because the distances are short and people do not remember them. They are also not measured, when the main mode of transport of a distance is another, for example using the train. However, many people walk to reach the train station, but this part of the trip is not recorded separately (OECD). The report also points out, that pedestrians often are not represented in urban planning processes and there- fore issues of walking are not, or not adequately, addressed. The results of conventional participation methods and traffic analysis instruments are col- lected in analogous form and are therefore more cumbersome to analyze and reuse. The methods are elaborate processes and require many resources. Digi- tal artifacts are more easily structured, analyzed and reused (e.g. in evaluation stages after restructuring).
We therefore developed an in-situ crowd-mapping tool for collecting sub- jective feedback regarding the infrastructure of active mobile users. This way we apply a participation approach to survey the needs of pedestrian and cyclists that are used to enhance conventional participation efforts in civic restructuring processes and, at the same time, to support the studying of wal- king as a means of transport. Our approach is based on prior work from Hausmann et al. 2017. Moreover, considers most of the lessons learned that the work reports about. The application is designed to also address younger generations in contrast to the traditional audience of classical participation efforts. It is designed to allow non-residents to contribute to the analysis and to follow restructuring efforts, thus widening the target group of participants. The implemented instruments enable pedestrians to give feedback regarding their situation when they are in this situation. This way we utilize innovative
Designing a Digital Crowd-Mapping Application for Pedestrian and Cyclists 11
tools out of our toolbox presented by Boehm et al. 2020. Particularly the digi- tal crowd-mapping web application as well as research methods which can support applied research and teaching on active mobility. The web tool is developed and deployed in the research project called CAMA. CAMA stands for Collaboration for Active Mobility in Africa. The research project plans to research and promote active mobility especially with our application partners in the sub- Saharan Africa region.
ADDRESSING PEDESTRIANS IN PARTICIPATION PROCESSES Pedestrians are directly affected by most traffic and urban planning deci- sions, yet very often this mode of transport and pedestrian’s requirements are not taken into consideration. Even if they are, it is rare that walking is investigated in the field rather than by surveys or in workshops. Com- mon participation processes for urban planning in Germany rely on directly addressing residents in areas that are selected for restructuring.
In the Requirement Analyzes Phase, an initial analysis the specific requi- rements for the web tool are defined by all participating project collaborates as well as involved stakeholders from sub-Sahara Africa. In addition, the use of an open street map provider was favored as was as functionality for agreeing or disagreeing with already given feedback contributions was imple- mented. For local user and participants to be able to provide feedback the web tool was designed in English and adapted the feedback categories to the local requirements. So the pedestrians and cyclists are able to categories the existing infrastructure and provide feedback on which characteristics of the infrastructure they like and dislike. Another functional requirement formu- lated by the application partners was the ability to categorize the provided feedback and being able to provide free text answers as well as prior defined options. The first set of requirements were finalized within a workshop took place in April 2022 located in the countries of our application partners Kenya and Uganda.
Additional requirement adjustments were made to the concept as well as the web tool application and the use cases at the common workshop held from 13 to 19 November 2022. At the workshop “Hand on Sustainable Mobility in Karlsruhe” all project partners were present and finalized the requirements for the CAMA Crowd Mapping Web Tool.
Since there is a high share of smartphone ownership among the popula- tion in sub-Saharan Africa, the developed tool should be able to run and pick up the resulting benefits and limitations. Benefits like locations sensors especially in the mobile context as well as the multi-touch interaction. Consi- derable limitations are smaller screen sizes and limited resources like battery and computing power.
CROWD MAPPING WEB TOOL To overcome the listed challenges we designed and developed an approach, which provides an investigative approach for pedestrian related problems and improves the participation of pedestrians, specifically in the planning
process. We came up with the idea of a hurdle less crowd mapping online tool for providing feedback.
In order to locate problems on footpaths, we developed a web applica- tion, which any citizen can use to mark specific locations on a map and give statements describing the conflict or potential for improvement related to pedestrians or cyclists in these places. Depending on the quantity of problem submissions for an area, this problem can then be further investigated and validated using our feedback pillars.
Due to the planned course of the project, the users should generate as quickly and easily as possible feedback reports. Because of this, and because of restrictions in sensor-access, the functionalities of the app were not fully implemented as a web app. Instead, only the most important feature – sending feedback reports - was implemented at the beginning. Later the web app has been expanded to include new features. Therefore, we integrated a map, where the user can choose the location or path for the localization step and a form for the description step. Certainly, on the web app, pictures, videos or audio recordings may only be chosen from already existing files.
The user view of the developed crowd mapping web tool consist of various views that the participant will see while providing a feedback or reviewing other provided feedbacks. The web-based crown-mapping tool is applied for digital mapping exercises in Kampala, Nairobi and Mekelle. The implemen- tation of the mapping exercises is thereby organized and led by the local universities. We provides technical and organizational support to the applica- tion partners and ensures the comparability of the results. There are a number of specific test settings in all participating cities. In the first setting, a publi- city campaign for the crowd-mapping tool is conducted to attract normal pedestrians and cyclist to use the web tool.
On the left panel of the tools start screen, the interaction menu is located. The menu consists of overall five option. The options contain the home, the submit feedback and the map view buttons. Additionally two link buttons are provided leading the user to external contents. There is the about link and the imprint link linking to homepage of the CAMA project (CAMA homepage 2023). At the top of the view, an image slider is implemented showing a selection of local images. The images were taken by our project team while in Africa participating in the workshops with the application partners.
For the user view, the design pattern Material Design was chosen. The benefit of this design created and designed by Google is the high recogniza- bility and familiarity with the functions known from the android operating system. Material Design is a design language that combines the classic princi- ples of successful design along with innovation and technology. The goal is to develop a system of design that allows for a unified user experience across all their products on any platform. During the development, we placed great value on the web tool being responsive. This means that the web tool is sui- table for any screen size from as big as usual desktop computers to as small as present in mobile phones and tablets.
Thereby the interaction menu is collapsed an accessible via the hamburger button. The heading of the start page contains the, by the administrators prior set, use case name as well as the use case description being displayed below.
Designing a Digital Crowd-Mapping Application for Pedestrian and Cyclists 13
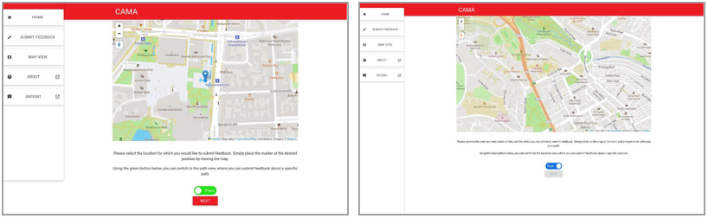
Figure 1: (a) Location for feedback at user’s current location; (b) path for feedback by setting two markers at the map.
A quick creation of a feedback can be done by clicking the floating action button marked by a plus symbol at the bottom right side of the start page. By clicking on the plus symbol or on the button, submit feedback the user presen- ted with a map where the type of the reported location can be selected. With the design element of a slider, two location types are available. Therefore, the users can decide whether the provided feedback concerns a point location or a path location. Beneath the slider, corresponding instructions are provi- ded. In the map, the well-known functions like zooming in and out by using the pinch gesture at a touchscreen, scrolling the mouse wheel or using the plus and minus icons in the ma are implemented. This way users experience the most comfort providing their feedback via the tool. Another major key functionality is the opportunity to indicate users own location. By clicking or tapping on the location pin located under the zoom icons at the top left side of the map the current location is requested. As soon as the own location is detected a blue circle is displayed as shown in Figure 1a and 1b. Displaying the users with their own location if helps to locate and indicate the infrastru- ctural object on which the feedback is reported. Figure 1a shows a feedback concerning a location. While in Figure 1b, the creation of a feedback concer- ning a path is displayed. To ensure the allocability of the provided feedback the next button is disabled, as shown in Figure 1b, until a valid location is provided. After selecting the location respectively, the path and clicking next the users are presented with the individual questionnaire view.
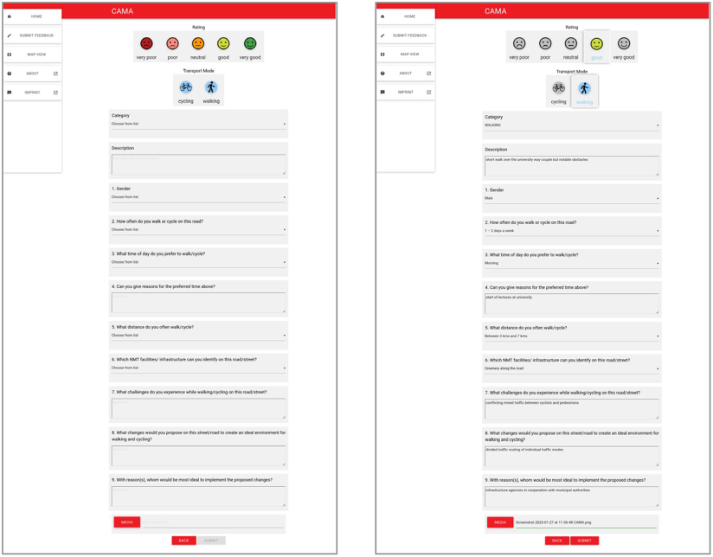
Based on the requirement analysis the application partners choose the approach to receive only completed answers. Based on this requirement we implemented a completeness condition that is set to check whether all requi- red statements are made or not. Out of design consideration after clicking on an icon, the non selected icons are getting grayed out as shown in Figure 2a and 2b. Each individual question whether with options or with free text is highlighted with a gray background color. This way the evidence of separa- ted questions and sections is increased for the users of the crowd mapping web tool.
Another functionality to increase the information value of user’s answers is that in the drop down menus of the option questions the start value is set to “choose from list”. This way the users are inducted to select an option from the list. After opening the drop down menu the option, “choose from list”
Figure 2: (a) Questionnaire to specify user’s feedback; (b) filled questionnaire with media attached.
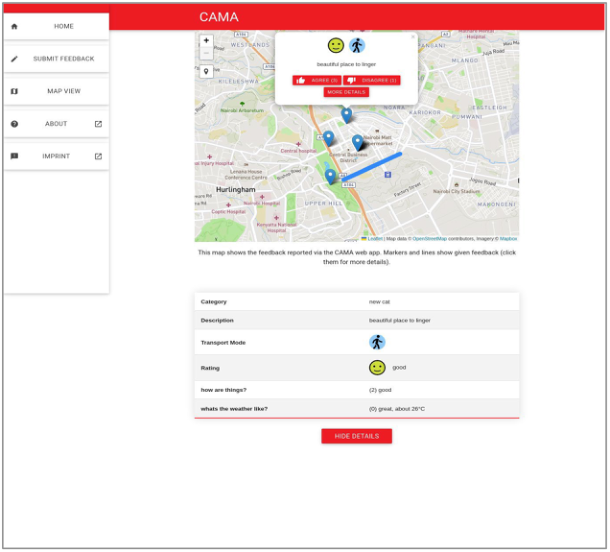
cannot be used as a valid option anymore. Besides, the users being able to add textual description of the reported locations or routes. If favored, user can share additional information to illustrate the situation through two kinds of media: the user may add pictures or videos by clicking on “media” as shown in Figure 2a and 2b. If the users are running the web tool on a mobile phone, they will be able to instantly take a picture or record a video, using the devi- ces’ camera and the microphone. Media may also be added from existing files. After setting the overall rating, providing the transportation mode by a simple click or tab on the corresponding icons and providing the required answers the submit button gets enabled. Hitting the submit button uploads the provided feedback of the users. The users are presented with a view. On the top right side, the users are thanked for the submitted contribution. This way we appreciate the participation in our real-world survey .The users are presented with a quick access page where the option to provide a “new feed- back”or “back to home”are offered. By clicking on the button, “Map View” the users are presented with all so far submitted feedback’s by all users. As shown in Figure 3 the map view presents location-based feedbacks as well as reported paths. By clicking on a pin or on the polyline on the map, a pop-up menu opens up containing most important information about this feedback. Among them both icons for the overall rating, the transportation mode and the description text. Additional details concerning a given feedback can be displayed by clicking on “more details”.
In order to achieve a high willingness for users to participate in the data col- lection, it was necessary that the web survey tool and campaigns offer benefit
Designing a Digital Crowd-Mapping Application for Pedestrian and Cyclists 15
Figure 3: Map View displaying all given feedbacks and additional information on one feedback.
to all users. We approached this requirement by providing the opportunity of rating the already given feedback’s to any user. As shown in Figure 3 user and now matter whether this is their post or not can express their thoughts by agreeing or disagreeing to this feedback.
To keep the additional opinion expression functionality manageable and prevent from misuse we implemented a two-way validation. The first vali- dation step is that a given user is able to provide only one agree or disagree action at a time. As shown in Figure 3 after clicking on the corresponding buttons both buttons are set disabled. Both buttons remain disabled until the user’s accesses the web tool once again. The second precaution that was implemented to prevent the tool to being misused is the ability to deactivate and hide given feedbacks by the administrators via the administrator compo- nent. In case of users making non-productive statements that feedback’s can be hidden and are no longer visible at the system.
After a beta-testing phase, the web tool was released and published on a globally accessible server. The beta test was conducted in cooperation with all application partners. During the beta-testing phase, a couple of inconsistencies were revealed and corrected for the final implementation.
APPLICATION OF THE CROWD MAPPING WEB TOOL Out application partner are currently applying the developed tool in the sub- Sahara African area. Thereby the tool is applied as part of existing planning
or participation processes. For example, the web tool is used together with school and university classes to map the requirements of pupils and students. In addition, the web tool is used as a tool for trained surveyors. Therefore, students and participants of the training program through seminar papers and master theses will support the digital data collection. In the near future, it is planed that a group of participants from the behavior survey from previous works will be asked to participate in the digital mapping of the infrastructure. This enables to match the results from the two different analysis. Additi- onally the quality and quantity of the data and the effort of the different settings can be compared. Based on the collected data the typology of the existing infrastructure will be mapped and statistical analysis of the reported challenges will be provided.
CONCLUSION
In this paper, we have presented a comprehensive crowd and web based mapping tool for the analysis of user’s mobility. We have described our requirement analysis developing tools for collecting user feedback on infra- structure used by pedestrians and cyclists. In addition, we presented the mapping tool we have developed ourselves for participation purposes. Cur- rently we are testing the mapping toll in several studies especially in the CAMA project with our sub-Saharan application partners. We reflected on the use and development of our tools and present the lessons learned. In this way, we want to contribute to the continuous improvement of these instruments and the resulting research on our urban mobility.
ACKNOWLEDGMENT
This work was conducted within the scope of the research project “CAMA – Collaboration for Active Mobility in Africa”. The authors would like to acknowledge our project partners for their valuable input to this project. Additionally we thank our colleagues Swenja Sawilla, Jonas Hansert and Catharina Lutz that supported our work or participated in it.
REFERENCES
Bahari, N. I., Arshad, A. K., & Yahya, Z. (2013, March). Assessing the pedestrians’ perception of the sidewalk facilities based on pedestrian travel purpose. In 2013 IEEE 9th International Colloquium on Signal Processing and its Applications (pp. 27–32). IEEE. Boehm, F., Keller, C., Titov, W., Trefzger, M., Kuspiel, J., Sawilla, S., & Schlegel, T.
(2020, July). Toolbox for analysis and evaluation of low-emission urban mobi- lity. In International Conference on Human-Computer Interaction (pp. 145–160). Springer, Cham. CAMA - Collaboration for Active Mobility in Africa Homepage 2023. URL: https://cama-project.com/ Hammond, V., & Musselwhite, C. (2013). The attitudes, perceptions and concerns
of pedestrians and vulnerable road users to shared space: A case study from the UK. Journal of Urban Design, 18(1), 78–97.
Designing a Digital Crowd-Mapping Application for Pedestrian and Cyclists 17
Hausmann, S., Keller, C., & Schlegel, T. (2017). Lessons Learned on the Design of Several Tools for Participation on Foot. IxD&A, 35, 205–226. Maghelal, P. K., & Capp, C. J. (2011). Walkability: A Review of Existing Pedestrian
Indices. Journal of the Urban & Regional Information Systems Association, 23(2). OECD. Publishing, International Transport Forum, & International Transport Forum. (2012). Pedestrian safety, urban space and health. Organization for Economic Co-operation and Development. Sisiopiku, V. P., & Akin, D. (2003). Pedestrian behaviors at and perceptions towards
various pedestrian facilities: an examination based on observation and survey data. Transportation Research Part F: Traffic Psychology and Behaviour, 6(4), 249–274.
LISTED IN THE AHFE DIGITAL BOOKSTORE CATALOGUE
Explore the complete digital volume
Human Interaction and Emerging Technologies (IHIET-AI 2023): Artificial Intelligence and Future Applications
Read this individual research paper free through the original publisher, or explore the full digital proceedings book.
ISBN 978-1-958651-46-9
Explore this ISBN in the AHFE Bookstore ↗Listed in the July 2026 bookstore catalogue; search by ISBN to confirm current availability · Digital book purchase optional