Swenja Sawilla, Waldemar Titov, Mathias Trefzger, Nicola Fricke (2023). Development of an Interaction Concept to Illustrate the Energy Transformation on an AR-Surface. In: Human Interaction and Emerging Technologies (IHIET-AI 2023): Artificial Intelligence and Future Applications. AHFE Open Access, vol. 70, pp. 223–231. https://doi.org/10.54941/ahfe1002947
Augmented Reality (AR) enables new forms of interaction and knowledge transfer for users. This paper describes a novel approach to visualize information of energy transformation on an AR-Surface. Aiming to provide a playful tangible interaction method with real data for citizens, especially for those locally effected by the changes in future energy production facilities; we analyzed which bifacial aspects can be drawn from the two novel interaction and visualization methods. Therefore, we projected databased information on the AR-Surface so that users were able to interact with the displayed information by placing or moving our own designed tangibles on the surface. In our user study, the participants interacted with a data set on renewable energy production. Through the tangible interaction, the user receives important information, e.g. about renewable energies and their performance. As an outcome of the study, we showed that the use of tangibles offers many advantages, such as fast and easy interaction on an AR-Surface as well as an improved user understanding. The gained insights will help for further implementations and visualizations in the field of AR combined with simple communication of energy topics.
Saving energy as a means to increase a more sustainable lifestyle is an impor- tant topic and has received increasing interest in the last couple of years. In order to change people’s behavior, knowledge transfer and participation can be key enablers. This idea of knowledge leading to increasing awareness stems from studies which have found higher correlations between higher education and public awareness of the term sustainability (e.g. Kuckartz & Rheingans- Heintze, 2006). Especially knowledge about energy transformation could increase awareness and in a possible next step willingness to engage in more sustainable behavior.
Therefore, in this paper we present an interaction concept of how informa- tion from a website related to energy topics is visualized on an AR-Surface. The website of the Baden-Württemberg (Germany) energy atlas including the
database was used for this research (LUBW, 2020). The aim was to attract users and strengthen their interest in the energy transformation through the provision of knowledge about energy transformation using AR. The intera- ction concept included a playful and realistic interaction that reaches beyond simple visualization and enables even non-experts to gain insight into the interrelationships of energy system components. The AR-Surface was already successfully used, for example to show mobility behaviour and changes to and on the campus of the University of Applied Sciences in Karlsruhe (Hoch- schule Karlsruhe, 2019). More details on augmented reality as visualisation and interaction method is provided in the next chapter.
STATE OF THE ART Augmented Reality refers to a computer-aided perception or representation that adds virtual aspects to the real world. By integrating cameras, additional information or objects are directly inserted into a currently captured image of the real world. This includes information of any kind, such as text or ima- ges. The application purposes reach from information about the immediate environment, over navigation faded into the field of vision (Markgraf, 2018). Furthermore, AR is one of the fastest growing areas in the computing field and it has pervaded many applications in the market. Hammady et al. (2016) for example introduced a communication model, which works as a roadmap for building an AR guidance system. This system is a successful method exam- ple for communicating with users. Besides, the authors proposed a novel way to enhance the user experience and learning processes by combining AR with games (Hammady, et al., 2016). Another example by Terrenghi et al. (2005) introduced a newly designed and developed learning cube as a novel tangible learning appliance. They created a general learning platform that supports test based quizzes where questions and answers are text or image based. The authors concluded that providing a playful interface for users, especially chil- dren, is a promising approach to embedding and integrating technology into the everyday context and activities of users (Terrenghi, et al., 2005). Ishii (2008) stated that in the process of human evolution, we have developed sophisticated skills to perceive and manipulate our physical environment, which are hardly used when interacting with simple graphical user interfa- ces. A third example is developed by researchers at the Cambridge Media Lab using a range of tangible and digital platforms for solutions in space design and urban planning. The tools range from simulations to quantify the impact of disruptive interventions in cities to application for communicative collabo- ration (Massachusetts Institute of Technology, 2020). The examples illustrate the benefits of tangibles in various comains as well as their advantages.
In the next chapter, the AR implementation and study approach used in this project is explained.
APPROACH OF THE INTERACTION CONCEPT ILLUSTRATING THE ENERGY TRANSFORMATION ON THE AR-SURFACE First, we conducted an online survey to obtain information about the citi- zens knowledge about AR and the energy transformation. Therefore, citizens
Development of an Interaction Concept to Illustrate the Energy Transformation 225
(N = 207) were asked about their knowledge of AR and the energy atlas. One result is that 67% of the participants were familiar with the term AR and 29% had already used an AR application. In addition, the results sho- wed a tendency for AR affinity to decrease with age. Another finding was that the surveyed students of all participants (N = 81) wanted to learn more about the energy transformation and they were interested in topics like access to sustainable electricity. Based on the results of our survey we chose young citizens (especially students) as our target group for the investigation of our AR-concept.
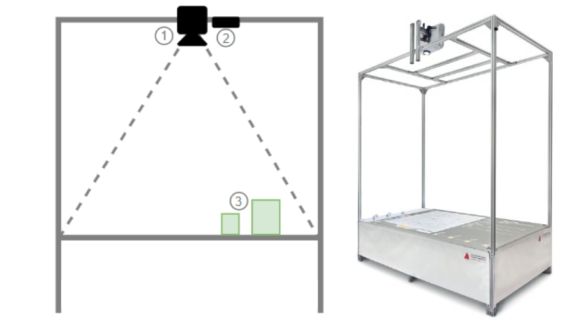
Figure 1: Sketch and Setup of the AR-Surface.
Figure 1 illustrates the setup of the AR-Surface. The beamer (1) projects images on the surface (table). The depth camera (2) recognizes the four mar- kers in every edge of the surface to calibrate the picture. It also recognizes the aruco-marker attached to the tangible (3). The total table size of the dynamic surface is about 2.5 m length and about 1.50 m width. The used beamer is able to cover the whole table with a distance of 2 m from beamer lens to the table surface. The height of the table is 0.6 m. More details are provided in Hansert et al. (2019). To start the interaction, the user must place a tangible on the surface and after that, the main menu opens up. Then the user can select the corresponding energy topics in the main menu.
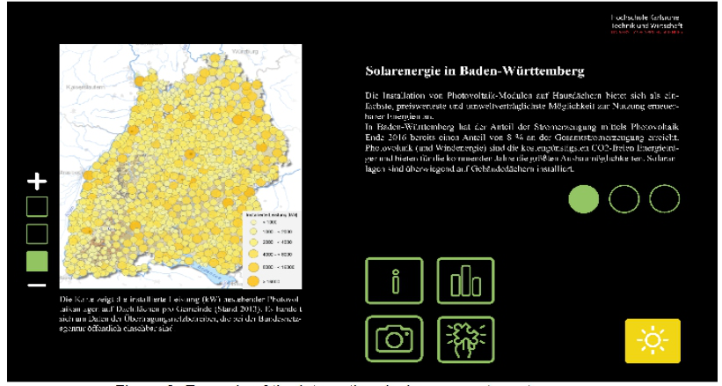
Figure 2 shows an example of the design. This illustration appears if the user places the tangible in the field of the corresponding energy category. In this case, the energy category sun is chosen and highlighted, as the yellow rectangle in the lower right corner of the user’s interface. The fields shown in green are interaction opportunities for the user. In this example, the potential areas for photovoltaic installations are shown on a map. With the plus and minus symbols users are able to zoom in and out of the map. By interacting with the green circles on the right, users are able to switch between different maps and their related information texts. In the middle of the surface, further interaction possibilities are offered such as statistics, pictures, puzzles or more information on the chosen energy category.
Figure 2: Example of the interaction design concept.
Table 1 shows the icons of the interaction concept and their meaning. These five interaction fields have an identical size (19x16 cm) to keep the concept consistent in the design. The energy categories are shown in their respective colour, all other interaction areas are highlighted in green.
Table 1. Icons used and their meaning.
Table available in the original PDF paper.
Icon Name Meaning Information More information about the energy atlas and its information from the website.
Image Current and pictorial highlights Game Playfully test the gained knowledge of the user
Statistic Comparison between the different energy categories and their performances Energy category Display of the selected energy category. In this case, the
user chose the sun category (photovoltaic).
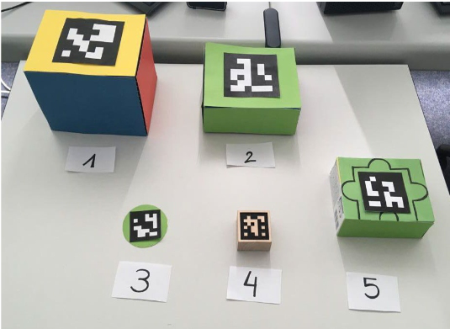
In a first step the main interaction concept was developed and afterwards the single tangibles. First, sketches of the tangibles were created and then drafted as prototypes. Figure 3 shows the prototypes for our concept. Tan- gible one is multicolour. Each colour stands for a different energy category. For example, yellow symbolize the category sun; blue symbolizes wind and red symbolizes fire. We implemented the tangible two, three and five as the green colours used in the concept. Tangible four is intentionally not green to see if the participants are able to classify it by the shape only. The developed
Development of an Interaction Concept to Illustrate the Energy Transformation 227
Figure 3: Prototypes of the tangibles.
tangibles have different shapes, sizes and materials to evaluate them later in our user study.
Interaction possibilities with the respective tangibles:
Tangible 1: Change between the different energy categories through turning the tangible in the icon field energy categories (shown in Table 1)
Tangible 2: Switch between the different menu-options (shown in Table 1)
Tangible 3: Switch between the different maps of the energy category (see Figure 1)
Tangible 4: Zooming in and out of the map (see Figure 1)
Tangible 5: For interaction in the game such as game-like questionnaires.
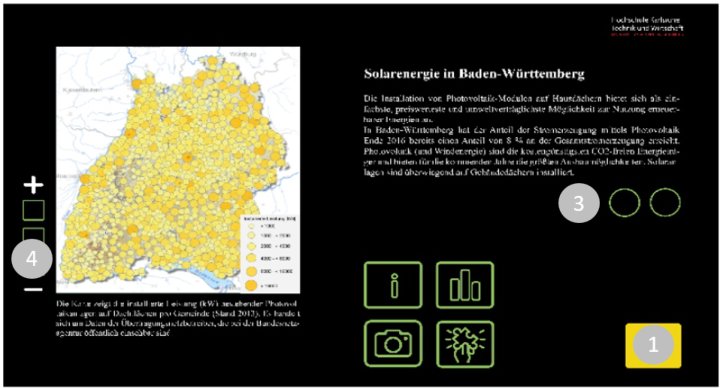
Figure 4: Example view through the users tangible interaction.
For this example view, tangible 1, 3 and 4 were used from the user. The user placed tangible 1 on the field of the sun and tangible 3 on the first field to get the information on solar energy in Baden-Württemberg. Furthermore, the user has zoomed one-step into the map with (see Figure 4).
EVALUATION In order to find out whether the users understand the interaction concept and whether difficulties occur during the interaction, we conducted a qualitative evaluation study. In addition, we investigated how the participants under- stood and interacted with the different tangibles. The aim was to find out which tangibles are best suited for such a concept. Additionally, we analy- sed how useful and understandable it is for the user to communicate about energy topics via the AR-Surface.
The participants were on average 23 years old. Two male participants and one female participant took part in the study. Due to the corona regulations in Germany (2020), there were contact bans and restrictions, which is why the number of participants was low. Because of the target group we chose, all participants were students. They all had heard of AR before, but none of them had used it yet. In addition, none of the participants was familiar with the energy atlas of Baden-Württemberg and had never interacted with a tangible.
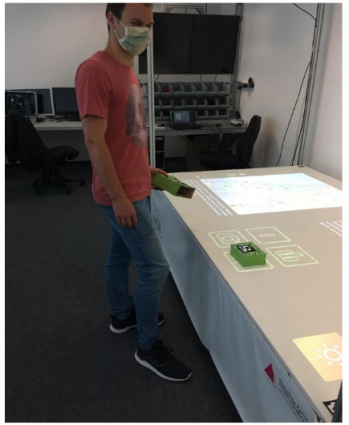
STUDY PROCEDURE AND RESULTS First, the participants had to fill out a questionnaire, requesting socio- demographic data and the participant’s knowledge about AR technologies. Afterwards, the participants interacted with the AR-Surface. Before the first interaction, participants were asked to describe the menu options and report what they understood by them. In this way, it was possible to assess whether the participants could clearly assign the icons and how they were understood. Afterwards, the participants were allowed to interact freely with the AR- Surface and the Tangibles (see Figure 5). They were filmed by a camera and
Figure 5: A participant during the study while interacting with the tangibles.
Development of an Interaction Concept to Illustrate the Energy Transformation 229
observed by the study leader, who noted down how the participants procee- ded and which tangibles were used in which interaction. After the participants interacted with the AR-Surface, they filled out a second questionnaire. The focus of this questionnaire was to evaluate the understanding of the informa- tion about the energy topics and to get feedback on our developed interaction concept. In addition, the participants were asked to rate the tangibles by ran- king them from one to five. For this purpose, they had to sort them from very satisfied to very unsatisfied.
Table 2 presents the participants’ results on our interaction concept. The overall interpretation is that all participants understood the visualization and interactions. Two participants were uncertain about the camera icon with which they assumed that they could take a picture of themselves. The partici- pants gave feedback that they would use the AR-Surface if it was in a public place such as a university and that they found the implementation successful. None of the participants found that the visualization and the information of the energy topics was overloaded. Furthermore, all participants found the general use of AR technology exciting.
The visualization of the AR-Surface was clear for me.
The icons are understandable for me 33,3% 66,7% The font is easy to read for me. 66,7% 33,3%
33,3% 66,7%
If the AR-Surface is located at a public place at the university, I would use it.
100%
Personally, I find the use of AR, in combination with a table, successful
33,3% 66,7%
The interaction opportunities are understandable for me.
33,3% 66,7%
I find the visualization of the information overloaded.
I find the use of AR exciting. 100%
All participants intuitively assigned the tangibles two, three and four (see Figure 3). Here the participants gave feedback that these tangibles have a clear shape and colour as well as a perfect match to the visualized interaction areas on the surface. All participants gave feedback that the tangibles three and four were particularly comfortable. Two participants found that tangible five was intelligible and convenient to interact with. Only one participant found tangible one suitable. He stated that he particularly liked the large tangible. The other two participants found it too big, requiring both hands for
interaction. They especially mentioned the small and narrow tangibles very pleasant to interact with. All participants liked the wood material of tangible four. In general, all participants said that wood and strong cardboard felt very comfortable and well suited for a playful interaction with the AR-Surface.
CONCLUSION AND OUTLOOK In this paper, we have described an approach to develop an AR interaction concept. We visualized relevant energy information from a website on a user friendly AR-Surface. In summary, we have achieved the following findings in our conducted user study. The participants liked the implementation of our AR-Surface and were very interested and excited about the interface. We conclude that the participants prefer easy to handle and comfortable tangi- bles. All the participants liked the tangible made of wood best, because it felt good to touch. Through observation and questioning, it became appa- rent that the participants intuitively assigned the tangibles correctly based on their shape and colour. None of the participants had an issue with the weight of the tangibles. Nevertheless, the rather heavier tangibles was better rated to interact with. In summary, we found that users are excited to learn about energy issues through the AR-Surface.Furthermore, the information was understandable and the users had no difficulties with the interaction. Thus, we conclude that the use of AR is worthwhile to make users curious about energy topics. With the help of further studies, we would like to con- tinuously develop the AR-Surface. For example, by using eye tracking, we could analyse further user behaviour and optimize our concept. In this con- text, it would be interesting to investigate to what point users can remember information from the website compared to our AR-Surface. All participants found the use of AR, in this context, exciting and we found that the use of AR can trigger the interest of users.
REFERENCES
Hammady, R., Ma, M. & Temple, N., (2016). Augmented Reality and Gamification in Heritage Museums. UK: Springer International Publishing AG. Hansert, J., Trefzger, M., & Schlegel, T. (2020, July). Interactive AR Models in Parti-
cipation Processes. In International Conference on Human-Computer Interaction (pp. 50–62). Springer, Cham. Hochschule Karlsruhe, (2019). KATZE: Hochschule Karlsruhe - Technik und Wirtschaft Zero Emission! [Online] available at: https://www.hs- karlsruhe.de/ivi/abgeschlossene-forschungsprojekte/katze/, [accessed 16. June 2020]. Institut für Ubiquitäre Mobilitätssysteme, (2020). Forschungsprojekte am IUMS.
[Online] available at: https://www.hs-karlsruhe.de/iums/forschung/, [accessed 15. June 2020]. Ishii, H., 2008. The tangible user interface and its evolution. s.l.:Communications of the ACM. Kuckartz, U. & Rheingans-Heintze, A. (2006). Trends im Umweltbewusstsein:
Umweltgerechtigkeit, Lebensqualität und persönliches Engagement. VS Verlag für Sozialwissenschaften.
Development of an Interaction Concept to Illustrate the Energy Transformation 231
LUBW, (2020). Energieatlas-BW. [Online] Available at: https://www.energieatlasbw.de/, [accessed 10 June 2020]. Markgraf D. (2018). Augmented Reality [Online] available at: https://wirtschaftslex
ikon.gabler.de/definition/augmented-reality-53628/version-276701 [accessed 15. February 2023]. Massachusetts Institute of Technology, (2020). MIT Media Lab. [Online] available at: https://www.media.mit.edu/, [accessed 15. June 2020]. Terrenghi, L., Kranz, M. & Paul, H., (2005). A cube to learn: a tangible user interface
for the design of a learning appliance. London: Springer-Verlag.
LISTED IN THE AHFE DIGITAL BOOKSTORE CATALOGUE
Explore the complete digital volume
Human Interaction and Emerging Technologies (IHIET-AI 2023): Artificial Intelligence and Future Applications
Read this individual research paper free through the original publisher, or explore the full digital proceedings book.
ISBN 978-1-958651-46-9
Explore this ISBN in the AHFE Bookstore ↗Listed in the July 2026 bookstore catalogue; search by ISBN to confirm current availability · Digital book purchase optional